Transformer Spare Parts Market Size and Share Forecast Outlook 2025 to 2035

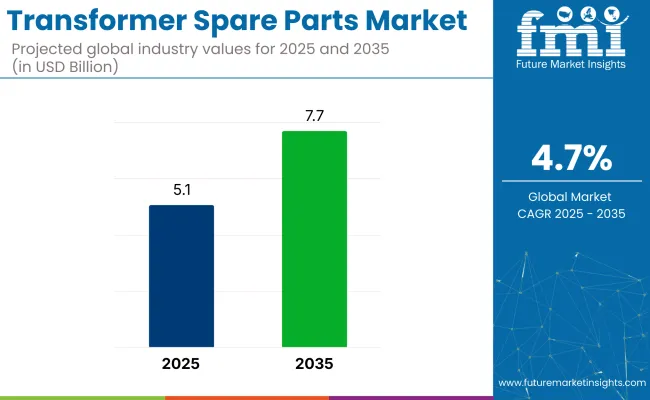
The transformer spare parts market is projected to increase from USD 5.1 billion in 2025 to USD 7.7 billion by 2035, registering a CAGR of 4.7% through the forecast period. This growth is being fueled by the aging global power grid infrastructure and the persistent need for maintenance, refurbishment, and reliability enhancement in energy transmission and distribution systems.
Quick Stats in Transformer Spare Parts Market

  • Market Size (2025): USD 5.1 billion
  • Market Forecast (2035): USD 7.7 billion
  • CAGR (2025 to 2035): 4.7%
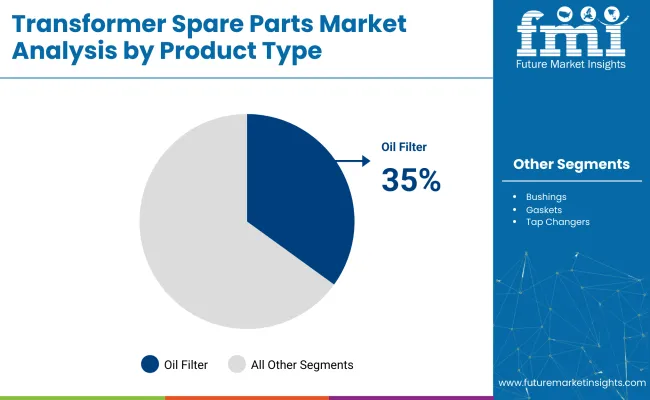
  • Top Product Type: Oil Filter (35% share in 2025)
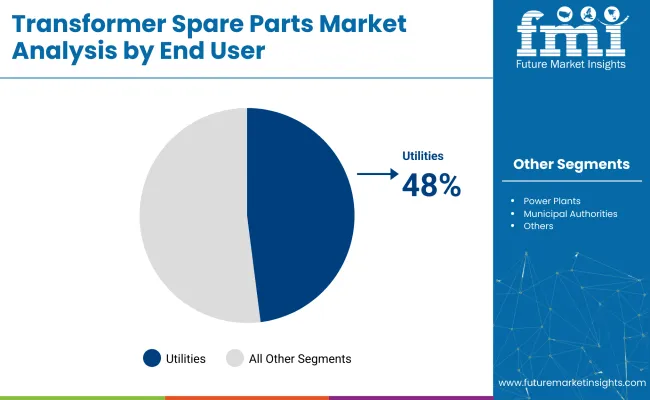
  • Leading End User: Utilities (48% share in 2025)
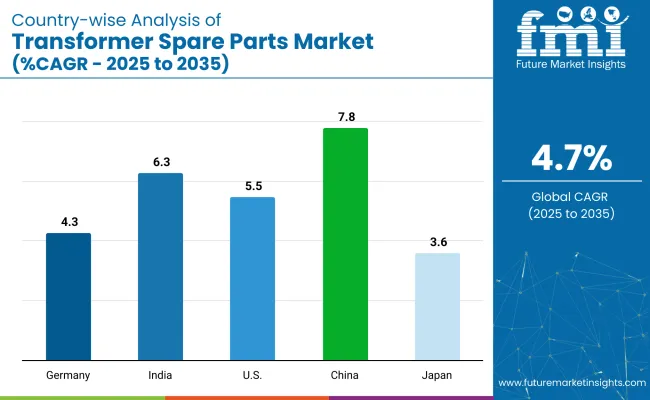
  • Key Growth Country: China (7.8% CAGR)

Transformer Spare Parts Market

As of 2025, the transformer spare parts market holds a specialized but vital share within several broader industrial segments. In the global transformer market, it contributes approximately 6-8%, driven by ongoing replacement needs for bushings, tap changers, gaskets, and cooling components. Within the power transmission and distribution equipment market, its share stands at 3-4%, supported by aging grid infrastructure and routine utility maintenance.

In the electrical components market, it represents about 2-3%, due to its focus on high-voltage applications. Within the energy infrastructure maintenance market, the contribution is higher at 5-6%, reflecting its role in asset reliability. In the utility equipment aftermarket, transformer spare parts account for 4-5%, as public and private utilities invest in extending equipment lifespan.

The transformer spare parts market operates through a multi-tiered supply chain involving OEMs, niche component suppliers, regional refurbishers, and utility-based service providers. From 2020 to 2024, aging grid infrastructure in countries such as Brazil, India, and Poland increased demand for high-wear components like bushings, gaskets, tap changers, and winding insulation kits. Manufacturers responded by establishing regional depots to ensure faster part availability for critical power nodes.

Several European countries are witnessing strong momentum in both greenfield and brownfield investments aimed at developing sustainable packaging systems for the food and beverage industry. The region has demonstrated a high level of acceptance for metal beverage cans, particularly aluminum, driven by growing environmental concerns and regulatory support.

In the aluminum beverage cans market, countries such as Germany, France, Italy, Spain, the UK, and Russia have embraced aluminum due to its favorable recyclability characteristics. Key industry players are heavily investing in advanced interior coatings that minimize chemical usage, aiming to strengthen their position amid increasing scrutiny from regulatory and environmental committees.

Analyzing Transformer Spare Parts Market by Top Investment Segments

Oil filters are anticipated to lead the product type segment with a 35% market share by 2025, while power transformers will dominate the transformer type segment with 60%. Oil-immersed transformers are expected to capture a 70% share of the transformer category, and utilities will emerge as the key end user with 48% share.

Oil Filters to Lead the Product Type Segment with 35% Market Share

Oil filters are projected to secure 35% of the product type segment by 2025, supported by their vital role in transformer longevity and efficiency.
  • Oil Filters help remove contaminants from transformer oil, preventing breakdowns and extending the service life of equipment. Regular oil filtration has become a standard maintenance practice for large-scale power infrastructure.
  • Utilities and industrial operators invest in quality oil filters to ensure uninterrupted transformer performance and reduce long-term operational costs. With grid modernization initiatives increasing globally, demand for oil filters as critical spare parts is expected to grow significantly.

Transformer Spare Parts Market Analysis By Product Type

Power Transformers to Dominate the Transformer Type Segment with 60% Market Share

Power transformers are forecast to command 60% of the transformer type segment in 2025, driven by their widespread use in high-voltage transmission networks.

  • Power Transformers play a crucial role in step-up and step-down voltage operations across regional and national grids. Their complexity and scale require ongoing maintenance and replacement of critical spare parts.
  • As power consumption rises and infrastructure is upgraded, the reliance on large-capacity power transformers is increasing. Utilities are allocating larger budgets toward spare parts inventories to ensure fast response times and system resilience.

Oil-Immersed Transformers to Lead the Transformer Category with 70% Market Share

Oil-immersed transformers are expected to account for 70% of the transformer category segment by 2025 due to their durability and superior insulation.

  • Oil-Immersed transformers use insulating oil for heat dissipation and dielectric strength, which makes them suitable for outdoor installations and high-load environments.
  • Maintenance of oil-immersed units involves frequent oil testing and replacement of key components like gaskets, seals, and bushings. As their global deployment grows, the need for compatible spare parts continues to rise.

Utilities to Dominate the End User Segment with 48% Market Share

Utilities are anticipated to lead the end user segment with a 48% market share in 2025, reflecting their central role in maintaining national power networks.
  • Organizations that manage numerous transformers require timely access to spare parts to prevent outages and maintain grid reliability. To support emergency repairs and planned maintenance, spare parts for transformers are stored in strategic stockpiles.
  • As governments push for infrastructure upgrades and energy security, utilities are increasing investments in transformer components, particularly for mission-critical installations.

Transformer Spare Parts Market Analysis By End User

Top Transformer Spare Parts Market Dynamics

The market is expanding steadily due to increasing demand for grid reliability, asset maintenance, and extended transformer lifespans. Utilities and industrial facilities are investing in timely replacements of key components to minimize downtime and avoid costly outages.

High Demand from Utilities and Power Distribution Networks

Utilities rely on critical transformer components such as bushings, tap changers, gaskets, cooling fans, and winding kits to ensure continuous power delivery. Regular maintenance and predictive failure analysis drive consistent replacement of these parts. Spare part availability supports fast repair, reducing the risk of blackouts and equipment failure.

  • Used in power grids to support transformer reliability and quick maintenance.
  • Key parts include bushings, gaskets, insulators, and tap changers.
  • Utilities maintain spare inventories to reduce service interruption.

Rising Aftermarket Demand from Industrial and Renewable Sectors

Industrial users and renewable energy operators are investing in transformer spares to reduce equipment downtime and support load fluctuations. Wind farms and solar power plants rely on timely part replacement to maintain stable energy output. Aftermarket services offer compatibility with both OEM and legacy systems.
  • Industrial plants and renewables invest in spares to avoid unplanned outages.
  • Aftermarket supports both modern and aging transformer fleets.
  • Critical for minimizing downtime in high-load and fluctuating environments.

Top Countries Manufacturing, Stocking, Exporting, and Driving Demand for Transformer Spare Parts

Country Wise Analysis Of Transformer Spare Parts Market

Countries CAGR (2025 to 2035)
China 7.8%
India 6.3%
USA 5.5%
Germany 4.3%
Japan 3.6%

China’s momentum is being driven by grid modernization, renewable integration, and large-scale industrial expansion. India is advancing its transformer spare parts sector through public electrification schemes and growth in smart substations. In contrast, developed economies such as the United States (5.5%), Germany (4.3%), and Japan (3.6%) are expanding at 0.75-0.92x of the global rate.

The USA focuses on retrofit kits and high-voltage spare part stocking. Germany emphasizes compact parts for wind energy and smart grid upgrades. Japan prioritizes space-saving components and long-life insulation materials. As the global transformer fleet ages, both replacement-led and expansion-led countries are shaping aftermarket and OEM supply strategies.

The report provides insights across 40+ countries. The five below are highlighted for their strategic influence and growth trajectory.

In-depth Analysis of Transformer Spare Parts Market in China

China’s market is projected to grow at a CAGR of 7.8% through 2035. Rapid transmission infrastructure expansion, particularly in rural and interior regions, is driving demand for core, coil, bushing, and tap changer replacements. Utilities are overhauling transformers for solar and wind integration. Local suppliers are manufacturing high-voltage bushings, radiators, and on-load tap changers at scale. State Grid projects across Central and Western China are requiring fast-moving spares.

  • Spare demand rising from ultra-high-voltage transmission upgrades
  • Local OEMs producing high-volume bushings and tap changers
  • State Grid-backed projects fueling part inventory expansion

Sales Analysis of Transformer Spare Parts Market in India

Indian is forecast to grow at a CAGR of 6.3% between 2025 and 2035. Public-sector utilities are modernizing substation networks under programs like RDSS and Saubhagya. Demand is rising for windings, insulating oils, and arc suppressors in rural networks. Local manufacturers are scaling production of standard parts for 11 kV to 66 kV class units. Solar parks in Rajasthan and Gujarat are generating demand for on-site replacement of cooling fins and tap switches.

  • Rural substation upgrades boosting demand for standard parts
  • Solar-linked transformer installations using high-reliability spares
  • Domestic suppliers providing mass-market windings and gaskets

Demand Outlook for Transformer Spare Parts Market in the United States

The USA market is expected to grow at a CAGR of 5.5% through 2035. Spare demand is rising in response to transformer aging, grid stress, and wildfire-prone utility zones. Power companies are stocking critical spares for sub-100 MVA units used in residential and industrial applications. OEM-certified bushings, fans, and terminal connectors are being used in preventive maintenance cycles. Federal funding for grid resilience is supporting proactive parts procurement.

  • Spare stocking rising due to transformer aging and climate risks
  • Preventive maintenance increasing orders of fans and connectors
  • Federal grid programs supporting transformer fleet renewal

Opportunity Analysis of Transformer Spare Parts Market in Germany

Germany is projected to grow at a CAGR of 4.3% during the forecast period. Energy transition programs and offshore wind grid upgrades are driving the need for advanced cooling components and protection relays. High-efficiency distribution transformers require compact bushing and winding designs with long service life. Domestic engineering firms are offering plug-and-play spares tailored to modular substation formats.

  • Wind integration projects increasing spare usage in coastal substations
  • OEMs producing plug-and-play spares for modular transformer bays
  • EU energy standards influencing spare part material specs

Growth Forecast for Transformer Spare Parts Market in Japan

Japan’s market is forecast to grow at a CAGR of 3.6% through 2035. Compact urban substations and grid efficiency upgrades are supporting demand for sealed bushings, tap diverters, and long-life insulation. Earthquake-resistant transformer designs are generating demand for rugged spare components. Utilities are focusing on condition-based monitoring to optimize replacement schedules. Japanese firms are investing in high-durability insulating paper and ceramic-coated spare parts for high-heat tolerance.

  • Spare usage rising in earthquake-resilient transformer formats
  • Monitoring tools guiding selective part replacement strategies
  • Ceramic-insulated and long-life spares in high urban demand

Leading Transformer Spare Parts Manufacturers

The market is moderately consolidated, with key players such as Hitachi Energy, Maschinenfabrik Reinhausen GmbH, and The H-J Family of Companies dominating global supply chains. These companies offer a wide range of components, from bushings and tap changers to gaskets and insulation parts, catering to power utilities and OEMs. Hitachi Energy focuses on high-voltage replacement parts and digitalized service kits.

Maschinenfabrik Reinhausen specializes in on-load tap changers and control accessories, known for precision and reliability. Regional suppliers like Asian Electrotech Industries LLP and Nanjing Electric International Co., Ltd. serve localized markets in Asia with cost-effective alternatives. Stephens Gaskets Ltd. and RAM Gaskets supply vital sealing components, reinforcing the aftermarket ecosystem.

Recent Transformer Spare Parts Industry News

  • In March 2025, Hitachi Energy announced an investment of USD 250 million to expand production of critical transformer components including bushings and insulation. The initiative targets facilities in Virginia, Missouri, and Mississippi to meet rising global demand from electrification and AI-driven infrastructure growth.
  • In December 2024, RESA Power acquired Power Asset Recovery Corporation (PARC), adding high-voltage spare parts such as LTC switches, pumps, bushings, and gauges to its portfolio. The acquisition enhanced RESA’s nationwide service capabilities and inventory strength.

Leading Players in Transformer Spare Parts Market

  • Hitachi Energy
  • Asian Electrotech Industries LLP
  • Nanjing Electric International Co., Ltd.
  • The H-J Family of Companies
  • Maschinenfabrik Reinhausen GmbH
  • RAM Gaskets
  • BaronUSA, LLC
  • Stephens Gaskets Ltd.

Report Coverage and Scope Summary

Report Attributes Details
Market Size (2025) USD 5.1 billion
Projected Market Size (2035) USD 7.7 billion
CAGR (2025 to 2035) 4.7%
Base Year for Estimation 2024
Historical Period 2020 to 2024
Projections Period 2025 to 2035
Quantitative Units USD billion for market value
Product Types Analyzed (Segment 1) Bushings, Relays, Gaskets, Busbars, Tap Changers, Oil Filters, Flow Switches
Transformer Types Analyzed (Segment 2) Power Transformers, Distribution Transformers
Transformer Categories Analyzed (Segment 3) Dry Type, Oil Immersed
End Users Analyzed (Segment 4) Power Plants, Utilities, Municipal Authorities, Industrial Facilities, Non-Industrial Sectors
Regions Covered North America, Latin America, Eastern Europe, Western Europe, South Asia & Pacific, East Asia, Middle East & Africa
Countries Covered United States, Canada, Germany, United Kingdom, France, Japan, China, India, South Korea, Brazil
Key Players Hitachi Energy, Asian Electrotech Industries LLP, Nanjing Electric International Co., Ltd., The H-J Family of Companies, Maschinenfabrik Reinhausen GmbH, RAM Gaskets, BaronUSA, LLC, Stephens Gaskets Ltd.
Additional Attributes Dollar sales by product and transformer type, rising demand for aging grid refurbishments, consistent utility sector investments, and expansion of aftermarket services for long-life transformer operation.

Transformer Spare Parts Market Analyzed by Key Investment Segments

By Product Type:

The market is segmented by product type into bushings, relays, gaskets, busbars, tap changers, oil filters, and flow switches.

By Transformer Type:

Based on transformer type, the market includes power transformers and distribution transformers.

By Transformer Category:

By category, transformers are classified into dry type and oil immersed units.

By End User:

Key end users include power plants, utilities, municipal authorities, industrial facilities, and non-industrial sectors.

By Region:

Geographically, the market spans North America, Latin America, Eastern Europe, Western Europe, South Asia & Pacific, East Asia, and the Middle East & Africa.

Table of Content

  1. Executive Summary
    • Global Market Outlook
    • Demand-side Trends
    • Supply-side Trends
    • Technology Roadmap Analysis
    • Analysis and Recommendations
  2. Market Overview
    • Market Coverage / Taxonomy
    • Market Definition / Scope / Limitations
  3. Market Background
    • Market Dynamics
      • Drivers
      • Restraints
      • Opportunity
      • Trends
    • Scenario Forecast
      • Demand in Optimistic Scenario
      • Demand in Likely Scenario
      • Demand in Conservative Scenario
    • Opportunity Map Analysis
    • Product Life Cycle Analysis
    • Supply Chain Analysis
      • Supply Side Participants and their Roles
        • Producers
        • Mid-Level Participants (Traders/ Agents/ Brokers)
        • Wholesalers and Distributors
      • Value Added and Value Created at Node in the Supply Chain
      • List of Raw Material Suppliers
      • List of Existing and Potential Buyer’s
    • Investment Feasibility Matrix
    • Value Chain Analysis
      • Profit Margin Analysis
      • Wholesalers and Distributors
      • Retailers
    • PESTLE and Porter’s Analysis
    • Regulatory Landscape
      • By Key Regions
      • By Key Countries
    • Regional Parent Market Outlook
    • Production and Consumption Statistics
    • Import and Export Statistics
  4. Global Market Analysis 2020 to 2024 and Forecast, 2025 to 2035
    • Historical Market Size Value (USD Billion) & Volume (Units) Analysis, 2020 to 2024
    • Current and Future Market Size Value (USD Billion) & Volume (Units) Projections, 2025 to 2035
      • Y-o-Y Growth Trend Analysis
      • Absolute $ Opportunity Analysis
  5. Global Market Pricing Analysis 2020 to 2024 and Forecast 2025 to 2035
  6. Global Market Analysis 2020 to 2024 and Forecast 2025 to 2035, By Product Type
    • Introduction / Key Findings
    • Historical Market Size Value (USD Billion) & Volume (Units) Analysis By Product Type, 2020 to 2024
    • Current and Future Market Size Value (USD Billion) & Volume (Units) Analysis and Forecast By Product Type, 2025 to 2035
      • Bushings
      • Relays
      • Gaskets
      • Busbars
      • Tap Changers
      • Oil Filters
      • Flow Switches
    • Y-o-Y Growth Trend Analysis By Product Type, 2020 to 2024
    • Absolute $ Opportunity Analysis By Product Type, 2025 to 2035
  7. Global Market Analysis 2020 to 2024 and Forecast 2025 to 2035, By Transformer Type
    • Introduction / Key Findings
    • Historical Market Size Value (USD Billion) & Volume (Units) Analysis By Transformer Type, 2020 to 2024
    • Current and Future Market Size Value (USD Billion) & Volume (Units) Analysis and Forecast By Transformer Type, 2025 to 2035
      • Power Transformer
      • Distribution Transformer
    • Y-o-Y Growth Trend Analysis By Transformer Type, 2020 to 2024
    • Absolute $ Opportunity Analysis By Transformer Type, 2025 to 2035
  8. Global Market Analysis 2020 to 2024 and Forecast 2025 to 2035, By Transformer Category
    • Introduction / Key Findings
    • Historical Market Size Value (USD Billion) & Volume (Units) Analysis By Transformer Category, 2020 to 2024
    • Current and Future Market Size Value (USD Billion) & Volume (Units) Analysis and Forecast By Transformer Category, 2025 to 2035
      • Dry Type
      • Oil Immersed
    • Y-o-Y Growth Trend Analysis By Transformer Category, 2020 to 2024
    • Absolute $ Opportunity Analysis By Transformer Category, 2025 to 2035
  9. Global Market Analysis 2020 to 2024 and Forecast 2025 to 2035, By End User
    • Introduction / Key Findings
    • Historical Market Size Value (USD Billion) & Volume (Units) Analysis By End User, 2020 to 2024
    • Current and Future Market Size Value (USD Billion) & Volume (Units) Analysis and Forecast By End User, 2025 to 2035
      • Power Plants
      • Utilities
      • Municipal
      • Industrial
      • Non Industrial
    • Y-o-Y Growth Trend Analysis By End User, 2020 to 2024
    • Absolute $ Opportunity Analysis By End User, 2025 to 2035
  10. Global Market Analysis 2020 to 2024 and Forecast 2025 to 2035, By Region
    • Introduction
    • Historical Market Size Value (USD Billion) & Volume (Units) Analysis By Region, 2020 to 2024
    • Current Market Size Value (USD Billion) & Volume (Units) Analysis and Forecast By Region, 2025 to 2035
      • North America
      • Latin America
      • Western Europe
      • Eastern Europe
      • East Asia
      • South Asia & Pacific
      • Middle East and Africa
    • Market Attractiveness Analysis By Region
  11. North America Market Analysis 2020 to 2024 and Forecast 2025 to 2035, By Country
    • Historical Market Size Value (USD Billion) & Volume (Units) Trend Analysis By Market Taxonomy, 2020 to 2024
    • Market Size Value (USD Billion) & Volume (Units) Forecast By Market Taxonomy, 2025 to 2035
      • By Country
        • USA
        • Canada
        • Mexico
      • By Product Type
      • By Transformer Type
      • By Transformer Category
      • By End User
    • Market Attractiveness Analysis
      • By Country
      • By Product Type
      • By Transformer Type
      • By Transformer Category
      • By End User
    • Key Takeaways
  12. Latin America Market Analysis 2020 to 2024 and Forecast 2025 to 2035, By Country
    • Historical Market Size Value (USD Billion) & Volume (Units) Trend Analysis By Market Taxonomy, 2020 to 2024
    • Market Size Value (USD Billion) & Volume (Units) Forecast By Market Taxonomy, 2025 to 2035
      • By Country
        • Brazil
        • Argentina
        • Rest of LATAM
      • By Product Type
      • By Transformer Type
      • By Transformer Category
      • By End User
    • Market Attractiveness Analysis
      • By Country
      • By Product Type
      • By Transformer Type
      • By Transformer Category
      • By End User
    • Key Takeaways
  13. Western Europe Market Analysis 2020 to 2024 and Forecast 2025 to 2035, By Country
    • Historical Market Size Value (USD Billion) & Volume (Units) Trend Analysis By Market Taxonomy, 2020 to 2024
    • Market Size Value (USD Billion) & Volume (Units) Forecast By Market Taxonomy, 2025 to 2035
      • By Country
        • Germany
        • Italy
        • France
        • UK
        • Spain
        • BENELUX
        • Nordic
        • Rest of W.Europe
      • By Product Type
      • By Transformer Type
      • By Transformer Category
      • By End User
    • Market Attractiveness Analysis
      • By Country
      • By Product Type
      • By Transformer Type
      • By Transformer Category
      • By End User
    • Key Takeaways
  14. Eastern Europe Market Analysis 2020 to 2024 and Forecast 2025 to 2035, By Country
    • Historical Market Size Value (USD Billion) & Volume (Units) Trend Analysis By Market Taxonomy, 2020 to 2024
    • Market Size Value (USD Billion) & Volume (Units) Forecast By Market Taxonomy, 2025 to 2035
      • By Country
        • Russia
        • Hungary
        • Poland
        • Balkan & Baltics
        • Rest of E. Europe
      • By Product Type
      • By Transformer Type
      • By Transformer Category
      • By End User
    • Market Attractiveness Analysis
      • By Country
      • By Product Type
      • By Transformer Type
      • By Transformer Category
      • By End User
    • Key Takeaways
  15. East Asia Market Analysis 2020 to 2024 and Forecast 2025 to 2035, By Country
    • Historical Market Size Value (USD Billion) & Volume (Units) Trend Analysis By Market Taxonomy, 2020 to 2024
    • Market Size Value (USD Billion) & Volume (Units) Forecast By Market Taxonomy, 2025 to 2035
      • By Country
        • China
        • Japan
        • South Korea
      • By Product Type
      • By Transformer Type
      • By Transformer Category
      • By End User
    • Market Attractiveness Analysis
      • By Country
      • By Product Type
      • By Transformer Type
      • By Transformer Category
      • By End User
    • Key Takeaways
  16. South Asia & Pacific Market Analysis 2020 to 2024 and Forecast 2025 to 2035, By Country
    • Historical Market Size Value (USD Billion) & Volume (Units) Trend Analysis By Market Taxonomy, 2020 to 2024
    • Market Size Value (USD Billion) & Volume (Units) Forecast By Market Taxonomy, 2025 to 2035
      • By Country
        • India
        • Australia & New Zealand
        • ASEAN
        • Rest of SAP
      • By Product Type
      • By Transformer Type
      • By Transformer Category
      • By End User
    • Market Attractiveness Analysis
      • By Country
      • By Product Type
      • By Transformer Type
      • By Transformer Category
      • By End User
    • Key Takeaways
  17. Middle East and Africa Market Analysis 2020 to 2024 and Forecast 2025 to 2035, By Country
    • Historical Market Size Value (USD Billion) & Volume (Units) Trend Analysis By Market Taxonomy, 2020 to 2024
    • Market Size Value (USD Billion) & Volume (Units) Forecast By Market Taxonomy, 2025 to 2035
      • By Country
        • GCC Countries
        • Northern Africa
        • South Africa
        • Turkiye
        • Rest of MEA
      • By Product Type
      • By Transformer Type
      • By Transformer Category
      • By End User
    • Market Attractiveness Analysis
      • By Country
      • By Product Type
      • By Transformer Type
      • By Transformer Category
      • By End User
    • Key Takeaways
  18. Key Countries Market Analysis
    • USA
      • Pricing Analysis
      • Market Share Analysis, 2024
        • By Product Type
        • By Transformer Type
        • By Transformer Category
        • By End User
    • Canada
      • Pricing Analysis
      • Market Share Analysis, 2024
        • By Product Type
        • By Transformer Type
        • By Transformer Category
        • By End User
    • Brazil
      • Pricing Analysis
      • Market Share Analysis, 2024
        • By Product Type
        • By Transformer Type
        • By Transformer Category
        • By End User
    • Mexico
      • Pricing Analysis
      • Market Share Analysis, 2024
        • By Product Type
        • By Transformer Type
        • By Transformer Category
        • By End User
    • Argentina
      • Pricing Analysis
      • Market Share Analysis, 2024
        • By Product Type
        • By Transformer Type
        • By Transformer Category
        • By End User
  19. Market Structure Analysis
    • Competition Dashboard
    • Competition Benchmarking
    • Market Share Analysis of Top Players
      • By Regional
      • By Product Type
      • By Transformer Type
      • By Transformer Category
      • By End User
  20. Competition Analysis
    • Competition Deep Dive
      • Hitachi Energy
        • Overview
        • Product Portfolio
        • Profitability by Market Segments (Product/Age /Sales Channel/Region)
        • Sales Footprint
        • Strategy Overview
          • Marketing Strategy
          • Product Strategy
          • Channel Strategy
      • Asian Electrotech Industries LLP
        • Overview
        • Product Portfolio
        • Profitability by Market Segments (Product/Age /Sales Channel/Region)
        • Sales Footprint
        • Strategy Overview
          • Marketing Strategy
          • Product Strategy
          • Channel Strategy
      • Nanjing Electric International Co., Ltd.
        • Overview
        • Product Portfolio
        • Profitability by Market Segments (Product/Age /Sales Channel/Region)
        • Sales Footprint
        • Strategy Overview
          • Marketing Strategy
          • Product Strategy
          • Channel Strategy
      • The H-J Family of Companies
        • Overview
        • Product Portfolio
        • Profitability by Market Segments (Product/Age /Sales Channel/Region)
        • Sales Footprint
        • Strategy Overview
          • Marketing Strategy
          • Product Strategy
          • Channel Strategy
      • Maschinenfabrik Reinhausen GmbH
        • Overview
        • Product Portfolio
        • Profitability by Market Segments (Product/Age /Sales Channel/Region)
        • Sales Footprint
        • Strategy Overview
          • Marketing Strategy
          • Product Strategy
          • Channel Strategy
      • RAM Gaskets
        • Overview
        • Product Portfolio
        • Profitability by Market Segments (Product/Age /Sales Channel/Region)
        • Sales Footprint
        • Strategy Overview
          • Marketing Strategy
          • Product Strategy
          • Channel Strategy
      • BaronUSA, LLC
        • Overview
        • Product Portfolio
        • Profitability by Market Segments (Product/Age /Sales Channel/Region)
        • Sales Footprint
        • Strategy Overview
          • Marketing Strategy
          • Product Strategy
          • Channel Strategy
      • Stephens Gaskets Ltd.
        • Overview
        • Product Portfolio
        • Profitability by Market Segments (Product/Age /Sales Channel/Region)
        • Sales Footprint
        • Strategy Overview
          • Marketing Strategy
          • Product Strategy
          • Channel Strategy
  21. Assumptions & Acronyms Used
  22. Research Methodology

List of Tables

  • Table 1: Global Market Value (USD Billion) Forecast by Region, 2020 to 2035
  • Table 2: Global Market Volume (Units) Forecast by Region, 2020 to 2035
  • Table 3: Global Market Value (USD Billion) Forecast by Product Type, 2020 to 2035
  • Table 4: Global Market Volume (Units) Forecast by Product Type, 2020 to 2035
  • Table 5: Global Market Value (USD Billion) Forecast by Transformer Type, 2020 to 2035
  • Table 6: Global Market Volume (Units) Forecast by Transformer Type, 2020 to 2035
  • Table 7: Global Market Value (USD Billion) Forecast by Transformer Category, 2020 to 2035
  • Table 8: Global Market Volume (Units) Forecast by Transformer Category, 2020 to 2035
  • Table 9: Global Market Value (USD Billion) Forecast by End User, 2020 to 2035
  • Table 10: Global Market Volume (Units) Forecast by End User, 2020 to 2035
  • Table 11: North America Market Value (USD Billion) Forecast by Country, 2020 to 2035
  • Table 12: North America Market Volume (Units) Forecast by Country, 2020 to 2035
  • Table 13: North America Market Value (USD Billion) Forecast by Product Type, 2020 to 2035
  • Table 14: North America Market Volume (Units) Forecast by Product Type, 2020 to 2035
  • Table 15: North America Market Value (USD Billion) Forecast by Transformer Type, 2020 to 2035
  • Table 16: North America Market Volume (Units) Forecast by Transformer Type, 2020 to 2035
  • Table 17: North America Market Value (USD Billion) Forecast by Transformer Category, 2020 to 2035
  • Table 18: North America Market Volume (Units) Forecast by Transformer Category, 2020 to 2035
  • Table 19: North America Market Value (USD Billion) Forecast by End User, 2020 to 2035
  • Table 20: North America Market Volume (Units) Forecast by End User, 2020 to 2035
  • Table 21: Latin America Market Value (USD Billion) Forecast by Country, 2020 to 2035
  • Table 22: Latin America Market Volume (Units) Forecast by Country, 2020 to 2035
  • Table 23: Latin America Market Value (USD Billion) Forecast by Product Type, 2020 to 2035
  • Table 24: Latin America Market Volume (Units) Forecast by Product Type, 2020 to 2035
  • Table 25: Latin America Market Value (USD Billion) Forecast by Transformer Type, 2020 to 2035
  • Table 26: Latin America Market Volume (Units) Forecast by Transformer Type, 2020 to 2035
  • Table 27: Latin America Market Value (USD Billion) Forecast by Transformer Category, 2020 to 2035
  • Table 28: Latin America Market Volume (Units) Forecast by Transformer Category, 2020 to 2035
  • Table 29: Latin America Market Value (USD Billion) Forecast by End User, 2020 to 2035
  • Table 30: Latin America Market Volume (Units) Forecast by End User, 2020 to 2035
  • Table 31: Western Europe Market Value (USD Billion) Forecast by Country, 2020 to 2035
  • Table 32: Western Europe Market Volume (Units) Forecast by Country, 2020 to 2035
  • Table 33: Western Europe Market Value (USD Billion) Forecast by Product Type, 2020 to 2035
  • Table 34: Western Europe Market Volume (Units) Forecast by Product Type, 2020 to 2035
  • Table 35: Western Europe Market Value (USD Billion) Forecast by Transformer Type, 2020 to 2035
  • Table 36: Western Europe Market Volume (Units) Forecast by Transformer Type, 2020 to 2035
  • Table 37: Western Europe Market Value (USD Billion) Forecast by Transformer Category, 2020 to 2035
  • Table 38: Western Europe Market Volume (Units) Forecast by Transformer Category, 2020 to 2035
  • Table 39: Western Europe Market Value (USD Billion) Forecast by End User, 2020 to 2035
  • Table 40: Western Europe Market Volume (Units) Forecast by End User, 2020 to 2035
  • Table 41: Eastern Europe Market Value (USD Billion) Forecast by Country, 2020 to 2035
  • Table 42: Eastern Europe Market Volume (Units) Forecast by Country, 2020 to 2035
  • Table 43: Eastern Europe Market Value (USD Billion) Forecast by Product Type, 2020 to 2035
  • Table 44: Eastern Europe Market Volume (Units) Forecast by Product Type, 2020 to 2035
  • Table 45: Eastern Europe Market Value (USD Billion) Forecast by Transformer Type, 2020 to 2035
  • Table 46: Eastern Europe Market Volume (Units) Forecast by Transformer Type, 2020 to 2035
  • Table 47: Eastern Europe Market Value (USD Billion) Forecast by Transformer Category, 2020 to 2035
  • Table 48: Eastern Europe Market Volume (Units) Forecast by Transformer Category, 2020 to 2035
  • Table 49: Eastern Europe Market Value (USD Billion) Forecast by End User, 2020 to 2035
  • Table 50: Eastern Europe Market Volume (Units) Forecast by End User, 2020 to 2035
  • Table 51: East Asia Market Value (USD Billion) Forecast by Country, 2020 to 2035
  • Table 52: East Asia Market Volume (Units) Forecast by Country, 2020 to 2035
  • Table 53: East Asia Market Value (USD Billion) Forecast by Product Type, 2020 to 2035
  • Table 54: East Asia Market Volume (Units) Forecast by Product Type, 2020 to 2035
  • Table 55: East Asia Market Value (USD Billion) Forecast by Transformer Type, 2020 to 2035
  • Table 56: East Asia Market Volume (Units) Forecast by Transformer Type, 2020 to 2035
  • Table 57: East Asia Market Value (USD Billion) Forecast by Transformer Category, 2020 to 2035
  • Table 58: East Asia Market Volume (Units) Forecast by Transformer Category, 2020 to 2035
  • Table 59: East Asia Market Value (USD Billion) Forecast by End User, 2020 to 2035
  • Table 60: East Asia Market Volume (Units) Forecast by End User, 2020 to 2035
  • Table 61: South Asia & Pacific Market Value (USD Billion) Forecast by Country, 2020 to 2035
  • Table 62: South Asia & Pacific Market Volume (Units) Forecast by Country, 2020 to 2035
  • Table 63: South Asia & Pacific Market Value (USD Billion) Forecast by Product Type, 2020 to 2035
  • Table 64: South Asia & Pacific Market Volume (Units) Forecast by Product Type, 2020 to 2035
  • Table 65: South Asia & Pacific Market Value (USD Billion) Forecast by Transformer Type, 2020 to 2035
  • Table 66: South Asia & Pacific Market Volume (Units) Forecast by Transformer Type, 2020 to 2035
  • Table 67: South Asia & Pacific Market Value (USD Billion) Forecast by Transformer Category, 2020 to 2035
  • Table 68: South Asia & Pacific Market Volume (Units) Forecast by Transformer Category, 2020 to 2035
  • Table 69: South Asia & Pacific Market Value (USD Billion) Forecast by End User, 2020 to 2035
  • Table 70: South Asia & Pacific Market Volume (Units) Forecast by End User, 2020 to 2035
  • Table 71: Middle East and Africa Market Value (USD Billion) Forecast by Country, 2020 to 2035
  • Table 72: Middle East and Africa Market Volume (Units) Forecast by Country, 2020 to 2035
  • Table 73: Middle East and Africa Market Value (USD Billion) Forecast by Product Type, 2020 to 2035
  • Table 74: Middle East and Africa Market Volume (Units) Forecast by Product Type, 2020 to 2035
  • Table 75: Middle East and Africa Market Value (USD Billion) Forecast by Transformer Type, 2020 to 2035
  • Table 76: Middle East and Africa Market Volume (Units) Forecast by Transformer Type, 2020 to 2035
  • Table 77: Middle East and Africa Market Value (USD Billion) Forecast by Transformer Category, 2020 to 2035
  • Table 78: Middle East and Africa Market Volume (Units) Forecast by Transformer Category, 2020 to 2035
  • Table 79: Middle East and Africa Market Value (USD Billion) Forecast by End User, 2020 to 2035
  • Table 80: Middle East and Africa Market Volume (Units) Forecast by End User, 2020 to 2035

List of Figures

  • Figure 1: Global Market Volume (Units) Forecast 2020 to 2035
  • Figure 2: Global Market Pricing Analysis
  • Figure 3: Global Market Value (USD Billion) Forecast 2020 to 2035
  • Figure 4: Global Market Value Share and BPS Analysis by Product Type, 2025 and 2035
  • Figure 5: Global Market Y-o-Y Growth Comparison by Product Type, 2025 to 2035
  • Figure 6: Global Market Attractiveness Analysis by Product Type
  • Figure 7: Global Market Value Share and BPS Analysis by Transformer Type, 2025 and 2035
  • Figure 8: Global Market Y-o-Y Growth Comparison by Transformer Type, 2025 to 2035
  • Figure 9: Global Market Attractiveness Analysis by Transformer Type
  • Figure 10: Global Market Value Share and BPS Analysis by Transformer Category, 2025 and 2035
  • Figure 11: Global Market Y-o-Y Growth Comparison by Transformer Category, 2025 to 2035
  • Figure 12: Global Market Attractiveness Analysis by Transformer Category
  • Figure 13: Global Market Value Share and BPS Analysis by End User, 2025 and 2035
  • Figure 14: Global Market Y-o-Y Growth Comparison by End User, 2025 to 2035
  • Figure 15: Global Market Attractiveness Analysis by End User
  • Figure 16: Global Market Value (USD Billion) Share and BPS Analysis by Region, 2025 and 2035
  • Figure 17: Global Market Y-o-Y Growth Comparison by Region, 2025 to 2035
  • Figure 18: Global Market Attractiveness Analysis by Region
  • Figure 19: North America Market Incremental $ Opportunity, 2025 to 2035
  • Figure 20: Latin America Market Incremental $ Opportunity, 2025 to 2035
  • Figure 21: Western Europe Market Incremental $ Opportunity, 2025 to 2035
  • Figure 22: Eastern Europe Market Incremental $ Opportunity, 2025 to 2035
  • Figure 23: East Asia Market Incremental $ Opportunity, 2025 to 2035
  • Figure 24: South Asia & Pacific Market Incremental $ Opportunity, 2025 to 2035
  • Figure 25: Middle East and Africa Market Incremental $ Opportunity, 2025 to 2035
  • Figure 26: North America Market Value Share and BPS Analysis by Country, 2025 and 2035
  • Figure 27: North America Market Value Share and BPS Analysis by Product Type, 2025 and 2035
  • Figure 28: North America Market Y-o-Y Growth Comparison by Product Type, 2025 to 2035
  • Figure 29: North America Market Attractiveness Analysis by Product Type
  • Figure 30: North America Market Value Share and BPS Analysis by Transformer Type, 2025 and 2035
  • Figure 31: North America Market Y-o-Y Growth Comparison by Transformer Type, 2025 to 2035
  • Figure 32: North America Market Attractiveness Analysis by Transformer Type
  • Figure 33: North America Market Value Share and BPS Analysis by Transformer Category, 2025 and 2035
  • Figure 34: North America Market Y-o-Y Growth Comparison by Transformer Category, 2025 to 2035
  • Figure 35: North America Market Attractiveness Analysis by Transformer Category
  • Figure 36: North America Market Value Share and BPS Analysis by End User, 2025 and 2035
  • Figure 37: North America Market Y-o-Y Growth Comparison by End User, 2025 to 2035
  • Figure 38: North America Market Attractiveness Analysis by End User
  • Figure 39: Latin America Market Value Share and BPS Analysis by Country, 2025 and 2035
  • Figure 40: Latin America Market Value Share and BPS Analysis by Product Type, 2025 and 2035
  • Figure 41: Latin America Market Y-o-Y Growth Comparison by Product Type, 2025 to 2035
  • Figure 42: Latin America Market Attractiveness Analysis by Product Type
  • Figure 43: Latin America Market Value Share and BPS Analysis by Transformer Type, 2025 and 2035
  • Figure 44: Latin America Market Y-o-Y Growth Comparison by Transformer Type, 2025 to 2035
  • Figure 45: Latin America Market Attractiveness Analysis by Transformer Type
  • Figure 46: Latin America Market Value Share and BPS Analysis by Transformer Category, 2025 and 2035
  • Figure 47: Latin America Market Y-o-Y Growth Comparison by Transformer Category, 2025 to 2035
  • Figure 48: Latin America Market Attractiveness Analysis by Transformer Category
  • Figure 49: Latin America Market Value Share and BPS Analysis by End User, 2025 and 2035
  • Figure 50: Latin America Market Y-o-Y Growth Comparison by End User, 2025 to 2035
  • Figure 51: Latin America Market Attractiveness Analysis by End User
  • Figure 52: Western Europe Market Value Share and BPS Analysis by Country, 2025 and 2035
  • Figure 53: Western Europe Market Value Share and BPS Analysis by Product Type, 2025 and 2035
  • Figure 54: Western Europe Market Y-o-Y Growth Comparison by Product Type, 2025 to 2035
  • Figure 55: Western Europe Market Attractiveness Analysis by Product Type
  • Figure 56: Western Europe Market Value Share and BPS Analysis by Transformer Type, 2025 and 2035
  • Figure 57: Western Europe Market Y-o-Y Growth Comparison by Transformer Type, 2025 to 2035
  • Figure 58: Western Europe Market Attractiveness Analysis by Transformer Type
  • Figure 59: Western Europe Market Value Share and BPS Analysis by Transformer Category, 2025 and 2035
  • Figure 60: Western Europe Market Y-o-Y Growth Comparison by Transformer Category, 2025 to 2035
  • Figure 61: Western Europe Market Attractiveness Analysis by Transformer Category
  • Figure 62: Western Europe Market Value Share and BPS Analysis by End User, 2025 and 2035
  • Figure 63: Western Europe Market Y-o-Y Growth Comparison by End User, 2025 to 2035
  • Figure 64: Western Europe Market Attractiveness Analysis by End User
  • Figure 65: Eastern Europe Market Value Share and BPS Analysis by Country, 2025 and 2035
  • Figure 66: Eastern Europe Market Value Share and BPS Analysis by Product Type, 2025 and 2035
  • Figure 67: Eastern Europe Market Y-o-Y Growth Comparison by Product Type, 2025 to 2035
  • Figure 68: Eastern Europe Market Attractiveness Analysis by Product Type
  • Figure 69: Eastern Europe Market Value Share and BPS Analysis by Transformer Type, 2025 and 2035
  • Figure 70: Eastern Europe Market Y-o-Y Growth Comparison by Transformer Type, 2025 to 2035
  • Figure 71: Eastern Europe Market Attractiveness Analysis by Transformer Type
  • Figure 72: Eastern Europe Market Value Share and BPS Analysis by Transformer Category, 2025 and 2035
  • Figure 73: Eastern Europe Market Y-o-Y Growth Comparison by Transformer Category, 2025 to 2035
  • Figure 74: Eastern Europe Market Attractiveness Analysis by Transformer Category
  • Figure 75: Eastern Europe Market Value Share and BPS Analysis by End User, 2025 and 2035
  • Figure 76: Eastern Europe Market Y-o-Y Growth Comparison by End User, 2025 to 2035
  • Figure 77: Eastern Europe Market Attractiveness Analysis by End User
  • Figure 78: East Asia Market Value Share and BPS Analysis by Country, 2025 and 2035
  • Figure 79: East Asia Market Value Share and BPS Analysis by Product Type, 2025 and 2035
  • Figure 80: East Asia Market Y-o-Y Growth Comparison by Product Type, 2025 to 2035
  • Figure 81: East Asia Market Attractiveness Analysis by Product Type
  • Figure 82: East Asia Market Value Share and BPS Analysis by Transformer Type, 2025 and 2035
  • Figure 83: East Asia Market Y-o-Y Growth Comparison by Transformer Type, 2025 to 2035
  • Figure 84: East Asia Market Attractiveness Analysis by Transformer Type
  • Figure 85: East Asia Market Value Share and BPS Analysis by Transformer Category, 2025 and 2035
  • Figure 86: East Asia Market Y-o-Y Growth Comparison by Transformer Category, 2025 to 2035
  • Figure 87: East Asia Market Attractiveness Analysis by Transformer Category
  • Figure 88: East Asia Market Value Share and BPS Analysis by End User, 2025 and 2035
  • Figure 89: East Asia Market Y-o-Y Growth Comparison by End User, 2025 to 2035
  • Figure 90: East Asia Market Attractiveness Analysis by End User
  • Figure 91: South Asia & Pacific Market Value Share and BPS Analysis by Country, 2025 and 2035
  • Figure 92: South Asia & Pacific Market Value Share and BPS Analysis by Product Type, 2025 and 2035
  • Figure 93: South Asia & Pacific Market Y-o-Y Growth Comparison by Product Type, 2025 to 2035
  • Figure 94: South Asia & Pacific Market Attractiveness Analysis by Product Type
  • Figure 95: South Asia & Pacific Market Value Share and BPS Analysis by Transformer Type, 2025 and 2035
  • Figure 96: South Asia & Pacific Market Y-o-Y Growth Comparison by Transformer Type, 2025 to 2035
  • Figure 97: South Asia & Pacific Market Attractiveness Analysis by Transformer Type
  • Figure 98: South Asia & Pacific Market Value Share and BPS Analysis by Transformer Category, 2025 and 2035
  • Figure 99: South Asia & Pacific Market Y-o-Y Growth Comparison by Transformer Category, 2025 to 2035
  • Figure 100: South Asia & Pacific Market Attractiveness Analysis by Transformer Category
  • Figure 101: South Asia & Pacific Market Value Share and BPS Analysis by End User, 2025 and 2035
  • Figure 102: South Asia & Pacific Market Y-o-Y Growth Comparison by End User, 2025 to 2035
  • Figure 103: South Asia & Pacific Market Attractiveness Analysis by End User
  • Figure 104: Middle East and Africa Market Value Share and BPS Analysis by Country, 2025 and 2035
  • Figure 105: Middle East and Africa Market Value Share and BPS Analysis by Product Type, 2025 and 2035
  • Figure 106: Middle East and Africa Market Y-o-Y Growth Comparison by Product Type, 2025 to 2035
  • Figure 107: Middle East and Africa Market Attractiveness Analysis by Product Type
  • Figure 108: Middle East and Africa Market Value Share and BPS Analysis by Transformer Type, 2025 and 2035
  • Figure 109: Middle East and Africa Market Y-o-Y Growth Comparison by Transformer Type, 2025 to 2035
  • Figure 110: Middle East and Africa Market Attractiveness Analysis by Transformer Type
  • Figure 111: Middle East and Africa Market Value Share and BPS Analysis by Transformer Category, 2025 and 2035
  • Figure 112: Middle East and Africa Market Y-o-Y Growth Comparison by Transformer Category, 2025 to 2035
  • Figure 113: Middle East and Africa Market Attractiveness Analysis by Transformer Category
  • Figure 114: Middle East and Africa Market Value Share and BPS Analysis by End User, 2025 and 2035
  • Figure 115: Middle East and Africa Market Y-o-Y Growth Comparison by End User, 2025 to 2035
  • Figure 116: Middle East and Africa Market Attractiveness Analysis by End User
  • Figure 117: Global Market - Tier Structure Analysis
  • Figure 118: Global Market - Company Share Analysis

Frequently Asked Questions

What is the current size of the transformer spare parts market?

The market is valued at USD 5.1 billion in 2025 and is projected to reach USD 7.7 billion by 2035.

What is the expected CAGR of the transformer spare parts market?

The market is projected to expand at a CAGR of 4.7% between 2025 and 2035.

Which is the top-selling product type in the transformer spare parts market?

Oil filters are the leading product type, accounting for 35% of the global market share in 2025.

Who are the leading end users of transformer spare parts?

Utilities dominate the end-user segment with a 48% share in 2025, driven by ongoing grid upgrades and transformer maintenance needs.

Which country will exhibit the fastest growth in transformer spare parts demand?

China is forecast to register the highest CAGR at 7.8% from 2025 to 2035, driven by grid modernization and renewable energy expansion.

Explore Similar Insights

Future Market Insights

Transformer Spare Parts Market