The medium voltage transformer industry stands at the threshold of a decade-long expansion trajectory that promises to reshape power distribution technology, grid modernization solutions, and advanced transformer applications. The market's journey from USD 14.4 billion in 2025 to USD 21.6 billion by 2035 represents substantial growth, demonstrating the accelerating adoption of advanced transformer configurations and digital monitoring technology across power utilities, industrial facilities, commercial buildings, and renewable energy sectors.
The first half of the decade (2025-2030) will witness the market climbing from USD 14.4 billion to approximately USD 17.7 billion, adding USD 3.3 billion in value, which constitutes 45% of the total forecast growth period. This phase will be characterized by the rapid adoption of oil-immersed transformer systems, driven by increasing grid modernization requirements and the growing need for high-performance distribution equipment worldwide. Advanced digital monitoring capabilities and eco-design efficiency standards will become standard expectations rather than premium options.
The latter half (2030-2035) will witness sustained growth from USD 17.7 billion to USD 21.6 billion, representing an addition of USD 3.9 billion or 55% of the decade's expansion. This period will be defined by mass market penetration of specialized dry-type transformer systems, integration with comprehensive smart grid platforms, and seamless compatibility with existing distribution infrastructure. The market trajectory signals fundamental shifts in how utilities approach distribution reliability optimization and asset management, with participants positioned to benefit from sustained demand across multiple rating classes and end-use segments.
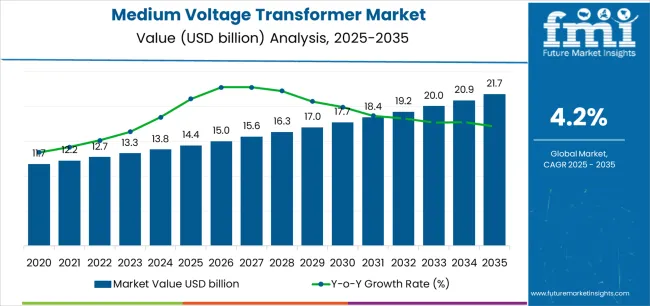
The Medium Voltage Transformer market demonstrates distinct growth phases with varying market characteristics and competitive dynamics. Between 2025 and 2030, the market progresses through its grid modernization phase, expanding from USD 14.4 billion to USD 17.7 billion with steady annual increments averaging 4.2% growth. This period showcases the transition from conventional aging transformers to advanced digital-ready systems with enhanced efficiency standards and integrated condition monitoring becoming mainstream features.
The 2025-2030 phase adds USD 3.3 billion to market value, representing 45% of total decade expansion. Market maturation factors include standardization of digital monitoring protocols, declining costs for ester-filled and eco-design transformers, and increasing utility awareness of asset optimization benefits reaching 20-30% lifecycle cost reduction in distribution applications. Competitive landscape evolution during this period features established equipment manufacturers like Hitachi Energy and Siemens Energy expanding their smart transformer portfolios while specialty manufacturers focus on advanced insulation development and enhanced fire safety capabilities.
From 2030 to 2035, market dynamics shift toward advanced grid integration and renewable energy expansion, with growth continuing from USD 17.7 billion to USD 21.6 billion, adding USD 3.9 billion or 55% of total expansion. This phase transition centers on fully integrated digital substations, compatibility with comprehensive grid management networks, and deployment across diverse utility and industrial scenarios, becoming standard rather than specialized applications. The competitive environment matures with focus shifting from basic power transformation to comprehensive grid intelligence systems and integration with predictive maintenance platforms.
| Metric | Value |
|---|---|
| Market Value (2025) | USD 14.4 billion |
| Market Forecast (2035) | USD 21.6 billion |
| Growth Rate | 4.2% CAGR |
| Leading Technology | Oil-Immersed Product Type |
| Primary End Use | Power Utilities Segment |
The market demonstrates strong fundamentals with oil-immersed transformer systems capturing a dominant share through proven reliability and cost-effectiveness capabilities. Power utility applications drive primary demand, supported by increasing distribution network expansion and substation modernization technology requirements. Geographic expansion remains concentrated in Asian markets with rapid electrification infrastructure, while developed economies show steady adoption rates driven by aging asset replacement and rising efficiency standards.
Market expansion rests on three fundamental shifts driving adoption across the power utility, industrial, and renewable energy sectors. First, grid modernization investment creates compelling infrastructure advantages through medium voltage transformers that provide reliable distribution stepping without transmission-level costs, enabling utilities to expand service coverage while maintaining power quality and reducing technical losses across urban and rural networks. Second, renewable energy integration acceleration worldwide as wind and solar facilities require medium voltage equipment for grid interconnection, enabling distributed generation connectivity and power injection that align with decarbonization targets and renewable portfolio standards.
Third, industrial facility expansion drives adoption from manufacturing plants and processing facilities requiring dedicated substations that address production capacity growth while maintaining voltage regulation during heavy-load operations and sensitive process requirements. However, growth faces headwinds from commodity price volatility that affects copper and electrical steel costs impacting transformer economics, which may limit procurement in price-sensitive utility budgets. Supply chain constraints also persist regarding specialized components including bushings, tap changers, and cooling systems that may extend lead times in high-demand periods, which affect project schedules and grid expansion timelines.
The medium voltage transformer market represents a critical infrastructure opportunity driven by expanding electricity access, grid reliability enhancement, and the need for superior distribution efficiency in diverse applications. As utilities worldwide seek to achieve 98-99% reliability targets, reduce technical losses by 15-25%, and integrate advanced monitoring systems with asset management platforms, medium voltage transformers are evolving from passive distribution equipment to intelligent grid assets ensuring power quality and operational excellence.
The market's growth trajectory from USD 14.4 billion in 2025 to USD 21.6 billion by 2035 at a 4.2% CAGR reflects fundamental shifts in electrification requirements and grid resilience optimization. Geographic expansion opportunities are particularly pronounced in Asian developing markets, while the dominance of oil-immersed systems (52% market share) and power utility applications (41% share) provides clear strategic focus areas.
Strengthening the dominant oil-immersed transformer segment (52% market share) through enhanced cooling configurations, superior efficiency standards, and ester-fluid alternatives. This pathway focuses on optimizing insulation systems, improving thermal management, extending equipment lifespan to 30-40 year service cycles, and developing eco-design compliant units for diverse climate applications. Market leadership consolidation through materials engineering and digital sensor integration enables premium positioning while defending competitive advantages against dry-type alternatives. Expected revenue pool: USD 325-425 million
Rapid urbanization growth and renewable energy integration across Asia creates substantial opportunities through local manufacturing partnerships and utility relationships. Growing industrial demand and distributed generation interconnection drive sustained transformer requirements. Regional strategies enhance service networks, enable faster delivery, and position companies advantageously for government electrification programs while accessing expanding distribution infrastructure markets. Expected revenue pool: USD 285-370 million
Expansion within the dominant power utilities segment (41% market share) through specialized transformers addressing distribution automation, smart grid integration, and reliability enhancement requirements. This pathway encompasses digital monitoring integration, load management capability, and compatibility with advanced metering infrastructure. Premium positioning reflects superior reliability and comprehensive asset intelligence supporting modern utility operations. Expected revenue pool: USD 245-320 million
Strategic advancement in 1,500 kVA rating class (39% market share) requires optimized designs and manufacturing efficiency addressing volume distribution applications. This pathway addresses standardized configurations, factory testing optimization, and modular cooling systems with proven performance reliability. Competitive pricing reflects economies of scale and design maturity through high-volume production supporting utility fleet standardization. Expected revenue pool: USD 210-275 million
Development of advanced three-phase transformers (78% market share) for primary distribution networks addressing balanced load distribution and power quality requirements. This pathway encompasses vector group optimization, harmonic mitigation capability, and comprehensive protection integration. Technology differentiation through electromagnetic design enables market consolidation while serving mainstream utility and industrial applications requiring three-phase power. Expected revenue pool: USD 185-240 million
Expansion targeting industrial end users (27% market share) through specialized transformers for refineries, petrochemical plants, and metals production requiring reliable on-site distribution. This pathway encompasses explosion-proof enclosures, harmonic-rated designs, and specialized cooling for continuous heavy-load operation. Market development through application engineering enables differentiated positioning while accessing capital-intensive industrial projects requiring custom specifications. Expected revenue pool: USD 160-210 million
Development of comprehensive condition monitoring systems addressing asset health optimization and failure prevention requirements across transformer fleets. This pathway encompasses dissolved gas analysis, partial discharge monitoring, and comprehensive analytics platforms. Premium positioning reflects maintenance cost reduction and reliability improvement while enabling access to utilities pursuing predictive asset management and grid resilience enhancement programs. Expected revenue pool: USD 140-180 million
Primary Classification: The market segments by product type into Oil-Immersed and Dry-Type categories, representing the evolution from conventional mineral oil cooling to advanced solid insulation solutions for comprehensive power distribution optimization.
Secondary Classification: Rating segmentation divides the market into <1,200 kVA, 1,200 kVA, 1,500 kVA, 2,000 kVA, 2,500 kVA, and >2,500 kVA classes, reflecting distinct power capacity requirements for distribution network applications.
Tertiary Classification: Configuration segmentation encompasses Three-Phase and Single-Phase systems, representing different electrical architectures for utility and specialized applications.
Quaternary Classification: End use segmentation includes Power Utilities, Industrial facilities, Commercial buildings, and Residential & Others, representing diverse installation requirements for voltage transformation.
Quinary Classification: Regional segmentation covers Asia, North America, Europe, Middle East & Africa, and Latin America, with emerging markets leading capacity additions while developed economies focus on replacement and efficiency upgrades.
Regional Classification: Geographic distribution demonstrates Asia's dominance in new installations supporting electrification expansion, North America's focus on aging infrastructure replacement and grid modernization, and Europe's emphasis on eco-design standards and renewable integration.
The segmentation structure reveals technology progression from conventional mineral oil systems toward ester-filled and solid-insulation alternatives with enhanced safety and environmental performance, while application diversity spans from utility primary distribution to specialized industrial on-site substations requiring comprehensive power quality solutions.
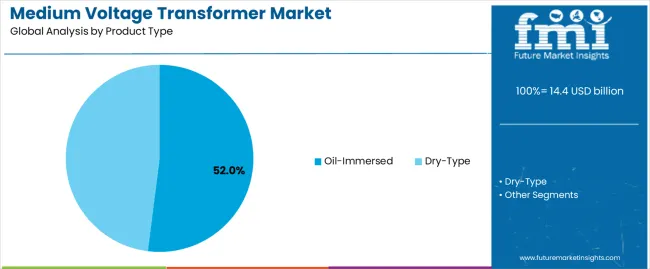
Market Position: Oil-immersed transformer systems command the leading position in the Medium Voltage Transformer market with approximately 52% market share through proven reliability features, including superior cooling efficiency, robust overload capability, and cost-effectiveness that enable utilities to achieve optimal power distribution across diverse environmental conditions.
Value Drivers: The segment benefits from utility preference for field-proven technology that provides consistent thermal management, established maintenance protocols, and lower initial capital costs without requiring specialized installation environments. Advanced mineral oil and ester-fluid systems enable effective heat dissipation, extended equipment lifespan, and outdoor installation flexibility, where thermal performance and economic value represent critical procurement requirements.
Competitive Advantages: Oil-immersed systems differentiate through proven outdoor weatherability, optimal capacity-to-cost ratios, and widespread service technician familiarity that enhance long-term reliability while maintaining total cost of ownership suitable for utility-scale deployments and budget-constrained electrification programs.
Key market characteristics:
Dry-type transformer systems maintain 48% market share due to their essential fire safety advantages, indoor installation suitability, and reduced environmental risk eliminating liquid containment requirements. These systems address commercial buildings, data centers, underground substations, and urban installations requiring non-flammable insulation and minimal maintenance access for occupied facility integration.
.webp)
Market Context: Mid-range 1,500 kVA transformers dominate the medium voltage transformer market with approximately 39% market share due to optimal capacity fit for typical distribution feeders and widespread adoption addressing suburban residential clusters, commercial developments, and light industrial facilities that maximize load serving without excessive headroom.
Appeal Factors: Utilities prioritize standardized ratings, inventory interchangeability, and proven load-growth accommodation that enable efficient distribution network planning without custom engineering for typical service areas. The segment benefits from substantial production volumes enabling competitive pricing and established design validation supporting reliable performance across diverse applications from residential subdivisions to commercial centers.
Growth Drivers: Urban expansion programs incorporate 1,500 kVA transformers as standard distribution infrastructure for new developments, while utility fleet standardization increases procurement concentration in proven rating classes that optimize spare part inventory and maintenance training for operational efficiency.
Market Challenges: Varying load density across service territories may result in oversizing or undersizing requiring supplementary ratings for optimal network design.
Application dynamics include:
Rating class 1,200 kVA maintains 24% market share through rural distribution, small commercial loads, and legacy network compatibility. The 2,000 kVA segment captures 22% share via denser urban distribution, large commercial buildings, and industrial facilities requiring higher capacity. The 2,500 kVA and larger ratings demonstrate 15% combined adoption in heavy industrial plants, data centers, and high-rise buildings with concentrated electrical loads.
Growth Accelerators: Grid modernization investment drives primary adoption as medium voltage transformers provide distribution backbone infrastructure that enables utilities to replace aging assets while improving reliability without requiring transmission-level capital expenditure, supporting service quality enhancement and network resilience that align with regulatory performance standards and customer expectations. Renewable energy integration demand accelerates market expansion as solar farms and wind facilities require step-up transformers for grid connection while maintaining power quality during distributed generation injection and intermittent production patterns. Industrial expansion spending increases worldwide, creating sustained demand for on-site distribution transformers that complement manufacturing capacity additions, process electrification, and facility automation initiatives providing reliable power for production continuity.
Growth Inhibitors: Commodity price volatility affects copper conductor and electrical steel costs creating procurement uncertainty and budget pressure, which may delay utility capital programs in cost-constrained environments or regions with regulated rate recovery limitations. Lead time extension persists regarding specialized components including tap changers, bushings, and monitoring systems that may impact project schedules in high-demand periods, affecting grid expansion timelines and industrial commissioning deadlines. Market fragmentation across custom specifications and utility-specific standards creates engineering complexity and inventory challenges between different regional requirements and application-specific modifications.
Market Evolution Patterns: Adoption accelerates in emerging markets with electrification gaps and developed regions with aging infrastructure requiring replacement, with geographic concentration in Asian urban corridors transitioning toward efficiency-driven retrofits in European and North American networks. Technology development focuses on enhanced digital monitoring with IoT sensors and analytics, improved ester-fluid insulation reducing fire risk and environmental impact, and integration with distribution automation systems enabling comprehensive grid intelligence. The market could face disruption if alternative distribution voltage levels or solid-state transformer technologies significantly penetrate applications currently served by conventional medium voltage equipment, though the industry's installed base and proven reliability continue to make traditional transformers essential in power distribution infrastructure.
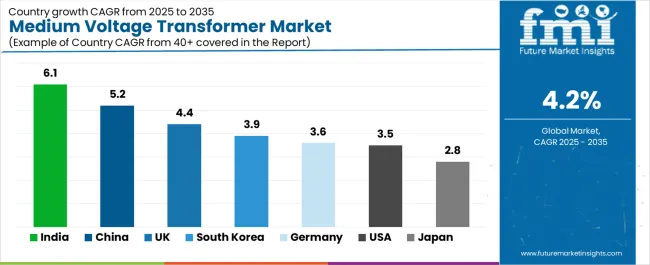
The medium voltage transformer market demonstrates varied regional dynamics with Growth Leaders including India (6.1% CAGR) and China (5.2% CAGR) driving expansion through electrification programs and renewable energy integration. Established Markets encompass the United Kingdom (4.4% CAGR), South Korea (3.9% CAGR), and Germany (3.6% CAGR), benefiting from distribution network upgrades and EV charging infrastructure. Mature Markets feature the United States (3.5% CAGR) and Japan (2.8% CAGR), where grid modernization and aging asset replacement support consistent growth patterns.
| Country | CAGR (2025-2035) |
|---|---|
| India | 6.1% |
| China | 5.2% |
| United Kingdom | 4.4% |
| South Korea | 3.9% |
| Germany | 3.6% |
| United States | 3.5% |
| Japan | 2.8% |
Regional synthesis reveals Asian markets leading adoption through urban electrification and industrial expansion, while North American and European countries maintain steady demand supported by infrastructure replacement and renewable integration requirements. Developed markets show efficiency-driven retrofits and digital monitoring adoption.
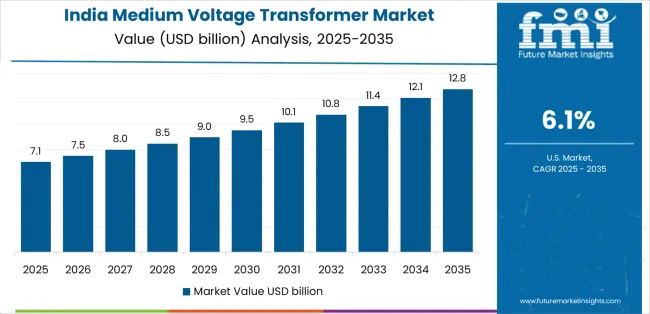
India leads growth momentum with a 6.1% CAGR, driven by rapid urban electrification expansion, renewable independent power producer interconnections, and data center construction boom across major metros including Delhi NCR, Mumbai, Bangalore, Hyderabad, and Chennai. Government programs including Revamped Distribution Sector Scheme and PM-KUSUM solar initiatives drive medium voltage transformer procurement for distribution network strengthening and renewable evacuation infrastructure. Urban electrification addressing remaining gaps and load growth in expanding cities requires substantial distribution capacity additions with standardized transformer deployments. Data center construction supporting digital economy expansion creates dedicated substation requirements with reliable medium voltage equipment for mission-critical power infrastructure.
The convergence of electricity access expansion requiring new distribution assets, renewable energy integration demanding grid interconnection capability, and industrial growth driving on-site substation investment positions India as the highest-growth market for medium voltage transformers. Smart city programs and metro rail construction create additional institutional demand for distribution equipment supporting urban infrastructure development and public transportation electrification.
Performance Metrics:
The Chinese market emphasizes extensive distributed solar and wind integration with documented adoption effectiveness in grid tie-ins and industrial park electrical infrastructure through coordination with renewable energy policy and manufacturing expansion at 5.2% CAGR. The country leverages manufacturing capacity and infrastructure investment to maintain strong market presence across provinces including Jiangsu, Zhejiang, Guangdong, Shandong, and Inner Mongolia. Distributed renewable generation including rooftop solar and industrial park captive wind requires medium voltage step-up transformers for local grid connection and power evacuation. Industrial park development and manufacturing facility expansion drive on-site substation investment with dedicated transformers supporting production loads and process operations.
Government carbon neutrality targets and renewable energy mandates drive grid infrastructure investment supporting distributed generation integration. Economic development zones and export manufacturing hubs require reliable electrical distribution supporting industrial competitiveness and production continuity.
Market Intelligence Brief:
The UK market demonstrates substantial distribution network investment with documented effectiveness in asset replacement, EV charging corridor development, and resilience enhancement through regulated utility capital programs at 4.4% CAGR. British distribution network operators prioritize aging asset replacement with enhanced-efficiency transformers meeting regulatory incentive programs and performance-based rate recovery mechanisms. Electric vehicle charging infrastructure rollout including motorway rapid charging and urban charging hubs requires distribution capacity additions with transformers supporting high-power charging demand. Network resilience programs addressing storm damage and service interruption reduction drive strategic transformer placements and enhanced protection schemes improving supply security.
Regulated utility investment periods including RIIO-ED2 price controls support distribution infrastructure modernization programs. Low-carbon transition requirements including heat pump deployment and building electrification create load growth requiring distribution reinforcement and capacity additions.
Strategic Market Indicators:
South Korea demonstrates advanced adoption at 3.9% CAGR characterized by factory automation electrical loads, semiconductor fabrication facility expansion, and metropolitan subway system substation reinforcement supporting industrial sophistication and urban transit development. The Korean market focuses on manufacturing facility electrification where Industry 4.0 automation, robotics deployment, and clean room operations require reliable medium voltage distribution supporting precision production processes. Semiconductor and display manufacturing capacity expansion creates substantial on-site substation demand with transformers supporting fab operations and process equipment requiring stable power quality. Metropolitan subway network expansion and existing line capacity enhancement require traction substation additions with medium voltage supply transformers feeding rectifier systems.
Government smart factory initiatives and manufacturing competitiveness programs support industrial electrical infrastructure investment. Urban transit development plans including metro extensions and light rail construction create institutional procurement for traction power infrastructure.
Performance Metrics:
Germany maintains steady expansion at 3.6% CAGR through Energy Performance of Buildings Directive implementation, Ecodesign regulation compliance, and industrial facility efficiency retrofits across manufacturing and commercial sectors. German utilities prioritize high-efficiency transformer procurement meeting EU Ecodesign Tier 2 standards reducing no-load losses and improving total cost of ownership through operational savings. Industrial facility modernization including manufacturing plants and process industries drives efficiency upgrades replacing aging transformers with eco-design compliant units reducing energy consumption and carbon footprint. Renewable energy integration including wind farm connections and solar park substations requires grid interconnection transformers supporting distributed generation and transmission system access.
EU regulatory frameworks including Ecodesign Directive 548/2014 mandate efficiency improvements for transformer replacements. Industrial competitiveness initiatives emphasize energy cost reduction through efficient electrical infrastructure and comprehensive energy management.
Market Characteristics:
The USA market emphasizes comprehensive grid modernization with documented effectiveness in aging infrastructure replacement, storm resilience enhancement, and utility capital expenditure cycles through regulated investment programs at 3.5% CAGR. American investor-owned utilities prioritize distribution transformer replacement addressing aging assets exceeding design life with modern equipment improving reliability and incorporating digital monitoring capability. Grid resilience programs following severe weather events drive strategic infrastructure hardening including transformer flood protection, enhanced mounting systems, and backup installations improving service restoration capability. Renewable energy integration including solar interconnection and wind farm evacuation requires distribution and collector system transformers supporting clean energy transition and renewable portfolio standard compliance.
Utility capital spending cycles driven by regulatory rate cases and infrastructure investment plans support sustained equipment procurement. Federal infrastructure programs including grid resilience funding and rural electrification support enhance utility capital availability for distribution modernization.
Strategic Development Indicators:
Japan demonstrates specialized market presence at 2.8% CAGR through systematic aging infrastructure replacement, fire-safe dry-type adoption in dense urban environments, and seismic resilience requirements that emphasize reliability and safety in constrained spaces. The Japanese market focuses on distribution asset renewal where utilities replace transformers installed during post-war electrification and high-growth era expansion reaching end of design life requiring systematic fleet replacement programs. Urban density and fire safety concerns drive dry-type transformer adoption for underground vaults, building substations, and downtown installations eliminating oil-filled equipment fire risk in occupied areas. Earthquake resilience requirements influence transformer mounting, foundation design, and protective systems ensuring continued operation or controlled shutdown during seismic events.
Regulated utility investment frameworks support systematic asset renewal programs. Urban redevelopment projects and building renovations create opportunities for substation modernization and equipment upgrades in metropolitan areas.
Market Development Factors:
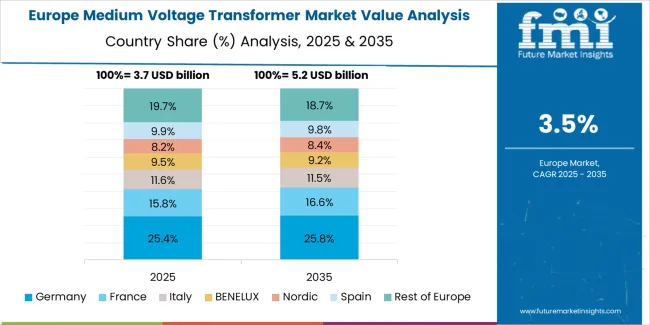
The medium voltage transformer market in Europe is projected to grow from USD 3.5 billion in 2025 to USD 5.2 billion by 2035, registering a CAGR of approximately 4% over the forecast period. Germany leads with a 25.4% market share in 2025, moderating to 25% by 2035, supported by sustained Industry 4.0 manufacturing electrical loads and EPBD-driven efficiency retrofits replacing aging distribution assets with Ecodesign-compliant units.
France holds an 18.7% share in 2025, edging to 19% by 2035, driven by nuclear generation distribution infrastructure, district energy systems, and utility distribution network modernization programs supporting urban electrification and renewable integration. The United Kingdom stands at 17.3% in 2025, trending to 17.1% by 2035, supported by EV charging network deployment, distribution resilience enhancement programs, and regulated utility capital investment cycles. Italy accounts for 14.2% share throughout the period aided by commercial building renovations, industrial facility modernization, and renewable energy project interconnections. Spain holds 11.8% share reflecting commercial real estate development, renewable energy infrastructure, and tourism facility electrical upgrades. Rest of Europe including Nordic and Central & Eastern European countries rises from 12.6% to 13.1% by 2035 as Scandinavian countries accelerate eco-design transformer replacements driven by environmental leadership and efficiency culture, while CEE markets benefit from digital substation rollouts and distribution automation programs modernizing legacy infrastructure.
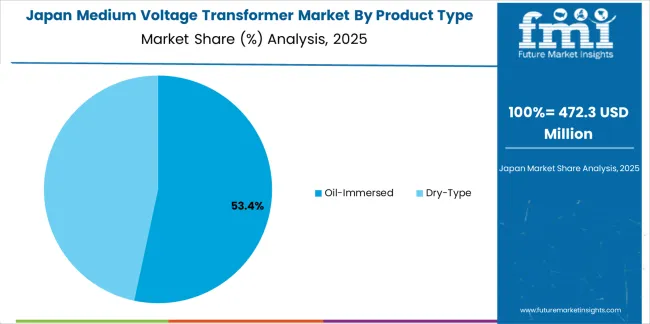
Japan demonstrates advanced market development characterized by systematic aging asset replacement, fire-safe dry-type adoption in dense urban environments, and seismic resilience requirements that emphasize equipment reliability and safety in space-constrained installations. The Japanese market focuses on utility distribution asset renewal where electric power companies replace transformers installed during rapid post-war electrification reaching 40-50 year service age requiring systematic fleet replacement based on condition monitoring and age-based criteria. Equipment procurement emphasizes manufacturing quality, long-term reliability, and comprehensive type testing that align with Japanese utility standards and equipment qualification requirements. The market benefits from domestic manufacturers including Mitsubishi Electric, Toshiba Energy Systems, and Fuji Electric maintaining comprehensive transformer product lines with local engineering support and service networks.
Market Development Factors:
.webp)
South Korea demonstrates sophisticated market characteristics focused on factory automation electrical infrastructure, semiconductor manufacturing capacity expansion, and metropolitan subway traction power systems reflecting industrial sophistication and urban transit development. The Korean market emphasizes manufacturing facility electrification where smart factory initiatives, clean room operations, and automated production lines require reliable medium voltage distribution supporting precision industrial processes. Korean utilities and industrial customers prioritize digital monitoring integration, remote diagnostics capability, and building management system connectivity that reflect technology leadership and comprehensive facility automation expectations. The market benefits from government Industry 4.0 programs, urban transit expansion plans, and manufacturing competitiveness initiatives supporting electrical infrastructure investment.
Strategic Development Indicators:
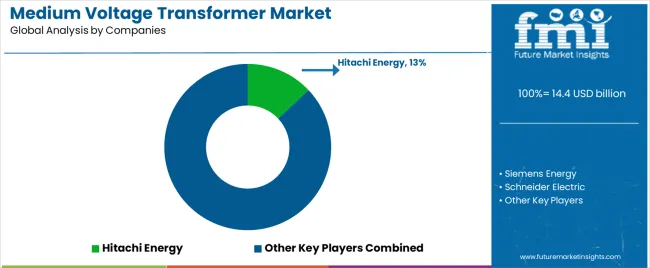
The medium voltage transformer market operates with moderate concentration, featuring approximately 25-35 meaningful participants, where leading companies control roughly 40-45% of global market share through established utility relationships and comprehensive product portfolios. Competition emphasizes technical reliability, global service capabilities, and digital monitoring integration rather than price-based rivalry.
Market Leaders encompass Hitachi Energy, Siemens Energy, and Schneider Electric, collectively commanding approximately 30-35% market share. These companies maintain competitive advantages through extensive power equipment expertise, global manufacturing and service networks, and comprehensive grid solution capabilities that create utility specification preference and support premium pricing. They leverage decades of transformer engineering experience and ongoing digital platform investments to deliver advanced systems with integrated monitoring and smart grid connectivity.
Technology Innovators include GE Vernova (Grid Solutions), Eaton, and Mitsubishi Electric, which compete through focused product development and innovative insulation technologies. These companies differentiate through specialized features including SF₆-free solutions, ester-filled transformers reducing fire risk, and advanced digital analytics appealing to utilities pursuing grid modernization and environmental performance improvement.
Regional Specialists feature companies with specific market focus including CG Power & Industrial Solutions, Fuji Electric, Toshiba Energy Systems, and Bharat Heavy Electricals (BHEL), providing tailored solutions for Asian electrification markets, industrial applications, and utility-specific requirements. Market dynamics favor participants that combine reliable transformer designs with comprehensive service capabilities including condition monitoring, predictive maintenance, and lifecycle asset management features.
| Item | Value |
|---|---|
| Quantitative Units | USD 14.4 billion |
| Product Type | Oil-Immersed, Dry-Type |
| Rating (kVA) | <1,200 kVA, 1,200 kVA, 1,500 kVA, 2,000 kVA, 2,500 kVA, >2,500 kVA |
| Configuration | Three-Phase, Single-Phase |
| End Use | Power Utilities, Industrial, Commercial, Residential & Others |
| Regions Covered | Asia (East Asia + South Asia & Pacific), North America, Europe, Middle East & Africa, Latin America |
| Countries Covered | India, China, United Kingdom, South Korea, Germany, United States, Japan, and 25+ additional countries |
| Key Companies Profiled | Hitachi Energy, Siemens Energy, Schneider Electric, GE Vernova (Grid Solutions), Eaton, Mitsubishi Electric, CG Power & Industrial Solutions, Fuji Electric, Toshiba Energy Systems, Bharat Heavy Electricals (BHEL) |
| Additional Attributes | Dollar sales by product type, rating, configuration, and end use categories, regional adoption trends across Asia, North America, and Europe, competitive landscape with power equipment manufacturers and grid solution suppliers, utility preferences for reliability and digital monitoring, integration with distribution automation platforms and smart grid systems, innovations in ester-filled insulation and eco-design efficiency standards, and development of predictive maintenance solutions with enhanced asset management and grid optimization capabilities. |
The global medium voltage transformer market is estimated to be valued at USD 14.4 billion in 2025.
The market size for the medium voltage transformer market is projected to reach USD 21.7 billion by 2035.
The medium voltage transformer market is expected to grow at a 4.2% CAGR between 2025 and 2035.
The key product types in medium voltage transformer market are oil-immersed and dry-type.
In terms of rating (kva), 1,500 kva segment to command 39.0% share in the medium voltage transformer market in 2025.


Full Research Suite comprises of:
Market outlook & trends analysis
Interviews & case studies
Strategic recommendations
Vendor profiles & capabilities analysis
5-year forecasts
8 regions and 60+ country-level data splits
Market segment data splits
12 months of continuous data updates
DELIVERED AS:
PDF EXCEL ONLINE
Medium Voltage Transformer Industry Analysis in North America Size and Share Forecast Outlook 2025 to 2035
Market Share Insights of Leading Medium Voltage Transformer Providers
Medium Duty Truck Market Size and Share Forecast Outlook 2025 to 2035
Medium-duty Engine Market Size and Share Forecast Outlook 2025 to 2035
Medium Earth Orbit (MEO) Satellite IoT Market Size and Share Forecast Outlook 2025 to 2035
Medium Format Film Cameras Market Size and Share Forecast Outlook 2025 to 2035
Medium Density Fiberboard (MDF) Market Analysis - Size, Share, and Forecast Outlook 2025 to 2035
Medium-Chain Triglycerides Market Growth -Functional Fats & Industry Demand 2025 to 2035
Medium Carbon Steel Market
Medium Voltage Cable and Accessory Market Size and Share Forecast Outlook 2025 to 2035
Medium Voltage AC Power Distribution Units (PDU) Market Size and Share Forecast Outlook 2025 to 2035
Medium Voltage Utility Distribution Panel Market Size and Share Forecast Outlook 2025 to 2035
Medium Voltage Commercial Switchgear Market Size and Share Forecast Outlook 2025 to 2035
Medium Voltage Residential Switchgear Market Size and Share Forecast Outlook 2025 to 2035
Medium Voltage Distribution Panel Market Size and Share Forecast Outlook 2025 to 2035
Medium Voltage Capacitor Bank Market Size and Share Forecast Outlook 2025 to 2035
Medium Voltage Wire and Cable Market Size and Share Forecast Outlook 2025 to 2035
Medium Voltage Digital Substation Market Size and Share Forecast Outlook 2025 to 2035
Medium Voltage Circuit Breaker Market Size and Share Forecast Outlook 2025 to 2035
Medium Voltage Distribution Substation Market Size and Share Forecast Outlook 2025 to 2035

Thank you!
You will receive an email from our Business Development Manager. Please be sure to check your SPAM/JUNK folder too.
Chat With
MaRIA