Medium Voltage Drives Market Size and Share Forecast Outlook 2025 to 2035

The medium voltage drives market is likely to be valued at USD 1.81 billion in 2025 and is projected to reach USD 2.63 billion by 2035, at a CAGR of 3.8% during the forecast period.

Medium voltage drives (MVDs) are crucial for controlling the speed and torque of motors in industrial applications, contributing to improved energy efficiency, reduced operational costs, and enhanced performance. The market is experiencing significant growth due to the increasing demand for energy-efficient systems, the rise in industrial automation, and the growing need for reliable and sustainable power solutions.

A key driver of the market’s growth is the increasing demand for energy efficiency across various industries, including manufacturing, oil and gas, water treatment, and power generation. MVDs offer substantial energy savings by precisely controlling motor speed and adjusting power output, which can significantly reduce electricity consumption.

As industries worldwide seek to minimize energy costs and meet stringent environmental regulations, the adoption of MVDs is becoming more widespread. Additionally, the rising focus on reducing greenhouse gas emissions and promoting sustainability in industrial operations is contributing to the market's expansion.

Recent developments in the medium voltage drives market highlight advancements in digitalization and smart technologies. Manufacturers are integrating advanced features such as IoT connectivity, predictive maintenance, and remote monitoring into MVDs, providing industries with real-time performance data and insights. These innovations are enhancing the efficiency and reliability of medium voltage drives, making them more attractive for businesses looking to optimize their operations and prevent costly downtime.

On November 19, 2024, ABB introduced the ACS8080 medium-voltage air-cooled drive aimed at enhancing industrial performance and reliability-as per ABB’s official PR Newswire release . This next-gen drive delivers up to 98% efficiency, reduces harmonic distortion by approximately 50% with its MP3C motor-control tech, and provides enhanced diagnostics-reportedly delivering 10× faster troubleshooting through advanced condition monitoring.
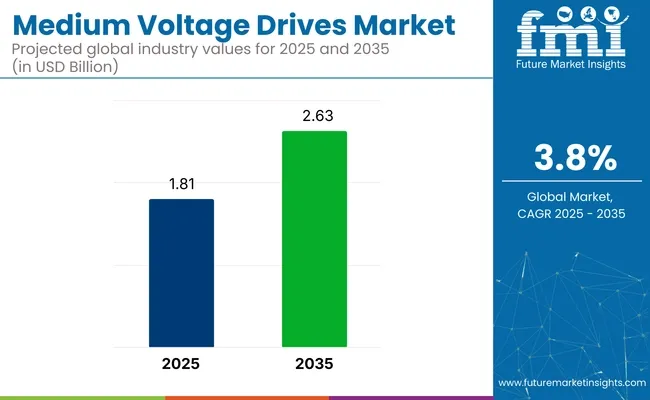
Medium Voltage Drives Market

Attribute Value
Market Size in 2025 USD 1.81 Billion
Market Size in 2035 USD 2.63 Billion
CAGR (2025 to 2035) 3.8%

“We invest in R&D to deliver new solutions that enhance productivity while reducing emissions,” said Chris Poynter, President of ABB’s Systems Drives Division. Built for diverse industrial applications and retrofitting, the ACS8080 reinforces ABB’s leadership in energy-efficient medium-voltage drive systems for the evolving industrial market.

As the market for medium voltage drives continues to grow, ongoing advancements in motor control technologies and energy efficiency solutions are expected to further drive adoption across various sectors. The continued push for automation and sustainability in industrial operations will further accelerate the demand for MVDs, contributing to the market’s long-term expansion.

Analyzing Medium Voltage Drives Market by Top Investment Segments

The global medium voltage drives market is poised for consistent growth from 2025 to 2035, fueled by rising demand for energy efficiency and motor control across heavy industries. In 2025, the 1 MW to 3 MW power range segment is projected to hold 38% market share, while the oil & gas segment is expected to capture 34% of the end user segment. Key players include ABB, Siemens, and Rockwell Automation.
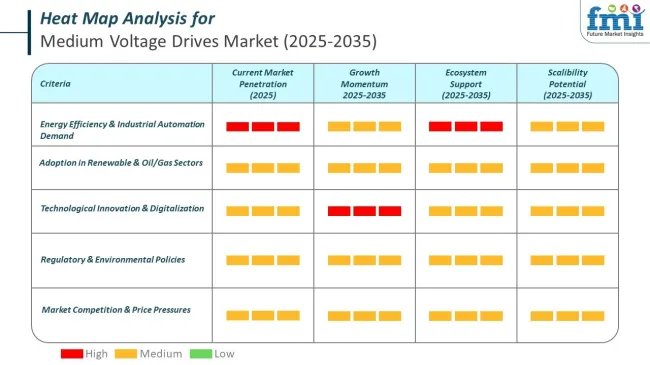
1 MW to 3 MW Drives Segment Powers Industrial Efficiency Gains

The 1 MW to 3 MW drives segment is projected to command 38% of the market share in 2025. This power range is ideal for medium-scale industrial applications where optimizing motor performance, reducing energy consumption, and improving process reliability are critical. Sectors such as mining, cement, and water & wastewater treatment increasingly rely on drives in this range to enhance operational efficiency.
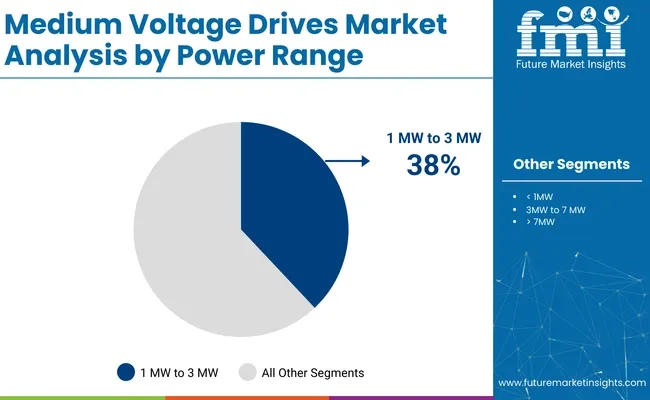
Medium Voltage Drives Market Analysis By Power Range

Leading manufacturers like ABB and Siemens are focusing on modular drive systems that deliver greater flexibility, high torque performance, and seamless integration with industrial automation platforms. Advanced features, such as predictive maintenance and smart monitoring capabilities, are also gaining traction.

Additionally, tightening global energy efficiency regulations are prompting industries to adopt medium voltage drives to meet sustainability targets and reduce operational costs. The segment is also benefitting from trends in digitalization and Industry 4.0, where intelligent drive solutions contribute to smarter, more adaptive industrial ecosystems. This dynamic landscape ensures robust growth prospects for the 1 MW to 3 MW segment.

Oil & Gas Sector Drives Demand with Focus on Operational Reliability

The oil & gas segment is projected to hold 34% of the end user segment market share in 2025. Medium voltage drives play a vital role in upstream, midstream, and downstream oil & gas operations, where reliable control of pumps, compressors, and drilling equipment is paramount. The sector’s focus on improving operational efficiency, reducing energy consumption, and ensuring equipment longevity is a key growth driver.
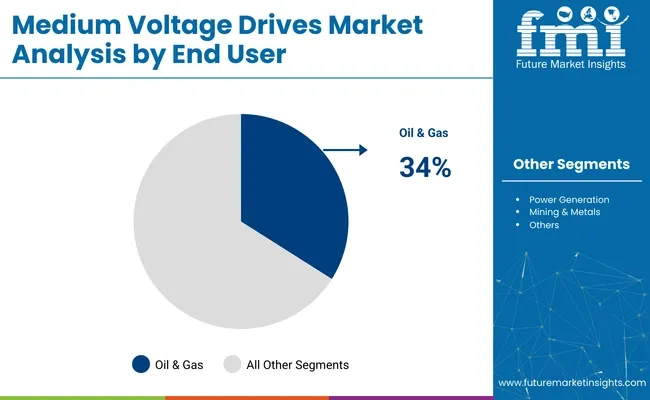
Medium Voltage Drives Market By End User

Major players such as Rockwell Automation and Schneider Electric are providing advanced drive solutions tailored for harsh and hazardous oilfield environments. Recent innovations include explosion-proof enclosures, enhanced motor control algorithms, and remote monitoring capabilities to ensure uninterrupted performance.

The shift towards automation and digital oilfield concepts is further accelerating demand for intelligent drive systems. Additionally, as oil & gas companies prioritize sustainability and seek to lower their carbon footprint, medium voltage drives offer an effective means to optimize energy use. With continued investment in exploration and production activities globally, the oil & gas segment will remain a key growth engine for the medium voltage drives market.

Are Current Technologies Sufficient to Drive the Medium Voltage Drives Industry Forward?

Obligations to control energy consumption by reducing the demand for electricity supply in electrical motors are optimized by the use of appropriate voltage-regulating drives.

Existing technologies across all levels of enterprises undergoing the necessary refurbishment and replacement. They are poised to obtain new upgraded versions of medium voltage variable frequency drives that are projected to obtain higher revenues in the market.

In recent times, there has been a growing requirement for introducing full-time monitoring control of various processing units. Due to a shortage of labor, particularly in developed economies, industries are resorting to the utilization of medium-voltage drives as well as high-voltage drives.

Breakthrough Technologies Fueling Demand in the Medium Voltage Drives Industry

  • The medium voltage drives have been in use for a very long time, but it has remained mostly limited to large industrial sectors with higher capital investments.
  • Medium voltage VFD motors require skilled personnel for operation due to maintenance and safety reasons. The development of medium voltage drives with more user-friendly controls is the key game-changer for medium voltage drive adoption.
  • In the aftermath of the successful demonstration of high-end digital technologies, such as machine learning (ML) and artificial intelligence (AI), a number of new players are emerging in the electronics and industrial sector.
  • The growing competition has led to a significant drop in the prices of important electrical devices. Previously renowned players in the market had to take care of medium voltage drive prices. For them to remain competitive in a world that is changing quickly, they should strive for quick adoption of new technology.

Analysis of Top Region, Producing, Using, and Distributing Medium Voltage Drives

Key Players in North America Make the Global Industry Astonishing

North America is the dominant region in the manufacturing and production of medium voltage. With the presence of several top brands of medium voltage drives in the region, some brand names have become synonymous with the product. Siemens mv drives, weg medium voltage drives, and ABB medium voltage VFD are some common names mistakenly used instead of medium voltage drives.
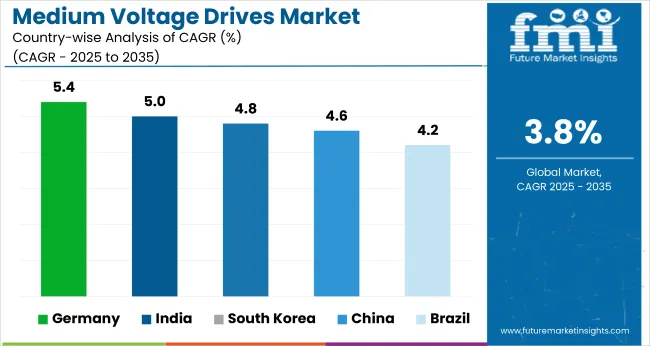
  • The United States is leading with a market share of 21.6% in 2025. This is owing to the surging development of energy-efficient infrastructure.
  • The advancement of motor control technology allowed manufacturers to increase their revenue sources in the United States.

Technological Progress: Key Growth Factor for Asia Pacific Region

Country CAGR (2025 to 2035)
China 4.6%
Country CAGR (2025 to 2035)
India 5.0%

Medium voltage drive manufacturers with lower labor costs are setting up factories in the Asia Pacific region. This is done to lessen their need for cross-border transportation for raw materials.

Due to its quick economic expansion and governmental prohibitions on excessive energy use, Japan is likely to increase adequately, with a market share of 6% in 2025. Moreover, the presence of key manufacturers in these regions, particularly China and India, is likely to provide a conducive environment for the rapid adoption of MV drives in industries.

Medium voltage drives are now widely used across many industries due to rapid technological advancements. High reliability and cost-effective energy reduction are the main goals of progress.

Regulatory Shifts Creating Growth Opportunities for the Medium Voltage Drives Industry

Europe is also a prominent region, having huge growth potential for the medium voltage drives sector being present for a very long time.

  • Obligations of European countries to strictly adhere to the environmental norms set by the government are expected to increase the focus on energy consumption methods. This sheer turnaround in the consumption trend is projected to expand the European market to new heights.
  • The medium voltage drives in the German market are anticipated to drastically change as a result of rising energy consumption, a key factor affecting the industrial environment of the nation. Germany is predicted to grow at a share of 5.4% in 2025 as a result.
  • The industry is being driven forward by high power consumption, the energy sector's resurrection of the CAPEX cycle, and the robust growth of process industries like wastewater, steel, water, and cement.

Strategic Expansion Opportunities for Manufacturers in the Medium Voltage Drives Industry

Medium voltage drives manufacturers to focus on providing an easy way to program the interface. For instance, medium voltage AC drives with touch screen Human Machine Interfaces are being developed by manufacturers in a bid to give operators a simple way to interface with the drives, access the settings, and program them.

Due to the fact that medium voltage AC drives enable consistent torque over a broad speed range and significant torque increments, manufacturers in this industry are using value-grab opportunities for these applications.

Manufacturers in the medium voltage AC drive market are making systems that accurately manage the rolling mill operations in the metals industry more broadly accessible.

Leading Suppliers, Distributors, and Manufacturers of Medium Voltage Drives Industry

The use of high-power speed drives recently developed by technological advancements requires provisions for the accurate supply of voltage and current specifications. Medium voltage VFD manufacturers are increasingly targeting this necessity to escalate product deployment.

To remain competitive, medium voltage drive manufacturers are producing drives according to the requirements of several industries. By creating medium voltage VFD specs that reflect consumer preferences, this change in business approach is anticipated to aid manufacturers in attracting new customers.

For instance: Fuji Electric is a key player in the Asia Pacific region that produces competitive medium voltage drives in the range starting from 0.1 kW and going up to 2400 kW as required by different applications in modern industries.

Recent Development:

  • In December 2021, Mitsubishi Electric Company announced that it has won the 2021 Research and Development 100 award from the United States Publication Research and Development World for its low-voltage air circuit breaker device. This device can safeguard low-voltage power distribution systems in factories and commercial buildings.
  • In March 2021, Rockwell Automation enhanced the operational capacity of the Power Flex 6000T Medium Voltage Drives. A number of improvements to the Allen-Bradley Power Flex 6000T medium voltage drives are now available to industrial businesses. The company's Total FORCE technology, which provides accurate speed and torque management, and automatic modifications to keep processes operating smoothly, is now incorporated into the drives.

Major Manufacturers and Key Players in the Medium Voltage Drives Industry

  • Johnson Controls
  • ABB
  • Schneider Electric
  • Eaton
  • Fuji Electric Co., Ltd.
  • Rockwell Automation, Inc.
  • WEG
  • Yaskawa Electric Corporation
  • Nidec Corporation

Report Scope Table - Medium Voltage Drives Market

Report Attributes Details
Current Total Market Size (2025) USD 1.81 billion
Projected Market Size (2035) USD 2.63 billion
CAGR (2025 to 2035) 3.8%
Base Year for Estimation 2024
Historical Period 2020 to 2024
Projections Period 2025 to 2035
Quantitative Units USD billion for dollar sales
Power Range Analyzed (Segment 1) < 1MW, 1MW to 3 MW, 3MW to 7 MW, > 7MW
End-users Analyzed (Segment 2) Oil & Gas, Power Generation, Mining & Metals, Pulp & Paper, Marine, Others
Drive Types Analyzed (Segment 3) AC, DC, Servo
Applications Analyzed (Segment 4) Pump, Fan, Conveyor, Compressor, Extruder, Others
Regions Covered North America, Latin America, Europe, Asia Pacific, Middle East and Africa (MEA)
Key Players influencing the Medium Voltage Drives Market ABB, Schneider Electric, Hitachi, Ltd., Rockwell Automation, Inc., Nidec Industrial Solutions, Toshiba Mitsubishi-Electric Industrial Systems Corporation, Honeywell International Inc., Siemens, Fuji Electric Co., Ltd., Spartan Controls, Amtech, Danfoss
Additional Attributes dollar sales, CAGR trends, power range segmentation, end-user distribution, drive type demand, application growth, competitor dollar sales & market share, regional trends

High-Performing Investment Areas in the Medium Voltage Drives Market

By Power Range:

  • < 1MW
  • 1MW to 3 MW
  • 3MW to 7 MW
  • > 7MW

By End User:

  • Oil & Gas
  • Power Generation
  • Mining & Metals
  • Pulp & Paper
  • Marine
  • Others

By Drive:

  • AC
  • DC
  • Servo

By Application:

  • Pump
  • Fan
  • Conveyor
  • Compressor
  • Extruder
  • Others

By Region:

  • North America
  • Latin America
  • Europe
  • Asia Pacific
  • Middle East and Africa (MEA)

Table of Content

  • 1. Executive Summary | Medium Voltage Drives Market
  • 2. Market Overview
  • 3. Market Background
  • 4. Global Market Analysis 2020 to 2024 and Forecast, 2025 to 2035
  • 5. Global Market Analysis 2020 to 2024 and Forecast 2025 to 2035, By Power Range
    • 5.1. < 1MW
    • 5.2. 1MW - 3 MW
    • 5.3. 3MW - 7 MW
    • 5.4. > 7MW
  • 6. Global Market Analysis 2020 to 2024 and Forecast 2025 to 2035, By End User
    • 6.1. Oil & Gas
    • 6.2. Power Generation
    • 6.3. Mining & Metals
    • 6.4. Pulp & Paper
    • 6.5. Marine
    • 6.6. Others
  • 7. Global Market Analysis 2020 to 2024 and Forecast 2025 to 2035, By Drive
    • 7.1. AC
    • 7.2. DC
    • 7.3. Servo
  • 8. Global Market Analysis 2020 to 2024 and Forecast 2025 to 2035, By Region
    • 8.1. North America
    • 8.2. Latin America
    • 8.3. Europe
    • 8.4. Asia Pacific
    • 8.5. Middle East and Africa (MEA)
  • 9. North America Market Analysis 2020 to 2024 and Forecast 2025 to 2035, By Country
  • 10. Latin America Market Analysis 2020 to 2024 and Forecast 2025 to 2035, By Country
  • 11. Europe Market Analysis 2020 to 2024 and Forecast 2025 to 2035, By Country
  • 12. Asia Pacific Market Analysis 2020 to 2024 and Forecast 2025 to 2035, By Country
  • 13. MEA Market Analysis 2020 to 2024 and Forecast 2025 to 2035, By Country
  • 14. Key Countries Market Analysis
  • 15. Market Structure Analysis
  • 16. Competition Analysis
    • 16.1. ABB
    • 16.2. Schneider Electric
    • 16.3. Hitachi, Ltd.
    • 16.4. Rockwell Automation, Inc.
    • 16.5. Nidec Industrial Solutions
    • 16.6. Toshiba Mitsubishi-Electric Industrial Systems Corporation
    • 16.7. Honeywell International Inc.
    • 16.8. Siemens
    • 16.9. Fuji Electric Co., Ltd.
    • 16.10. Spartan Controls
    • 16.11. Amtech
    • 16.12. Danfoss
  • 17. Assumptions & Acronyms Used
  • 18. Research Methodology

List of Tables

  • Table 1: Global Market Value (USD Million) Forecast by Region, 2020 to 2035
  • Table 2: Global Market Volume (Units) Forecast by Region, 2020 to 2035
  • Table 3: Global Market Value (USD Million) Forecast by Power Range, 2020 to 2035
  • Table 4: Global Market Volume (Units) Forecast by Power Range, 2020 to 2035
  • Table 5: Global Market Value (USD Million) Forecast by End User, 2020 to 2035
  • Table 6: Global Market Volume (Units) Forecast by End User, 2020 to 2035
  • Table 7: Global Market Value (USD Million) Forecast by Drive, 2020 to 2035
  • Table 8: Global Market Volume (Units) Forecast by Drive, 2020 to 2035
  • Table 9: North America Market Value (USD Million) Forecast by Country, 2020 to 2035
  • Table 10: North America Market Volume (Units) Forecast by Country, 2020 to 2035
  • Table 11: North America Market Value (USD Million) Forecast by Power Range, 2020 to 2035
  • Table 12: North America Market Volume (Units) Forecast by Power Range, 2020 to 2035
  • Table 13: North America Market Value (USD Million) Forecast by End User, 2020 to 2035
  • Table 14: North America Market Volume (Units) Forecast by End User, 2020 to 2035
  • Table 15: North America Market Value (USD Million) Forecast by Drive, 2020 to 2035
  • Table 16: North America Market Volume (Units) Forecast by Drive, 2020 to 2035
  • Table 17: Latin America Market Value (USD Million) Forecast by Country, 2020 to 2035
  • Table 18: Latin America Market Volume (Units) Forecast by Country, 2020 to 2035
  • Table 19: Latin America Market Value (USD Million) Forecast by Power Range, 2020 to 2035
  • Table 20: Latin America Market Volume (Units) Forecast by Power Range, 2020 to 2035
  • Table 21: Latin America Market Value (USD Million) Forecast by End User, 2020 to 2035
  • Table 22: Latin America Market Volume (Units) Forecast by End User, 2020 to 2035
  • Table 23: Latin America Market Value (USD Million) Forecast by Drive, 2020 to 2035
  • Table 24: Latin America Market Volume (Units) Forecast by Drive, 2020 to 2035
  • Table 25: Europe Market Value (USD Million) Forecast by Country, 2020 to 2035
  • Table 26: Europe Market Volume (Units) Forecast by Country, 2020 to 2035
  • Table 27: Europe Market Value (USD Million) Forecast by Power Range, 2020 to 2035
  • Table 28: Europe Market Volume (Units) Forecast by Power Range, 2020 to 2035
  • Table 29: Europe Market Value (USD Million) Forecast by End User, 2020 to 2035
  • Table 30: Europe Market Volume (Units) Forecast by End User, 2020 to 2035
  • Table 31: Europe Market Value (USD Million) Forecast by Drive, 2020 to 2035
  • Table 32: Europe Market Volume (Units) Forecast by Drive, 2020 to 2035
  • Table 33: Asia Pacific Market Value (USD Million) Forecast by Country, 2020 to 2035
  • Table 34: Asia Pacific Market Volume (Units) Forecast by Country, 2020 to 2035
  • Table 35: Asia Pacific Market Value (USD Million) Forecast by Power Range, 2020 to 2035
  • Table 36: Asia Pacific Market Volume (Units) Forecast by Power Range, 2020 to 2035
  • Table 37: Asia Pacific Market Value (USD Million) Forecast by End User, 2020 to 2035
  • Table 38: Asia Pacific Market Volume (Units) Forecast by End User, 2020 to 2035
  • Table 39: Asia Pacific Market Value (USD Million) Forecast by Drive, 2020 to 2035
  • Table 40: Asia Pacific Market Volume (Units) Forecast by Drive, 2020 to 2035
  • Table 41: MEA Market Value (USD Million) Forecast by Country, 2020 to 2035
  • Table 42: MEA Market Volume (Units) Forecast by Country, 2020 to 2035
  • Table 43: MEA Market Value (USD Million) Forecast by Power Range, 2020 to 2035
  • Table 44: MEA Market Volume (Units) Forecast by Power Range, 2020 to 2035
  • Table 45: MEA Market Value (USD Million) Forecast by End User, 2020 to 2035
  • Table 46: MEA Market Volume (Units) Forecast by End User, 2020 to 2035
  • Table 47: MEA Market Value (USD Million) Forecast by Drive, 2020 to 2035
  • Table 48: MEA Market Volume (Units) Forecast by Drive, 2020 to 2035

List of Figures

  • Figure 1: Global Market Value (USD Million) by Power Range, 2025 to 2035
  • Figure 2: Global Market Value (USD Million) by End User, 2025 to 2035
  • Figure 3: Global Market Value (USD Million) by Drive, 2025 to 2035
  • Figure 4: Global Market Value (USD Million) by Region, 2025 to 2035
  • Figure 5: Global Market Value (USD Million) Analysis by Region, 2020 to 2035
  • Figure 6: Global Market Volume (Units) Analysis by Region, 2020 to 2035
  • Figure 7: Global Market Value Share (%) and BPS Analysis by Region, 2025 to 2035
  • Figure 8: Global Market Y-o-Y Growth (%) Projections by Region, 2025 to 2035
  • Figure 9: Global Market Value (USD Million) Analysis by Power Range, 2020 to 2035
  • Figure 10: Global Market Volume (Units) Analysis by Power Range, 2020 to 2035
  • Figure 11: Global Market Value Share (%) and BPS Analysis by Power Range, 2025 to 2035
  • Figure 12: Global Market Y-o-Y Growth (%) Projections by Power Range, 2025 to 2035
  • Figure 13: Global Market Value (USD Million) Analysis by End User, 2020 to 2035
  • Figure 14: Global Market Volume (Units) Analysis by End User, 2020 to 2035
  • Figure 15: Global Market Value Share (%) and BPS Analysis by End User, 2025 to 2035
  • Figure 16: Global Market Y-o-Y Growth (%) Projections by End User, 2025 to 2035
  • Figure 17: Global Market Value (USD Million) Analysis by Drive, 2020 to 2035
  • Figure 18: Global Market Volume (Units) Analysis by Drive, 2020 to 2035
  • Figure 19: Global Market Value Share (%) and BPS Analysis by Drive, 2025 to 2035
  • Figure 20: Global Market Y-o-Y Growth (%) Projections by Drive, 2025 to 2035
  • Figure 21: Global Market Attractiveness by Power Range, 2025 to 2035
  • Figure 22: Global Market Attractiveness by End User, 2025 to 2035
  • Figure 23: Global Market Attractiveness by Drive, 2025 to 2035
  • Figure 24: Global Market Attractiveness by Region, 2025 to 2035
  • Figure 25: North America Market Value (USD Million) by Power Range, 2025 to 2035
  • Figure 26: North America Market Value (USD Million) by End User, 2025 to 2035
  • Figure 27: North America Market Value (USD Million) by Drive, 2025 to 2035
  • Figure 28: North America Market Value (USD Million) by Country, 2025 to 2035
  • Figure 29: North America Market Value (USD Million) Analysis by Country, 2020 to 2035
  • Figure 30: North America Market Volume (Units) Analysis by Country, 2020 to 2035
  • Figure 31: North America Market Value Share (%) and BPS Analysis by Country, 2025 to 2035
  • Figure 32: North America Market Y-o-Y Growth (%) Projections by Country, 2025 to 2035
  • Figure 33: North America Market Value (USD Million) Analysis by Power Range, 2020 to 2035
  • Figure 34: North America Market Volume (Units) Analysis by Power Range, 2020 to 2035
  • Figure 35: North America Market Value Share (%) and BPS Analysis by Power Range, 2025 to 2035
  • Figure 36: North America Market Y-o-Y Growth (%) Projections by Power Range, 2025 to 2035
  • Figure 37: North America Market Value (USD Million) Analysis by End User, 2020 to 2035
  • Figure 38: North America Market Volume (Units) Analysis by End User, 2020 to 2035
  • Figure 39: North America Market Value Share (%) and BPS Analysis by End User, 2025 to 2035
  • Figure 40: North America Market Y-o-Y Growth (%) Projections by End User, 2025 to 2035
  • Figure 41: North America Market Value (USD Million) Analysis by Drive, 2020 to 2035
  • Figure 42: North America Market Volume (Units) Analysis by Drive, 2020 to 2035
  • Figure 43: North America Market Value Share (%) and BPS Analysis by Drive, 2025 to 2035
  • Figure 44: North America Market Y-o-Y Growth (%) Projections by Drive, 2025 to 2035
  • Figure 45: North America Market Attractiveness by Power Range, 2025 to 2035
  • Figure 46: North America Market Attractiveness by End User, 2025 to 2035
  • Figure 47: North America Market Attractiveness by Drive, 2025 to 2035
  • Figure 48: North America Market Attractiveness by Country, 2025 to 2035
  • Figure 49: Latin America Market Value (USD Million) by Power Range, 2025 to 2035
  • Figure 50: Latin America Market Value (USD Million) by End User, 2025 to 2035
  • Figure 51: Latin America Market Value (USD Million) by Drive, 2025 to 2035
  • Figure 52: Latin America Market Value (USD Million) by Country, 2025 to 2035
  • Figure 53: Latin America Market Value (USD Million) Analysis by Country, 2020 to 2035
  • Figure 54: Latin America Market Volume (Units) Analysis by Country, 2020 to 2035
  • Figure 55: Latin America Market Value Share (%) and BPS Analysis by Country, 2025 to 2035
  • Figure 56: Latin America Market Y-o-Y Growth (%) Projections by Country, 2025 to 2035
  • Figure 57: Latin America Market Value (USD Million) Analysis by Power Range, 2020 to 2035
  • Figure 58: Latin America Market Volume (Units) Analysis by Power Range, 2020 to 2035
  • Figure 59: Latin America Market Value Share (%) and BPS Analysis by Power Range, 2025 to 2035
  • Figure 60: Latin America Market Y-o-Y Growth (%) Projections by Power Range, 2025 to 2035
  • Figure 61: Latin America Market Value (USD Million) Analysis by End User, 2020 to 2035
  • Figure 62: Latin America Market Volume (Units) Analysis by End User, 2020 to 2035
  • Figure 63: Latin America Market Value Share (%) and BPS Analysis by End User, 2025 to 2035
  • Figure 64: Latin America Market Y-o-Y Growth (%) Projections by End User, 2025 to 2035
  • Figure 65: Latin America Market Value (USD Million) Analysis by Drive, 2020 to 2035
  • Figure 66: Latin America Market Volume (Units) Analysis by Drive, 2020 to 2035
  • Figure 67: Latin America Market Value Share (%) and BPS Analysis by Drive, 2025 to 2035
  • Figure 68: Latin America Market Y-o-Y Growth (%) Projections by Drive, 2025 to 2035
  • Figure 69: Latin America Market Attractiveness by Power Range, 2025 to 2035
  • Figure 70: Latin America Market Attractiveness by End User, 2025 to 2035
  • Figure 71: Latin America Market Attractiveness by Drive, 2025 to 2035
  • Figure 72: Latin America Market Attractiveness by Country, 2025 to 2035
  • Figure 73: Europe Market Value (USD Million) by Power Range, 2025 to 2035
  • Figure 74: Europe Market Value (USD Million) by End User, 2025 to 2035
  • Figure 75: Europe Market Value (USD Million) by Drive, 2025 to 2035
  • Figure 76: Europe Market Value (USD Million) by Country, 2025 to 2035
  • Figure 77: Europe Market Value (USD Million) Analysis by Country, 2020 to 2035
  • Figure 78: Europe Market Volume (Units) Analysis by Country, 2020 to 2035
  • Figure 79: Europe Market Value Share (%) and BPS Analysis by Country, 2025 to 2035
  • Figure 80: Europe Market Y-o-Y Growth (%) Projections by Country, 2025 to 2035
  • Figure 81: Europe Market Value (USD Million) Analysis by Power Range, 2020 to 2035
  • Figure 82: Europe Market Volume (Units) Analysis by Power Range, 2020 to 2035
  • Figure 83: Europe Market Value Share (%) and BPS Analysis by Power Range, 2025 to 2035
  • Figure 84: Europe Market Y-o-Y Growth (%) Projections by Power Range, 2025 to 2035
  • Figure 85: Europe Market Value (USD Million) Analysis by End User, 2020 to 2035
  • Figure 86: Europe Market Volume (Units) Analysis by End User, 2020 to 2035
  • Figure 87: Europe Market Value Share (%) and BPS Analysis by End User, 2025 to 2035
  • Figure 88: Europe Market Y-o-Y Growth (%) Projections by End User, 2025 to 2035
  • Figure 89: Europe Market Value (USD Million) Analysis by Drive, 2020 to 2035
  • Figure 90: Europe Market Volume (Units) Analysis by Drive, 2020 to 2035
  • Figure 91: Europe Market Value Share (%) and BPS Analysis by Drive, 2025 to 2035
  • Figure 92: Europe Market Y-o-Y Growth (%) Projections by Drive, 2025 to 2035
  • Figure 93: Europe Market Attractiveness by Power Range, 2025 to 2035
  • Figure 94: Europe Market Attractiveness by End User, 2025 to 2035
  • Figure 95: Europe Market Attractiveness by Drive, 2025 to 2035
  • Figure 96: Europe Market Attractiveness by Country, 2025 to 2035
  • Figure 97: Asia Pacific Market Value (USD Million) by Power Range, 2025 to 2035
  • Figure 98: Asia Pacific Market Value (USD Million) by End User, 2025 to 2035
  • Figure 99: Asia Pacific Market Value (USD Million) by Drive, 2025 to 2035
  • Figure 100: Asia Pacific Market Value (USD Million) by Country, 2025 to 2035
  • Figure 101: Asia Pacific Market Value (USD Million) Analysis by Country, 2020 to 2035
  • Figure 102: Asia Pacific Market Volume (Units) Analysis by Country, 2020 to 2035
  • Figure 103: Asia Pacific Market Value Share (%) and BPS Analysis by Country, 2025 to 2035
  • Figure 104: Asia Pacific Market Y-o-Y Growth (%) Projections by Country, 2025 to 2035
  • Figure 105: Asia Pacific Market Value (USD Million) Analysis by Power Range, 2020 to 2035
  • Figure 106: Asia Pacific Market Volume (Units) Analysis by Power Range, 2020 to 2035
  • Figure 107: Asia Pacific Market Value Share (%) and BPS Analysis by Power Range, 2025 to 2035
  • Figure 108: Asia Pacific Market Y-o-Y Growth (%) Projections by Power Range, 2025 to 2035
  • Figure 109: Asia Pacific Market Value (USD Million) Analysis by End User, 2020 to 2035
  • Figure 110: Asia Pacific Market Volume (Units) Analysis by End User, 2020 to 2035
  • Figure 111: Asia Pacific Market Value Share (%) and BPS Analysis by End User, 2025 to 2035
  • Figure 112: Asia Pacific Market Y-o-Y Growth (%) Projections by End User, 2025 to 2035
  • Figure 113: Asia Pacific Market Value (USD Million) Analysis by Drive, 2020 to 2035
  • Figure 114: Asia Pacific Market Volume (Units) Analysis by Drive, 2020 to 2035
  • Figure 115: Asia Pacific Market Value Share (%) and BPS Analysis by Drive, 2025 to 2035
  • Figure 116: Asia Pacific Market Y-o-Y Growth (%) Projections by Drive, 2025 to 2035
  • Figure 117: Asia Pacific Market Attractiveness by Power Range, 2025 to 2035
  • Figure 118: Asia Pacific Market Attractiveness by End User, 2025 to 2035
  • Figure 119: Asia Pacific Market Attractiveness by Drive, 2025 to 2035
  • Figure 120: Asia Pacific Market Attractiveness by Country, 2025 to 2035
  • Figure 121: MEA Market Value (USD Million) by Power Range, 2025 to 2035
  • Figure 122: MEA Market Value (USD Million) by End User, 2025 to 2035
  • Figure 123: MEA Market Value (USD Million) by Drive, 2025 to 2035
  • Figure 124: MEA Market Value (USD Million) by Country, 2025 to 2035
  • Figure 125: MEA Market Value (USD Million) Analysis by Country, 2020 to 2035
  • Figure 126: MEA Market Volume (Units) Analysis by Country, 2020 to 2035
  • Figure 127: MEA Market Value Share (%) and BPS Analysis by Country, 2025 to 2035
  • Figure 128: MEA Market Y-o-Y Growth (%) Projections by Country, 2025 to 2035
  • Figure 129: MEA Market Value (USD Million) Analysis by Power Range, 2020 to 2035
  • Figure 130: MEA Market Volume (Units) Analysis by Power Range, 2020 to 2035
  • Figure 131: MEA Market Value Share (%) and BPS Analysis by Power Range, 2025 to 2035
  • Figure 132: MEA Market Y-o-Y Growth (%) Projections by Power Range, 2025 to 2035
  • Figure 133: MEA Market Value (USD Million) Analysis by End User, 2020 to 2035
  • Figure 134: MEA Market Volume (Units) Analysis by End User, 2020 to 2035
  • Figure 135: MEA Market Value Share (%) and BPS Analysis by End User, 2025 to 2035
  • Figure 136: MEA Market Y-o-Y Growth (%) Projections by End User, 2025 to 2035
  • Figure 137: MEA Market Value (USD Million) Analysis by Drive, 2020 to 2035
  • Figure 138: MEA Market Volume (Units) Analysis by Drive, 2020 to 2035
  • Figure 139: MEA Market Value Share (%) and BPS Analysis by Drive, 2025 to 2035
  • Figure 140: MEA Market Y-o-Y Growth (%) Projections by Drive, 2025 to 2035
  • Figure 141: MEA Market Attractiveness by Power Range, 2025 to 2035
  • Figure 142: MEA Market Attractiveness by End User, 2025 to 2035
  • Figure 143: MEA Market Attractiveness by Drive, 2025 to 2035
  • Figure 144: MEA Market Attractiveness by Country, 2025 to 2035

Frequently Asked Questions

How Big is the Market Going to be by 2035?

The market is valued to hit USD 1.81 Billion by 2035.

What is the Growth Forecast for the Market?

The market is forecast to register a CAGR of 3.8% through 2035.

What is the Current Market Valuation?

The market is estimated to secure a valuation of USD 2.63 Billion in 2035.

How was the Historical Performance of The Market?

During 2025 to 2035, the market grew at a CAGR of 3.8%.

How Enormous Is the Opportunity in the United States?

In 2025, the United States to possess a market share of 21.6%.

Which Power Range Category Has a Significant Impact on the Global Market?

With a CAGR of 38% in 2025, 1 MW to 3MW to take the lead in the market.

Which End User Segment to Lead in the Market?

The oil and gas segment to command 34% of the market share in 2025.

Explore Similar Insights

Future Market Insights

Medium Voltage Drives Market