Low Voltage Motor Market Outlook 2025 to 2035

The Low Voltage Motor Market is expected to flourish due to heightened industrial automation, rising utilization of energy-efficient electric motors, and increasing manufacturing infrastructure worldwide. Low voltage motors usually below 1,000 volts are necessary for different applications including HVAC, pumps, compressors, conveyors and machine tools. So, as industries modernize and pursue greater productivity, less downtime, and lower energy costs, the uptake of high-efficiency motor systems is on the rise.

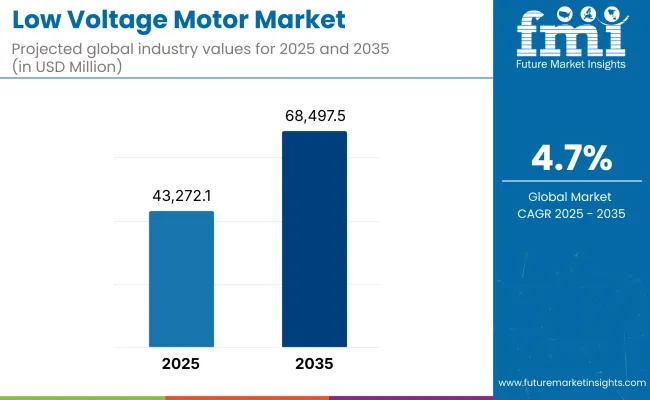
The market was valued at USD 43,272.1 Million which is expected to reach USD 68,497.5 Million by 2035, at a CAGR 4.7% over the forecast period. This growth is supported by regulatory regulations to promote energy conservation, an increase in investments in smart factory automation, and the transition to Industry 4.0.
Growing emphasis on reducing carbon footprint, combined with advances in motor design, IoT-based monitoring, and integration with digital control systems, is further boosting the adoption across developed and emerging economies. In addition, the rising demand for low maintenance and durable motors for mission-critical operations is driving demand in industrial as well as commercial sector.

Market Metrics

Metric Value
Market Size (2025E) USD 43,272.1 Million
Market Value (2035F) USD 68,497.5 Million
CAGR (2025 to 2035) 4.7%

Regional Market Trends

North America

North America continues to be a prime market as a result ofhigh levels of industrial automation, increasing use of energy efficient technologies and government driven energy saving programs. The United States leads market growth by implementing advanced manufacturing infrastructure and enforcing the value of technology through regulatory efforts, such as the USA Department of Energy’s Motor Challenge. Furthermore, the use of low voltage motors in HVAC applications, oil & gas operations, and commercial buildings also helps to drive the demand in the region.

Europe

In Europe, the low voltage motor market is driven by stringent energy efficiency standards like the European Union’s Ecodesign Directive. Germany, France and Italy are among those at the forefront of industrial automation and green manufacturing. Increasing Demand of IE3 and IE4 Efficiency Class Motors Along With Retrofitting of Incoming Equipment Segments is Boosting the Growth of Market.

The region is also emphasizing sustainability, which is promoting electric motor solutions across water treatment, automotive and renewable energy.

Asia-Pacific

The Asia-Pacific is the fastest-growing region owing to rapid industrialization and infrastructure development, along with rising demand for automation in nations such as China, India, and South Korea. Most of this growth comes from China (the biggest contributor), fuelled by local industrial motor production and great investments on smart factories and process automation.

Make in India movement and a greater manufacturing base in the country are also driving motor adoption in India. Increasing energy demand and electricity prices are pushing businesses throughout the region to invest in energy-efficient motor technologies.

Challenges and Opportunities

Challenge

Cost Sensitivity and Complexity of Upgrading Legacy Systems

Premium-efficiency motors are more expensive upfront, which makes them a harder sell to SMEs, one of the biggest barriers to uptake in the market. Further, adapting contemporary low voltage motors for legacy systems often necessitates complex retrofitting, leading to higher operational complexity and interruptions. In particular, lack of awareness on long-term energy and cost savings also hinders the adoption, especially in developing parts of the world.

Opportunity

Integration with Digital Platforms and Industrial IoT

As smart manufacturing begins to take hold, opportunities to integrate low voltage motors with IIoT and AI-based monitoring systems are increasing. It lends itself to real-time diagnostics, predictive maintenance, and remote operation, leading to greater productivity and energy optimization.

The availability of VFDs and motor control systems enables further customization, with energy-efficient designs that benefit not only the manufacturer but also the customer. Manufacturers who capitalize on the evolving demand landscape by investing in smart, connected and service-based motor solutions stand to benefit.

Shifts in the Carbon Disulfide Market from 2020 to 2024 and Future Trends 2025 to 2035

The global carbon disulfide market grew at a consistent rate from 2020 to 2024, driven by strong demand from the textile, agricultural, and chemical industries. Rayon and cellophane manufacturing dominated, particularly as demand began to grow with packaging and apparel industries.

Moreover, the usage of the compound in the synthesis of agricultural pesticides, especially dithiocarbamates, further intensified its significance in crop protection. But carbon disulfide's environmental toxicity and occupational hazards have limited its wider use. Its market penetration was also hampered during this period by regulatory scrutiny and health-related limitations in multiple countries.

The market is moderate during the period from 2025 to 2035 with improvements in production efficiency and safer protocols of material handling further driving the growth. Manufacturers will probably turn to sustainable production methods to reduce carbon disulfide's environmental footprint.

End Use Industry Demand: The pharmaceutical segment and fine chemical synthesis are also going to witness an increased demand and provide a new path of growth. On the other side, the growing demand for biodegradable and environmentally friendly materials is predicted to support the consumption of carbon disulfide in the eco-friendly production of viscose rayon and regenerated cellulose films. However, with environmental regulations tightening and the industry slowly shifting towards less risky chemical alternatives, market players could see higher compliance loads hitting their balance sheets in time.

Market Shifts: A Comparative Analysis 2020 to 2024 vs. 2025 to 2035

Market Shift 2020 to 2024
Industry Applications Predominantly used in textile (rayon production), agriculture (pesticides), and chemical manufacturing.
Regulatory Environment Faced challenges due to environmental and health concerns, leading to stringent regulations.
Technological Integration Limited advancements in production processes, with a focus on traditional manufacturing methods.
Market Expansion Growth concentrated in regions with established textile and agricultural industries.
Consumer Preferences Demand driven by traditional applications in textiles and agriculture.
Market Shift 2025 to 2035
Industry Applications Diversification into pharmaceuticals and eco-friendly product manufacturing.
Regulatory Environment Anticipated implementation of stricter environmental policies promoting safer usage and handling.
Technological Integration Adoption of innovative and sustainable production technologies to reduce environmental impact.
Market Expansion Expansion into emerging markets driven by industrialization and demand for sustainable products.
Consumer Preferences Shift towards eco-friendly and biodegradable products, influencing market demand.

Country-wise Insights

United States

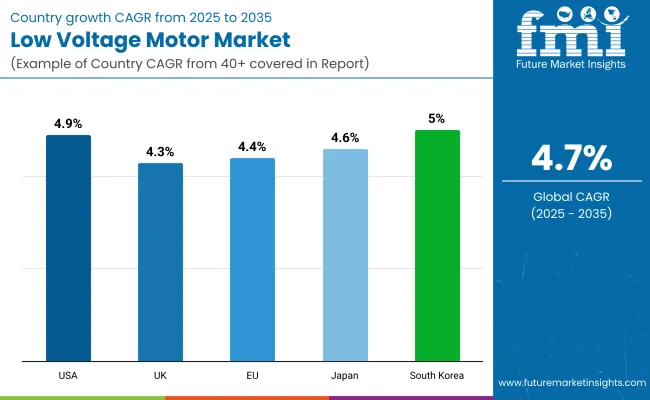
The United States Low Voltage Motor Market is and will grow at a CAGR of 4.9% CAGR during the forecasted period. Low voltage motors are used extensively in the country’s industrial ecosystem covering HVAC, water treatment, oil & gas as well as manufacturing for energy efficiency and automation. Zero-Incompatible rated motors - IE2, IE3 and IE4 Motor Systems have made the replacement of the traditional motor an easy task following the government initiatives towards the adoption of the energy-efficient Motor Systems.

Furthermore, ongoing investments toward infrastructure modernization and industrial automation are further fueling demand from industries such as smart factories and sustainable construction. With that said, domestic manufacturers also focus on research & development activity to improve the design of compact and integrated motor systems.

Country CAGR (2025 to 2035)
United States 4.9%

United Kingdom

From 2025 to 2035, the Low Voltage Motor Market in the United Kingdom is expected to increase at a CAGR of 4.3%. The increasing emphasis on energy optimization across urban and industrial sectors is directing market growth. With the UK government targeting net-zero emissions by2030, industries are being encouraged to install premium-efficiency motors, especially in HVAC and other public infrastructure.

Low voltage motors are also integral to automation in the UK dimension's food processing and logistics industries. Collaboration between universities and industrial automation companies is also fostering innovation in technologies and performance monitoring for electric drives.

Country CAGR (2025 to 2035)
United Kingdom 4.3%

Europe

The Low Voltage Motor Market in Europe will grow at a CAGR of 4.4% during the forecast period. Even though the EU is moving towards the mandatory adoption of high-efficiency motors, it remains far from being a homogenous player on the international stage, as Germany, France and Italy lead the way. IE3 efficiency standards have become mandatory as part of regulatory policies such as the Ecodesign Directive throughout the EU, which promotes replacement demand for old motors.

Low voltage motors are essential for that industrial base in the area, especially automotive, metal processing, and packaging, to be able to run around-the-clock reliable operations. The implementation of EU-funded energy-efficiency programs and digital twin technologies are also influencing trends of future adoption.

Country CAGR (2025 to 2035)
Europe 4.4%

Japan

Japan Low Voltage Motor Market is expected to witness a substantial growth rate of 4.6% during the forecast period, i.e., 2025-2035. Japanese manufacturing sectors- electronics, robotics and automotive, require high-precision low voltage motors that are compact in design, and offer high-performance. The country’s focus on industrial automation and integration of robotics is driving the acceptance of variable frequency drive (VFD)-compatible low voltage motors.

Japan’s Ministry of Economy, Trade and Industry (METI) energy efficiency regulations have also contributed to the momentum toward premium-efficiency motors. The demand from smart HVAC systems and commercial buildings is also increasing as Japan continues to replace its aging infrastructure with smart technologies.

Country CAGR (2025 to 2035)
Japan 4.6%

South Korea

The Low Voltage Motor Market in South Korea is expected to grow at a CAGR of 5.0% over the next decade. High-tech manufacturing facilities coupled with a rapidly growing smart infrastructure ecosystem are driving the need and adoption of the market.

Low voltage motors are used in conveyor belts, compressors, and robotics systems in sectors as varied as electronics, shipbuilding, and automated warehousing to enhance energy savings and make maintenance more cost effective. National energy conservation regulations are also pushing local industries to switch to IE3 and IE4 compliant motors.

Country CAGR (2025 to 2035)
South Korea 5.0%

Segmentation Outlook - Low Voltage Motor Market

IE3 Low-Voltage Motors Lead the Market with High Energy Efficiency and Regulatory Compliance

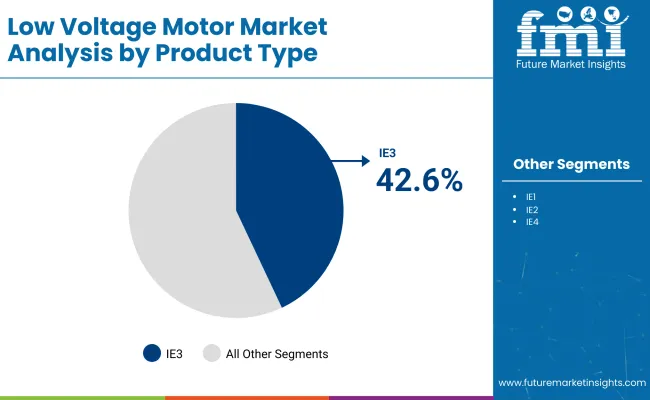
By Product Type Market Share (2025)
IE3 Low-Voltage Motors 42.6%

IE3 low-voltage motors are prevailing in the market on account of higher energy efficiency and increasing compliance requirements framed by global authorities on energy. IE3 : An exactly type of motor, which has a premium efficiency standard, works in such a way that it meets the needs of the industries, thus they can meet the power, economics and cost performance factor. These Motors consume lower power without losing torque which is why it has a great value in the industrial sector as it can perform numerous applications.

With movies banning refrigerants with high global warming potential and drafting regulations to soothe the flame-drawing energy-cost consumers, businesses are not waiting too long to comply with the energy-efficiency standards by switching to IE3 motors to prevent fines and achieve better operational savings in the long run. The motors work dependably in tough environments, from compressors and conveyors to pumps and fans, allowing manufacturers to keep processes running nonstop while also reducing energy costs.

Energy savings is emerging as a key competitive advantage, leading OEMs and plant managers to adopt IE3 low-voltage motors to optimize lifecycle costs. This move, aided by government incentives, makes these motors the choice of both new and retrofitting legacy systems. With global industrial activity on the rise and demand for energy-efficient, sustainable motor solutions expected to remain strong, the adoption of IE3 motors is going to go on fuelling further increases.
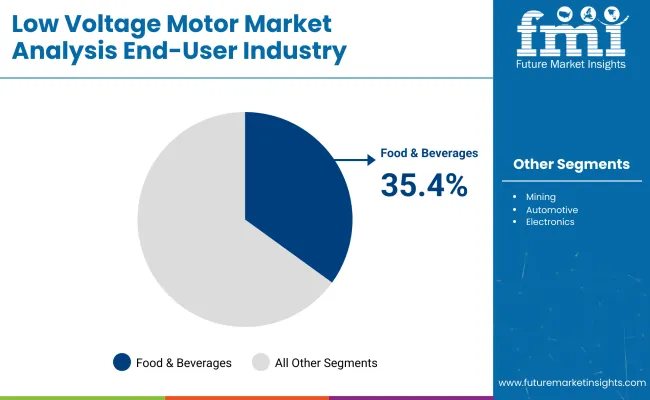
Food & Beverages Industry Drives Demand for Low Voltage Motors through Automation and Hygiene-Centric Operations

By End-User Industry Market Share (2025)
Food & Beverages 35.4%

Proliferation of automation coupled with hygiene needs in the food & beverages sector has made it the leading end-user industry in low voltage motor market. Motors are essential in processing and packaging lines to drive equipment for conveying, mixing, cooling, bottling and labeling operations. Low-voltage motors are generally used in these systems due to their small size, quiet operation, and energy-saving ability.

For manufacturers in the food industry, washdowns, moisture and temperature changes are the enemies of good equipment, which is why the motors used in food processing have to be tough. Low-voltage motors especially those with IP-rated enclosures that are designed for particular applications can meet these needs while adhering to regulatory standards around food safety and preventing cross-contamination. As food production worldwide ramps up and supply chains get further mechanized, strong, low-maintenance motors become absolutely essential.

Demand for Automation Due to automation trends especially in dairy, bakery, beverage, and processed food segments, intelligent motor systems that provide diagnostics, and remote monitoring capabilities closer to break-even point continue to drive the demand. Low-voltage motors can also help achieve energy management goals, allowing food processors to reduce operating costs while maintaining productivity and safety.

Competitive Outlook

Rising industrial automation, a growing adoption of energy-efficient motors, and infrastructure development in the manufacturing, HVAC, and power generation sectors are driving the growth of the Low Voltage Motor Market. Manufacturers are also investing into compact and energy efficient motors, adhering to IE3 and IE4 efficiency standards, among other things, growing their global footprint and aftermarket service capabilities. The global electric motor market is highly fragmented in nature owing to the presence of multinational corporations and regional manufacturers that provide various motor types such as asynchronous, synchronous, and brushless DC motors for different end-use applications.

Market Share Analysis by Company

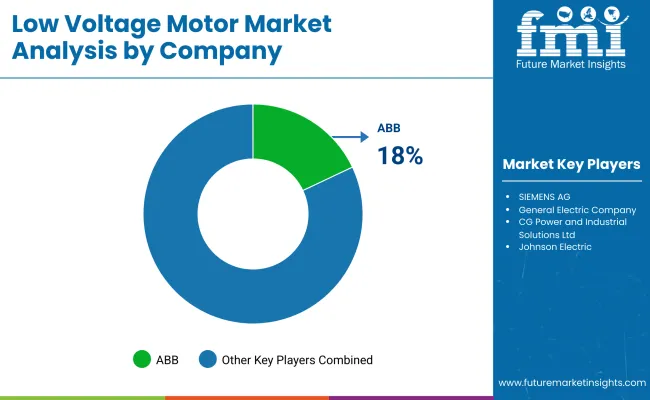
Company Name Estimated Market Share (%)
ABB 18-22%
SIEMENS AG 14-18%
General Electric Company 10-14%
CG Power and Industrial Solutions Ltd. 8-12%
Johnson Electric 6-10%
Other Companies (combined) 30-40%

Key Company Offerings and Activities 2024 to 2025

Company Name Key Offerings/Activities
ABB In 2024, launched ultra-premium IE5 low voltage motors targeting high-efficiency applications.
SIEMENS AG In 2025, expanded its Simotics motor range with digital twin integration for real-time monitoring.
General Electric Company In 2024, introduced low-voltage motors optimized for renewable energy and smart grids.
CG Power and Industrial Solutions Ltd. In 2025, increased exports of low-voltage motors across MEA and Southeast Asia.
Johnson Electric In 2024, released compact low-voltage motors for automotive and HVAC markets.

Key Company Insights

ABB (18-22%)

ABB dominates the market with high-efficiency IE5-rated motors, offering advanced control and digital monitoring features.

SIEMENS AG (14-18%)

SIEMENS delivers integrated motor solutions using smart technologies and simulation tools, enabling predictive maintenance.

General Electric Company (10-14%)

GE specializes in industrial-scale low-voltage motors tailored for specifications with sustainability, grid compatibility, and reliability in mind.

CG Power and Industrial Solutions Ltd. (8-12%)

CG Power is focused on emerging markets with durable, energy-efficient low-voltage motors optimized for extreme environments.

Johnson Electric (6-10%)

Johnson Electric specializes in miniature and precision low-voltage motors for automotive, medical, and industrial OEMs.

Other Key Players (30-40% Combined)

Several global and regional motor manufacturers contribute significantly to the market with product specialization and regional customization:

  • Hyundai Heavy Industries Co., Ltd.-Manufactures heavy-duty low-voltage motors suited for marine and offshore industries.
  • LEESON Electric-Provides general-purpose low-voltage motors with advanced customizations for North American industries.
  • Hitachi Ltd.-Focuses on compact, energy-saving low-voltage motors for HVAC and manufacturing automation.
  • G&N, Taiho Group-Produces high-performance motors for machinery and precision tools in Asian markets.
  • O.M.E. MotoriElettricis.r.l.-Offers tailored low-voltage motors for industrial equipment and European OEM customers.

Key Segmentation

By Product Type:

  • IE1
  • IE2
  • IE3
  • IE4

By End-User Industries:

  • Food & Beverages
  • Mining
  • Automotive
  • Electronics
  • Textile
  • End User Industries

By Region:

  • North America
  • Latin America
  • Western Europe
  • Eastern Europe
  • APEJ
  • Japan
  • Middle East & Africa

Table of Content

  1. Executive Summary
  2. Industry Introduction, including Taxonomy and Market Definition
  3. Market Trends and Success Factors, including Macro-economic Factors, Market Dynamics, and Recent Industry Developments
  4. Global Market Demand Analysis 2020 to 2024 and Forecast 2025 to 2035, including Historical Analysis and Future Projections
  5. Pricing Analysis
  6. Global Market Analysis 2020 to 2024 and Forecast 2025 to 2035
    • Product Type
    • End-User Industries
  7. Global Market Analysis 2020 to 2024 and Forecast 2025 to 2035, By Product Type
    • IE1
    • IE2
    • IE3
    • IE4
  8. Global Market Analysis 2020 to 2024 and Forecast 2025 to 2035, By End-User Industries
    • Food & Beverages
    • Mining
    • Automotive
    • Electronics
    • Textile
    • End User Industries
  9. Global Market Analysis 2020 to 2024 and Forecast 2025 to 2035, By Region
    • North America
    • Latin America
    • Western Europe
    • Eastern Europe
    • East Asia
    • South Asia Pacific
    • Middle East and Africa
  10. North America Sales Analysis 2020 to 2024 and Forecast 2025 to 2035, by Key Segments and Countries
  11. Latin America Sales Analysis 2020 to 2024 and Forecast 2025 to 2035, by Key Segments and Countries
  12. Western Europe Sales Analysis 2020 to 2024 and Forecast 2025 to 2035, by Key Segments and Countries
  13. Eastern Europe Sales Analysis 2020 to 2024 and Forecast 2025 to 2035, by Key Segments and Countries
  14. East Asia Sales Analysis 2020 to 2024 and Forecast 2025 to 2035, by Key Segments and Countries
  15. South Asia Pacific Sales Analysis 2020 to 2024 and Forecast 2025 to 2035, by Key Segments and Countries
  16. Middle East and Africa Sales Analysis 2020 to 2024 and Forecast 2025 to 2035, by Key Segments and Countries
  17. Sales Forecast 2025 to 2035 by Product Type and End-User Industries for 30 Countries
  18. Competition Outlook, including Market Structure Analysis, Company Share Analysis by Key Players, and Competition Dashboard
  19. Company Profile
    • ABB
    • General Electric Company
    • SIEMENS AG
    • CG Power and Industrial Solutions Ltd.
    • Hyundai Heavy Industries Co., Ltd.
    • Johnson Electric
    • LEESON Electric
    • Hitachi Ltd.
    • G&N, Taiho Group
    • O.M.E. Motori Elettrici s.r.l.

List of Tables

Table 1: Global Low Voltage Motor Market Value (US$ Mn) Forecast by Region, 2017-2032

Table 2: Global Low Voltage Motor Market Volume (000 Units) Forecast by Region, 2017-2032

Table 3: Global Low Voltage Motor Market Value (US$ Mn) Forecast by Product Type, 2017-2032

Table 4: Global Low Voltage Motor Market Volume (000 Units) Forecast by Product Type, 2017-2032

Table 5: Global Low Voltage Motor Market Value (US$ Mn) Forecast by Voltage Rating, 2017-2032

Table 6: Global Low Voltage Motor Market Volume (000 Units) Forecast by Voltage Rating, 2017-2032

Table 7: Global Low Voltage Motor Market Value (US$ Mn) Forecast by Standard, 2017-2032

Table 8: Global Low Voltage Motor Market Volume (000 Units) Forecast by Standard, 2017-2032

Table 9: Global Low Voltage Motor Market Value (US$ Mn) Forecast by Frame Enclosure, 2017-2032

Table 10: Global Low Voltage Motor Market Volume (000 Units) Forecast by Frame Enclosure, 2017-2032

Table 11: Global Low Voltage Motor Market Value (US$ Mn) Forecast by Application, 2017-2032

Table 12: Global Low Voltage Motor Market Volume (000 Units) Forecast by Application, 2017-2032

Table 13: Global Low Voltage Motor Market Value (US$ Mn) Forecast by End Use Industry, 2017-2032

Table 14: Global Low Voltage Motor Market Volume (000 Units) Forecast by End Use Industry, 2017-2032

Table 15: North America Low Voltage Motor Market Value (US$ Mn) Forecast by Country, 2017-2032

Table 16: North America Low Voltage Motor Market Volume (000 Units) Forecast by Country, 2017-2032

Table 17: North America Low Voltage Motor Market Value (US$ Mn) Forecast by Product Type, 2017-2032

Table 18: North America Low Voltage Motor Market Volume (000 Units) Forecast by Product Type, 2017-2032

Table 19: North America Low Voltage Motor Market Value (US$ Mn) Forecast by Voltage Rating, 2017-2032

Table 20: North America Low Voltage Motor Market Volume (000 Units) Forecast by Voltage Rating, 2017-2032

Table 21: North America Low Voltage Motor Market Value (US$ Mn) Forecast by Standard, 2017-2032

Table 22: North America Low Voltage Motor Market Volume (000 Units) Forecast by Standard, 2017-2032

Table 23: North America Low Voltage Motor Market Value (US$ Mn) Forecast by Frame Enclosure, 2017-2032

Table 24: North America Low Voltage Motor Market Volume (000 Units) Forecast by Frame Enclosure, 2017-2032

Table 25: North America Low Voltage Motor Market Value (US$ Mn) Forecast by Application, 2017-2032

Table 26: North America Low Voltage Motor Market Volume (000 Units) Forecast by Application, 2017-2032

Table 27: North America Low Voltage Motor Market Value (US$ Mn) Forecast by End Use Industry, 2017-2032

Table 28: North America Low Voltage Motor Market Volume (000 Units) Forecast by End Use Industry, 2017-2032

Table 29: Latin America Low Voltage Motor Market Value (US$ Mn) Forecast by Country, 2017-2032

Table 30: Latin America Low Voltage Motor Market Volume (000 Units) Forecast by Country, 2017-2032

Table 31: Latin America Low Voltage Motor Market Value (US$ Mn) Forecast by Product Type, 2017-2032

Table 32: Latin America Low Voltage Motor Market Volume (000 Units) Forecast by Product Type, 2017-2032

Table 33: Latin America Low Voltage Motor Market Value (US$ Mn) Forecast by Voltage Rating, 2017-2032

Table 34: Latin America Low Voltage Motor Market Volume (000 Units) Forecast by Voltage Rating, 2017-2032

Table 35: Latin America Low Voltage Motor Market Value (US$ Mn) Forecast by Standard, 2017-2032

Table 36: Latin America Low Voltage Motor Market Volume (000 Units) Forecast by Standard, 2017-2032

Table 37: Latin America Low Voltage Motor Market Value (US$ Mn) Forecast by Frame Enclosure, 2017-2032

Table 38: Latin America Low Voltage Motor Market Volume (000 Units) Forecast by Frame Enclosure, 2017-2032

Table 39: Latin America Low Voltage Motor Market Value (US$ Mn) Forecast by Application, 2017-2032

Table 40: Latin America Low Voltage Motor Market Volume (000 Units) Forecast by Application, 2017-2032

Table 41: Latin America Low Voltage Motor Market Value (US$ Mn) Forecast by End Use Industry, 2017-2032

Table 42: Latin America Low Voltage Motor Market Volume (000 Units) Forecast by End Use Industry, 2017-2032

Table 43: Europe Low Voltage Motor Market Value (US$ Mn) Forecast by Country, 2017-2032

Table 44: Europe Low Voltage Motor Market Volume (000 Units) Forecast by Country, 2017-2032

Table 45: Europe Low Voltage Motor Market Value (US$ Mn) Forecast by Product Type, 2017-2032

Table 46: Europe Low Voltage Motor Market Volume (000 Units) Forecast by Product Type, 2017-2032

Table 47: Europe Low Voltage Motor Market Value (US$ Mn) Forecast by Voltage Rating, 2017-2032

Table 48: Europe Low Voltage Motor Market Volume (000 Units) Forecast by Voltage Rating, 2017-2032

Table 49: Europe Low Voltage Motor Market Value (US$ Mn) Forecast by Standard, 2017-2032

Table 50: Europe Low Voltage Motor Market Volume (000 Units) Forecast by Standard, 2017-2032

Table 51: Europe Low Voltage Motor Market Value (US$ Mn) Forecast by Frame Enclosure, 2017-2032

Table 52: Europe Low Voltage Motor Market Volume (000 Units) Forecast by Frame Enclosure, 2017-2032

Table 53: Europe Low Voltage Motor Market Value (US$ Mn) Forecast by Application, 2017-2032

Table 54: Europe Low Voltage Motor Market Volume (000 Units) Forecast by Application, 2017-2032

Table 55: Europe Low Voltage Motor Market Value (US$ Mn) Forecast by End Use Industry, 2017-2032

Table 56: Europe Low Voltage Motor Market Volume (000 Units) Forecast by End Use Industry, 2017-2032

Table 57: East Asia Low Voltage Motor Market Value (US$ Mn) Forecast by Country, 2017-2032

Table 58: East Asia Low Voltage Motor Market Volume (000 Units) Forecast by Country, 2017-2032

Table 59: East Asia Low Voltage Motor Market Value (US$ Mn) Forecast by Product Type, 2017-2032

Table 60: East Asia Low Voltage Motor Market Volume (000 Units) Forecast by Product Type, 2017-2032

Table 61: East Asia Low Voltage Motor Market Value (US$ Mn) Forecast by Voltage Rating, 2017-2032

Table 62: East Asia Low Voltage Motor Market Volume (000 Units) Forecast by Voltage Rating, 2017-2032

Table 63: East Asia Low Voltage Motor Market Value (US$ Mn) Forecast by Standard, 2017-2032

Table 64: East Asia Low Voltage Motor Market Volume (000 Units) Forecast by Standard, 2017-2032

Table 65: East Asia Low Voltage Motor Market Value (US$ Mn) Forecast by Frame Enclosure, 2017-2032

Table 66: East Asia Low Voltage Motor Market Volume (000 Units) Forecast by Frame Enclosure, 2017-2032

Table 67: East Asia Low Voltage Motor Market Value (US$ Mn) Forecast by Application, 2017-2032

Table 68: East Asia Low Voltage Motor Market Volume (000 Units) Forecast by Application, 2017-2032

Table 69: East Asia Low Voltage Motor Market Value (US$ Mn) Forecast by End Use Industry, 2017-2032

Table 70: East Asia Low Voltage Motor Market Volume (000 Units) Forecast by End Use Industry, 2017-2032

Table 71: South Asia & Pacific Low Voltage Motor Market Value (US$ Mn) Forecast by Country, 2017-2032

Table 72: South Asia & Pacific Low Voltage Motor Market Volume (000 Units) Forecast by Country, 2017-2032

Table 73: South Asia & Pacific Low Voltage Motor Market Value (US$ Mn) Forecast by Product Type, 2017-2032

Table 74: South Asia & Pacific Low Voltage Motor Market Volume (000 Units) Forecast by Product Type, 2017-2032

Table 75: South Asia & Pacific Low Voltage Motor Market Value (US$ Mn) Forecast by Voltage Rating, 2017-2032

Table 76: South Asia & Pacific Low Voltage Motor Market Volume (000 Units) Forecast by Voltage Rating, 2017-2032

Table 77: South Asia & Pacific Low Voltage Motor Market Value (US$ Mn) Forecast by Standard, 2017-2032

Table 78: South Asia & Pacific Low Voltage Motor Market Volume (000 Units) Forecast by Standard, 2017-2032

Table 79: South Asia & Pacific Low Voltage Motor Market Value (US$ Mn) Forecast by Frame Enclosure, 2017-2032

Table 80: South Asia & Pacific Low Voltage Motor Market Volume (000 Units) Forecast by Frame Enclosure, 2017-2032

Table 81: South Asia & Pacific Low Voltage Motor Market Value (US$ Mn) Forecast by Application, 2017-2032

Table 82: South Asia & Pacific Low Voltage Motor Market Volume (000 Units) Forecast by Application, 2017-2032

Table 83: South Asia & Pacific Low Voltage Motor Market Value (US$ Mn) Forecast by End Use Industry, 2017-2032

Table 84: South Asia & Pacific Low Voltage Motor Market Volume (000 Units) Forecast by End Use Industry, 2017-2032

Table 85: MEA Low Voltage Motor Market Value (US$ Mn) Forecast by Country, 2017-2032

Table 86: MEA Low Voltage Motor Market Volume (000 Units) Forecast by Country, 2017-2032

Table 87: MEA Low Voltage Motor Market Value (US$ Mn) Forecast by Product Type, 2017-2032

Table 88: MEA Low Voltage Motor Market Volume (000 Units) Forecast by Product Type, 2017-2032

Table 89: MEA Low Voltage Motor Market Value (US$ Mn) Forecast by Voltage Rating, 2017-2032

Table 90: MEA Low Voltage Motor Market Volume (000 Units) Forecast by Voltage Rating, 2017-2032

Table 91: MEA Low Voltage Motor Market Value (US$ Mn) Forecast by Standard, 2017-2032

Table 92: MEA Low Voltage Motor Market Volume (000 Units) Forecast by Standard, 2017-2032

Table 93: MEA Low Voltage Motor Market Value (US$ Mn) Forecast by Frame Enclosure, 2017-2032

Table 94: MEA Low Voltage Motor Market Volume (000 Units) Forecast by Frame Enclosure, 2017-2032

Table 95: MEA Low Voltage Motor Market Value (US$ Mn) Forecast by Application, 2017-2032

Table 96: MEA Low Voltage Motor Market Volume (000 Units) Forecast by Application, 2017-2032

Table 97: MEA Low Voltage Motor Market Value (US$ Mn) Forecast by End Use Industry, 2017-2032

Table 98: MEA Low Voltage Motor Market Volume (000 Units) Forecast by End Use Industry, 2017-2032

List of Figures

Figure 1: Global Low Voltage Motor Market Value (US$ Mn) by Product Type, 2022-2032

Figure 2: Global Low Voltage Motor Market Value (US$ Mn) by Voltage Rating, 2022-2032

Figure 3: Global Low Voltage Motor Market Value (US$ Mn) by Standard, 2022-2032

Figure 4: Global Low Voltage Motor Market Value (US$ Mn) by Frame Enclosure, 2022-2032

Figure 5: Global Low Voltage Motor Market Value (US$ Mn) by Application, 2022-2032

Figure 6: Global Low Voltage Motor Market Value (US$ Mn) by End Use Industry, 2022-2032

Figure 7: Global Low Voltage Motor Market Value (US$ Mn) by Region, 2022-2032

Figure 8: Global Low Voltage Motor Market Value (US$ Mn) Analysis by Region, 2017-2032

Figure 9: Global Low Voltage Motor Market Volume (000 Units) Analysis by Region, 2017-2032

Figure 10: Global Low Voltage Motor Market Value Share (%) and BPS Analysis by Region, 2022-2032

Figure 11: Global Low Voltage Motor Market Y-o-Y Growth (%) Projections by Region, 2022-2032

Figure 12: Global Low Voltage Motor Market Value (US$ Mn) Analysis by Product Type, 2017-2032

Figure 13: Global Low Voltage Motor Market Volume (000 Units) Analysis by Product Type, 2017-2032

Figure 14: Global Low Voltage Motor Market Value Share (%) and BPS Analysis by Product Type, 2022-2032

Figure 15: Global Low Voltage Motor Market Y-o-Y Growth (%) Projections by Product Type, 2022-2032

Figure 16: Global Low Voltage Motor Market Value (US$ Mn) Analysis by Voltage Rating, 2017-2032

Figure 17: Global Low Voltage Motor Market Volume (000 Units) Analysis by Voltage Rating, 2017-2032

Figure 18: Global Low Voltage Motor Market Value Share (%) and BPS Analysis by Voltage Rating, 2022-2032

Figure 19: Global Low Voltage Motor Market Y-o-Y Growth (%) Projections by Voltage Rating, 2022-2032

Figure 20: Global Low Voltage Motor Market Value (US$ Mn) Analysis by Standard, 2017-2032

Figure 21: Global Low Voltage Motor Market Volume (000 Units) Analysis by Standard, 2017-2032

Figure 22: Global Low Voltage Motor Market Value Share (%) and BPS Analysis by Standard, 2022-2032

Figure 23: Global Low Voltage Motor Market Y-o-Y Growth (%) Projections by Standard, 2022-2032

Figure 24: Global Low Voltage Motor Market Value (US$ Mn) Analysis by Frame Enclosure, 2017-2032

Figure 25: Global Low Voltage Motor Market Volume (000 Units) Analysis by Frame Enclosure, 2017-2032

Figure 26: Global Low Voltage Motor Market Value Share (%) and BPS Analysis by Frame Enclosure, 2022-2032

Figure 27: Global Low Voltage Motor Market Y-o-Y Growth (%) Projections by Frame Enclosure, 2022-2032

Figure 28: Global Low Voltage Motor Market Value (US$ Mn) Analysis by Application, 2017-2032

Figure 29: Global Low Voltage Motor Market Volume (000 Units) Analysis by Application, 2017-2032

Figure 30: Global Low Voltage Motor Market Value Share (%) and BPS Analysis by Application, 2022-2032

Figure 31: Global Low Voltage Motor Market Y-o-Y Growth (%) Projections by Application, 2022-2032

Figure 32: Global Low Voltage Motor Market Value (US$ Mn) Analysis by End Use Industry, 2017-2032

Figure 33: Global Low Voltage Motor Market Volume (000 Units) Analysis by End Use Industry, 2017-2032

Figure 34: Global Low Voltage Motor Market Value Share (%) and BPS Analysis by End Use Industry, 2022-2032

Figure 35: Global Low Voltage Motor Market Y-o-Y Growth (%) Projections by End Use Industry, 2022-2032

Figure 36: Global Low Voltage Motor Market Attractiveness by Product Type, 2022-2032

Figure 37: Global Low Voltage Motor Market Attractiveness by Voltage Rating, 2022-2032

Figure 38: Global Low Voltage Motor Market Attractiveness by Standard, 2022-2032

Figure 39: Global Low Voltage Motor Market Attractiveness by Frame Enclosure, 2022-2032

Figure 40: Global Low Voltage Motor Market Attractiveness by Application, 2022-2032

Figure 41: Global Low Voltage Motor Market Attractiveness by End Use Industry, 2022-2032

Figure 42: Global Low Voltage Motor Market Attractiveness by Region, 2022-2032

Figure 43: North America Low Voltage Motor Market Value (US$ Mn) by Product Type, 2022-2032

Figure 44: North America Low Voltage Motor Market Value (US$ Mn) by Voltage Rating, 2022-2032

Figure 45: North America Low Voltage Motor Market Value (US$ Mn) by Standard, 2022-2032

Figure 46: North America Low Voltage Motor Market Value (US$ Mn) by Frame Enclosure, 2022-2032

Figure 47: North America Low Voltage Motor Market Value (US$ Mn) by Application, 2022-2032

Figure 48: North America Low Voltage Motor Market Value (US$ Mn) by End Use Industry, 2022-2032

Figure 49: North America Low Voltage Motor Market Value (US$ Mn) by Country, 2022-2032

Figure 50: North America Low Voltage Motor Market Value (US$ Mn) Analysis by Country, 2017-2032

Figure 51: North America Low Voltage Motor Market Volume (000 Units) Analysis by Country, 2017-2032

Figure 52: North America Low Voltage Motor Market Value Share (%) and BPS Analysis by Country, 2022-2032

Figure 53: North America Low Voltage Motor Market Y-o-Y Growth (%) Projections by Country, 2022-2032

Figure 54: North America Low Voltage Motor Market Value (US$ Mn) Analysis by Product Type, 2017-2032

Figure 55: North America Low Voltage Motor Market Volume (000 Units) Analysis by Product Type, 2017-2032

Figure 56: North America Low Voltage Motor Market Value Share (%) and BPS Analysis by Product Type, 2022-2032

Figure 57: North America Low Voltage Motor Market Y-o-Y Growth (%) Projections by Product Type, 2022-2032

Figure 58: North America Low Voltage Motor Market Value (US$ Mn) Analysis by Voltage Rating, 2017-2032

Figure 59: North America Low Voltage Motor Market Volume (000 Units) Analysis by Voltage Rating, 2017-2032

Figure 60: North America Low Voltage Motor Market Value Share (%) and BPS Analysis by Voltage Rating, 2022-2032

Figure 61: North America Low Voltage Motor Market Y-o-Y Growth (%) Projections by Voltage Rating, 2022-2032

Figure 62: North America Low Voltage Motor Market Value (US$ Mn) Analysis by Standard, 2017-2032

Figure 63: North America Low Voltage Motor Market Volume (000 Units) Analysis by Standard, 2017-2032

Figure 64: North America Low Voltage Motor Market Value Share (%) and BPS Analysis by Standard, 2022-2032

Figure 65: North America Low Voltage Motor Market Y-o-Y Growth (%) Projections by Standard, 2022-2032

Figure 66: North America Low Voltage Motor Market Value (US$ Mn) Analysis by Frame Enclosure, 2017-2032

Figure 67: North America Low Voltage Motor Market Volume (000 Units) Analysis by Frame Enclosure, 2017-2032

Figure 68: North America Low Voltage Motor Market Value Share (%) and BPS Analysis by Frame Enclosure, 2022-2032

Figure 69: North America Low Voltage Motor Market Y-o-Y Growth (%) Projections by Frame Enclosure, 2022-2032

Figure 70: North America Low Voltage Motor Market Value (US$ Mn) Analysis by Application, 2017-2032

Figure 71: North America Low Voltage Motor Market Volume (000 Units) Analysis by Application, 2017-2032

Figure 72: North America Low Voltage Motor Market Value Share (%) and BPS Analysis by Application, 2022-2032

Figure 73: North America Low Voltage Motor Market Y-o-Y Growth (%) Projections by Application, 2022-2032

Figure 74: North America Low Voltage Motor Market Value (US$ Mn) Analysis by End Use Industry, 2017-2032

Figure 75: North America Low Voltage Motor Market Volume (000 Units) Analysis by End Use Industry, 2017-2032

Figure 76: North America Low Voltage Motor Market Value Share (%) and BPS Analysis by End Use Industry, 2022-2032

Figure 77: North America Low Voltage Motor Market Y-o-Y Growth (%) Projections by End Use Industry, 2022-2032

Figure 78: North America Low Voltage Motor Market Attractiveness by Product Type, 2022-2032

Figure 79: North America Low Voltage Motor Market Attractiveness by Voltage Rating, 2022-2032

Figure 80: North America Low Voltage Motor Market Attractiveness by Standard, 2022-2032

Figure 81: North America Low Voltage Motor Market Attractiveness by Frame Enclosure, 2022-2032

Figure 82: North America Low Voltage Motor Market Attractiveness by Application, 2022-2032

Figure 83: North America Low Voltage Motor Market Attractiveness by End Use Industry, 2022-2032

Figure 84: North America Low Voltage Motor Market Attractiveness by Country, 2022-2032

Figure 85: Latin America Low Voltage Motor Market Value (US$ Mn) by Product Type, 2022-2032

Figure 86: Latin America Low Voltage Motor Market Value (US$ Mn) by Voltage Rating, 2022-2032

Figure 87: Latin America Low Voltage Motor Market Value (US$ Mn) by Standard, 2022-2032

Figure 88: Latin America Low Voltage Motor Market Value (US$ Mn) by Frame Enclosure, 2022-2032

Figure 89: Latin America Low Voltage Motor Market Value (US$ Mn) by Application, 2022-2032

Figure 90: Latin America Low Voltage Motor Market Value (US$ Mn) by End Use Industry, 2022-2032

Figure 91: Latin America Low Voltage Motor Market Value (US$ Mn) by Country, 2022-2032

Figure 92: Latin America Low Voltage Motor Market Value (US$ Mn) Analysis by Country, 2017-2032

Figure 93: Latin America Low Voltage Motor Market Volume (000 Units) Analysis by Country, 2017-2032

Figure 94: Latin America Low Voltage Motor Market Value Share (%) and BPS Analysis by Country, 2022-2032

Figure 95: Latin America Low Voltage Motor Market Y-o-Y Growth (%) Projections by Country, 2022-2032

Figure 96: Latin America Low Voltage Motor Market Value (US$ Mn) Analysis by Product Type, 2017-2032

Figure 97: Latin America Low Voltage Motor Market Volume (000 Units) Analysis by Product Type, 2017-2032

Figure 98: Latin America Low Voltage Motor Market Value Share (%) and BPS Analysis by Product Type, 2022-2032

Figure 99: Latin America Low Voltage Motor Market Y-o-Y Growth (%) Projections by Product Type, 2022-2032

Figure 100: Latin America Low Voltage Motor Market Value (US$ Mn) Analysis by Voltage Rating, 2017-2032

Figure 101: Latin America Low Voltage Motor Market Volume (000 Units) Analysis by Voltage Rating, 2017-2032

Figure 102: Latin America Low Voltage Motor Market Value Share (%) and BPS Analysis by Voltage Rating, 2022-2032

Figure 103: Latin America Low Voltage Motor Market Y-o-Y Growth (%) Projections by Voltage Rating, 2022-2032

Figure 104: Latin America Low Voltage Motor Market Value (US$ Mn) Analysis by Standard, 2017-2032

Figure 105: Latin America Low Voltage Motor Market Volume (000 Units) Analysis by Standard, 2017-2032

Figure 106: Latin America Low Voltage Motor Market Value Share (%) and BPS Analysis by Standard, 2022-2032

Figure 107: Latin America Low Voltage Motor Market Y-o-Y Growth (%) Projections by Standard, 2022-2032

Figure 108: Latin America Low Voltage Motor Market Value (US$ Mn) Analysis by Frame Enclosure, 2017-2032

Figure 109: Latin America Low Voltage Motor Market Volume (000 Units) Analysis by Frame Enclosure, 2017-2032

Figure 110: Latin America Low Voltage Motor Market Value Share (%) and BPS Analysis by Frame Enclosure, 2022-2032

Figure 111: Latin America Low Voltage Motor Market Y-o-Y Growth (%) Projections by Frame Enclosure, 2022-2032

Figure 112: Latin America Low Voltage Motor Market Value (US$ Mn) Analysis by Application, 2017-2032

Figure 113: Latin America Low Voltage Motor Market Volume (000 Units) Analysis by Application, 2017-2032

Figure 114: Latin America Low Voltage Motor Market Value Share (%) and BPS Analysis by Application, 2022-2032

Figure 115: Latin America Low Voltage Motor Market Y-o-Y Growth (%) Projections by Application, 2022-2032

Figure 116: Latin America Low Voltage Motor Market Value (US$ Mn) Analysis by End Use Industry, 2017-2032

Figure 117: Latin America Low Voltage Motor Market Volume (000 Units) Analysis by End Use Industry, 2017-2032

Figure 118: Latin America Low Voltage Motor Market Value Share (%) and BPS Analysis by End Use Industry, 2022-2032

Figure 119: Latin America Low Voltage Motor Market Y-o-Y Growth (%) Projections by End Use Industry, 2022-2032

Figure 120: Latin America Low Voltage Motor Market Attractiveness by Product Type, 2022-2032

Figure 121: Latin America Low Voltage Motor Market Attractiveness by Voltage Rating, 2022-2032

Figure 122: Latin America Low Voltage Motor Market Attractiveness by Standard, 2022-2032

Figure 123: Latin America Low Voltage Motor Market Attractiveness by Frame Enclosure, 2022-2032

Figure 124: Latin America Low Voltage Motor Market Attractiveness by Application, 2022-2032

Figure 125: Latin America Low Voltage Motor Market Attractiveness by End Use Industry, 2022-2032

Figure 126: Latin America Low Voltage Motor Market Attractiveness by Country, 2022-2032

Figure 127: Europe Low Voltage Motor Market Value (US$ Mn) by Product Type, 2022-2032

Figure 128: Europe Low Voltage Motor Market Value (US$ Mn) by Voltage Rating, 2022-2032

Figure 129: Europe Low Voltage Motor Market Value (US$ Mn) by Standard, 2022-2032

Figure 130: Europe Low Voltage Motor Market Value (US$ Mn) by Frame Enclosure, 2022-2032

Figure 131: Europe Low Voltage Motor Market Value (US$ Mn) by Application, 2022-2032

Figure 132: Europe Low Voltage Motor Market Value (US$ Mn) by End Use Industry, 2022-2032

Figure 133: Europe Low Voltage Motor Market Value (US$ Mn) by Country, 2022-2032

Figure 134: Europe Low Voltage Motor Market Value (US$ Mn) Analysis by Country, 2017-2032

Figure 135: Europe Low Voltage Motor Market Volume (000 Units) Analysis by Country, 2017-2032

Figure 136: Europe Low Voltage Motor Market Value Share (%) and BPS Analysis by Country, 2022-2032

Figure 137: Europe Low Voltage Motor Market Y-o-Y Growth (%) Projections by Country, 2022-2032

Figure 138: Europe Low Voltage Motor Market Value (US$ Mn) Analysis by Product Type, 2017-2032

Figure 139: Europe Low Voltage Motor Market Volume (000 Units) Analysis by Product Type, 2017-2032

Figure 140: Europe Low Voltage Motor Market Value Share (%) and BPS Analysis by Product Type, 2022-2032

Figure 141: Europe Low Voltage Motor Market Y-o-Y Growth (%) Projections by Product Type, 2022-2032

Figure 142: Europe Low Voltage Motor Market Value (US$ Mn) Analysis by Voltage Rating, 2017-2032

Figure 143: Europe Low Voltage Motor Market Volume (000 Units) Analysis by Voltage Rating, 2017-2032

Figure 144: Europe Low Voltage Motor Market Value Share (%) and BPS Analysis by Voltage Rating, 2022-2032

Figure 145: Europe Low Voltage Motor Market Y-o-Y Growth (%) Projections by Voltage Rating, 2022-2032

Figure 146: Europe Low Voltage Motor Market Value (US$ Mn) Analysis by Standard, 2017-2032

Figure 147: Europe Low Voltage Motor Market Volume (000 Units) Analysis by Standard, 2017-2032

Figure 148: Europe Low Voltage Motor Market Value Share (%) and BPS Analysis by Standard, 2022-2032

Figure 149: Europe Low Voltage Motor Market Y-o-Y Growth (%) Projections by Standard, 2022-2032

Figure 150: Europe Low Voltage Motor Market Value (US$ Mn) Analysis by Frame Enclosure, 2017-2032

Figure 151: Europe Low Voltage Motor Market Volume (000 Units) Analysis by Frame Enclosure, 2017-2032

Figure 152: Europe Low Voltage Motor Market Value Share (%) and BPS Analysis by Frame Enclosure, 2022-2032

Figure 153: Europe Low Voltage Motor Market Y-o-Y Growth (%) Projections by Frame Enclosure, 2022-2032

Figure 154: Europe Low Voltage Motor Market Value (US$ Mn) Analysis by Application, 2017-2032

Figure 155: Europe Low Voltage Motor Market Volume (000 Units) Analysis by Application, 2017-2032

Figure 156: Europe Low Voltage Motor Market Value Share (%) and BPS Analysis by Application, 2022-2032

Figure 157: Europe Low Voltage Motor Market Y-o-Y Growth (%) Projections by Application, 2022-2032

Figure 158: Europe Low Voltage Motor Market Value (US$ Mn) Analysis by End Use Industry, 2017-2032

Figure 159: Europe Low Voltage Motor Market Volume (000 Units) Analysis by End Use Industry, 2017-2032

Figure 160: Europe Low Voltage Motor Market Value Share (%) and BPS Analysis by End Use Industry, 2022-2032

Figure 161: Europe Low Voltage Motor Market Y-o-Y Growth (%) Projections by End Use Industry, 2022-2032

Figure 162: Europe Low Voltage Motor Market Attractiveness by Product Type, 2022-2032

Figure 163: Europe Low Voltage Motor Market Attractiveness by Voltage Rating, 2022-2032

Figure 164: Europe Low Voltage Motor Market Attractiveness by Standard, 2022-2032

Figure 165: Europe Low Voltage Motor Market Attractiveness by Frame Enclosure, 2022-2032

Figure 166: Europe Low Voltage Motor Market Attractiveness by Application, 2022-2032

Figure 167: Europe Low Voltage Motor Market Attractiveness by End Use Industry, 2022-2032

Figure 168: Europe Low Voltage Motor Market Attractiveness by Country, 2022-2032

Figure 169: East Asia Low Voltage Motor Market Value (US$ Mn) by Product Type, 2022-2032

Figure 170: East Asia Low Voltage Motor Market Value (US$ Mn) by Voltage Rating, 2022-2032

Figure 171: East Asia Low Voltage Motor Market Value (US$ Mn) by Standard, 2022-2032

Figure 172: East Asia Low Voltage Motor Market Value (US$ Mn) by Frame Enclosure, 2022-2032

Figure 173: East Asia Low Voltage Motor Market Value (US$ Mn) by Application, 2022-2032

Figure 174: East Asia Low Voltage Motor Market Value (US$ Mn) by End Use Industry, 2022-2032

Figure 175: East Asia Low Voltage Motor Market Value (US$ Mn) by Country, 2022-2032

Figure 176: East Asia Low Voltage Motor Market Value (US$ Mn) Analysis by Country, 2017-2032

Figure 177: East Asia Low Voltage Motor Market Volume (000 Units) Analysis by Country, 2017-2032

Figure 178: East Asia Low Voltage Motor Market Value Share (%) and BPS Analysis by Country, 2022-2032

Figure 179: East Asia Low Voltage Motor Market Y-o-Y Growth (%) Projections by Country, 2022-2032

Figure 180: East Asia Low Voltage Motor Market Value (US$ Mn) Analysis by Product Type, 2017-2032

Figure 181: East Asia Low Voltage Motor Market Volume (000 Units) Analysis by Product Type, 2017-2032

Figure 182: East Asia Low Voltage Motor Market Value Share (%) and BPS Analysis by Product Type, 2022-2032

Figure 183: East Asia Low Voltage Motor Market Y-o-Y Growth (%) Projections by Product Type, 2022-2032

Figure 184: East Asia Low Voltage Motor Market Value (US$ Mn) Analysis by Voltage Rating, 2017-2032

Figure 185: East Asia Low Voltage Motor Market Volume (000 Units) Analysis by Voltage Rating, 2017-2032

Figure 186: East Asia Low Voltage Motor Market Value Share (%) and BPS Analysis by Voltage Rating, 2022-2032

Figure 187: East Asia Low Voltage Motor Market Y-o-Y Growth (%) Projections by Voltage Rating, 2022-2032

Figure 188: East Asia Low Voltage Motor Market Value (US$ Mn) Analysis by Standard, 2017-2032

Figure 189: East Asia Low Voltage Motor Market Volume (000 Units) Analysis by Standard, 2017-2032

Figure 190: East Asia Low Voltage Motor Market Value Share (%) and BPS Analysis by Standard, 2022-2032

Figure 191: East Asia Low Voltage Motor Market Y-o-Y Growth (%) Projections by Standard, 2022-2032

Figure 192: East Asia Low Voltage Motor Market Value (US$ Mn) Analysis by Frame Enclosure, 2017-2032

Figure 193: East Asia Low Voltage Motor Market Volume (000 Units) Analysis by Frame Enclosure, 2017-2032

Figure 194: East Asia Low Voltage Motor Market Value Share (%) and BPS Analysis by Frame Enclosure, 2022-2032

Figure 195: East Asia Low Voltage Motor Market Y-o-Y Growth (%) Projections by Frame Enclosure, 2022-2032

Figure 196: East Asia Low Voltage Motor Market Value (US$ Mn) Analysis by Application, 2017-2032

Figure 197: East Asia Low Voltage Motor Market Volume (000 Units) Analysis by Application, 2017-2032

Figure 198: East Asia Low Voltage Motor Market Value Share (%) and BPS Analysis by Application, 2022-2032

Figure 199: East Asia Low Voltage Motor Market Y-o-Y Growth (%) Projections by Application, 2022-2032

Figure 200: East Asia Low Voltage Motor Market Value (US$ Mn) Analysis by End Use Industry, 2017-2032

Figure 201: East Asia Low Voltage Motor Market Volume (000 Units) Analysis by End Use Industry, 2017-2032

Figure 202: East Asia Low Voltage Motor Market Value Share (%) and BPS Analysis by End Use Industry, 2022-2032

Figure 203: East Asia Low Voltage Motor Market Y-o-Y Growth (%) Projections by End Use Industry, 2022-2032

Figure 204: East Asia Low Voltage Motor Market Attractiveness by Product Type, 2022-2032

Figure 205: East Asia Low Voltage Motor Market Attractiveness by Voltage Rating, 2022-2032

Figure 206: East Asia Low Voltage Motor Market Attractiveness by Standard, 2022-2032

Figure 207: East Asia Low Voltage Motor Market Attractiveness by Frame Enclosure, 2022-2032

Figure 208: East Asia Low Voltage Motor Market Attractiveness by Application, 2022-2032

Figure 209: East Asia Low Voltage Motor Market Attractiveness by End Use Industry, 2022-2032

Figure 210: East Asia Low Voltage Motor Market Attractiveness by Country, 2022-2032

Figure 211: South Asia & Pacific Low Voltage Motor Market Value (US$ Mn) by Product Type, 2022-2032

Figure 212: South Asia & Pacific Low Voltage Motor Market Value (US$ Mn) by Voltage Rating, 2022-2032

Figure 213: South Asia & Pacific Low Voltage Motor Market Value (US$ Mn) by Standard, 2022-2032

Figure 214: South Asia & Pacific Low Voltage Motor Market Value (US$ Mn) by Frame Enclosure, 2022-2032

Figure 215: South Asia & Pacific Low Voltage Motor Market Value (US$ Mn) by Application, 2022-2032

Figure 216: South Asia & Pacific Low Voltage Motor Market Value (US$ Mn) by End Use Industry, 2022-2032

Figure 217: South Asia & Pacific Low Voltage Motor Market Value (US$ Mn) by Country, 2022-2032

Figure 218: South Asia & Pacific Low Voltage Motor Market Value (US$ Mn) Analysis by Country, 2017-2032

Figure 219: South Asia & Pacific Low Voltage Motor Market Volume (000 Units) Analysis by Country, 2017-2032

Figure 220: South Asia & Pacific Low Voltage Motor Market Value Share (%) and BPS Analysis by Country, 2022-2032

Figure 221: South Asia & Pacific Low Voltage Motor Market Y-o-Y Growth (%) Projections by Country, 2022-2032

Figure 222: South Asia & Pacific Low Voltage Motor Market Value (US$ Mn) Analysis by Product Type, 2017-2032

Figure 223: South Asia & Pacific Low Voltage Motor Market Volume (000 Units) Analysis by Product Type, 2017-2032

Figure 224: South Asia & Pacific Low Voltage Motor Market Value Share (%) and BPS Analysis by Product Type, 2022-2032

Figure 225: South Asia & Pacific Low Voltage Motor Market Y-o-Y Growth (%) Projections by Product Type, 2022-2032

Figure 226: South Asia & Pacific Low Voltage Motor Market Value (US$ Mn) Analysis by Voltage Rating, 2017-2032

Figure 227: South Asia & Pacific Low Voltage Motor Market Volume (000 Units) Analysis by Voltage Rating, 2017-2032

Figure 228: South Asia & Pacific Low Voltage Motor Market Value Share (%) and BPS Analysis by Voltage Rating, 2022-2032

Figure 229: South Asia & Pacific Low Voltage Motor Market Y-o-Y Growth (%) Projections by Voltage Rating, 2022-2032

Figure 230: South Asia & Pacific Low Voltage Motor Market Value (US$ Mn) Analysis by Standard, 2017-2032

Figure 231: South Asia & Pacific Low Voltage Motor Market Volume (000 Units) Analysis by Standard, 2017-2032

Figure 232: South Asia & Pacific Low Voltage Motor Market Value Share (%) and BPS Analysis by Standard, 2022-2032

Figure 233: South Asia & Pacific Low Voltage Motor Market Y-o-Y Growth (%) Projections by Standard, 2022-2032

Figure 234: South Asia & Pacific Low Voltage Motor Market Value (US$ Mn) Analysis by Frame Enclosure, 2017-2032

Figure 235: South Asia & Pacific Low Voltage Motor Market Volume (000 Units) Analysis by Frame Enclosure, 2017-2032

Figure 236: South Asia & Pacific Low Voltage Motor Market Value Share (%) and BPS Analysis by Frame Enclosure, 2022-2032

Figure 237: South Asia & Pacific Low Voltage Motor Market Y-o-Y Growth (%) Projections by Frame Enclosure, 2022-2032

Figure 238: South Asia & Pacific Low Voltage Motor Market Value (US$ Mn) Analysis by Application, 2017-2032

Figure 239: South Asia & Pacific Low Voltage Motor Market Volume (000 Units) Analysis by Application, 2017-2032

Figure 240: South Asia & Pacific Low Voltage Motor Market Value Share (%) and BPS Analysis by Application, 2022-2032

Figure 241: South Asia & Pacific Low Voltage Motor Market Y-o-Y Growth (%) Projections by Application, 2022-2032

Figure 242: South Asia & Pacific Low Voltage Motor Market Value (US$ Mn) Analysis by End Use Industry, 2017-2032

Figure 243: South Asia & Pacific Low Voltage Motor Market Volume (000 Units) Analysis by End Use Industry, 2017-2032

Figure 244: South Asia & Pacific Low Voltage Motor Market Value Share (%) and BPS Analysis by End Use Industry, 2022-2032

Figure 245: South Asia & Pacific Low Voltage Motor Market Y-o-Y Growth (%) Projections by End Use Industry, 2022-2032

Figure 246: South Asia & Pacific Low Voltage Motor Market Attractiveness by Product Type, 2022-2032

Figure 247: South Asia & Pacific Low Voltage Motor Market Attractiveness by Voltage Rating, 2022-2032

Figure 248: South Asia & Pacific Low Voltage Motor Market Attractiveness by Standard, 2022-2032

Figure 249: South Asia & Pacific Low Voltage Motor Market Attractiveness by Frame Enclosure, 2022-2032

Figure 250: South Asia & Pacific Low Voltage Motor Market Attractiveness by Application, 2022-2032

Figure 251: South Asia & Pacific Low Voltage Motor Market Attractiveness by End Use Industry, 2022-2032

Figure 252: South Asia & Pacific Low Voltage Motor Market Attractiveness by Country, 2022-2032

Figure 253: MEA Low Voltage Motor Market Value (US$ Mn) by Product Type, 2022-2032

Figure 254: MEA Low Voltage Motor Market Value (US$ Mn) by Voltage Rating, 2022-2032

Figure 255: MEA Low Voltage Motor Market Value (US$ Mn) by Standard, 2022-2032

Figure 256: MEA Low Voltage Motor Market Value (US$ Mn) by Frame Enclosure, 2022-2032

Figure 257: MEA Low Voltage Motor Market Value (US$ Mn) by Application, 2022-2032

Figure 258: MEA Low Voltage Motor Market Value (US$ Mn) by End Use Industry, 2022-2032

Figure 259: MEA Low Voltage Motor Market Value (US$ Mn) by Country, 2022-2032

Figure 260: MEA Low Voltage Motor Market Value (US$ Mn) Analysis by Country, 2017-2032

Figure 261: MEA Low Voltage Motor Market Volume (000 Units) Analysis by Country, 2017-2032

Figure 262: MEA Low Voltage Motor Market Value Share (%) and BPS Analysis by Country, 2022-2032

Figure 263: MEA Low Voltage Motor Market Y-o-Y Growth (%) Projections by Country, 2022-2032

Figure 264: MEA Low Voltage Motor Market Value (US$ Mn) Analysis by Product Type, 2017-2032

Figure 265: MEA Low Voltage Motor Market Volume (000 Units) Analysis by Product Type, 2017-2032

Figure 266: MEA Low Voltage Motor Market Value Share (%) and BPS Analysis by Product Type, 2022-2032

Figure 267: MEA Low Voltage Motor Market Y-o-Y Growth (%) Projections by Product Type, 2022-2032

Figure 268: MEA Low Voltage Motor Market Value (US$ Mn) Analysis by Voltage Rating, 2017-2032

Figure 269: MEA Low Voltage Motor Market Volume (000 Units) Analysis by Voltage Rating, 2017-2032

Figure 270: MEA Low Voltage Motor Market Value Share (%) and BPS Analysis by Voltage Rating, 2022-2032

Figure 271: MEA Low Voltage Motor Market Y-o-Y Growth (%) Projections by Voltage Rating, 2022-2032

Figure 272: MEA Low Voltage Motor Market Value (US$ Mn) Analysis by Standard, 2017-2032

Figure 273: MEA Low Voltage Motor Market Volume (000 Units) Analysis by Standard, 2017-2032

Figure 274: MEA Low Voltage Motor Market Value Share (%) and BPS Analysis by Standard, 2022-2032

Figure 275: MEA Low Voltage Motor Market Y-o-Y Growth (%) Projections by Standard, 2022-2032

Figure 276: MEA Low Voltage Motor Market Value (US$ Mn) Analysis by Frame Enclosure, 2017-2032

Figure 277: MEA Low Voltage Motor Market Volume (000 Units) Analysis by Frame Enclosure, 2017-2032

Figure 278: MEA Low Voltage Motor Market Value Share (%) and BPS Analysis by Frame Enclosure, 2022-2032

Figure 279: MEA Low Voltage Motor Market Y-o-Y Growth (%) Projections by Frame Enclosure, 2022-2032

Figure 280: MEA Low Voltage Motor Market Value (US$ Mn) Analysis by Application, 2017-2032

Figure 281: MEA Low Voltage Motor Market Volume (000 Units) Analysis by Application, 2017-2032

Figure 282: MEA Low Voltage Motor Market Value Share (%) and BPS Analysis by Application, 2022-2032

Figure 283: MEA Low Voltage Motor Market Y-o-Y Growth (%) Projections by Application, 2022-2032

Figure 284: MEA Low Voltage Motor Market Value (US$ Mn) Analysis by End Use Industry, 2017-2032

Figure 285: MEA Low Voltage Motor Market Volume (000 Units) Analysis by End Use Industry, 2017-2032

Figure 286: MEA Low Voltage Motor Market Value Share (%) and BPS Analysis by End Use Industry, 2022-2032

Figure 287: MEA Low Voltage Motor Market Y-o-Y Growth (%) Projections by End Use Industry, 2022-2032

Figure 288: MEA Low Voltage Motor Market Attractiveness by Product Type, 2022-2032

Figure 289: MEA Low Voltage Motor Market Attractiveness by Voltage Rating, 2022-2032

Figure 290: MEA Low Voltage Motor Market Attractiveness by Standard, 2022-2032

Figure 291: MEA Low Voltage Motor Market Attractiveness by Frame Enclosure, 2022-2032

Figure 292: MEA Low Voltage Motor Market Attractiveness by Application, 2022-2032

Figure 293: MEA Low Voltage Motor Market Attractiveness by End Use Industry, 2022-2032

Figure 294: MEA Low Voltage Motor Market Attractiveness by Country, 2022-203

Frequently Asked Questions

What was the overall size of the Low Voltage Motor Market in 2025?

The overall market size for the Low Voltage Motor Market was USD 43,272.1 Million in 2025.

How big is the Low Voltage Motor Market expected to be in 2035?

The Low Voltage Motor Market is expected to reach USD 68,497.5 Million in 2035.

What will drive the demand for the Low Voltage Motor Market during the forecast period?

The demand is driven by increasing adoption of industrial automation, stringent energy efficiency regulations, growing deployment in electric vehicles, and rising applications in HVAC systems and home appliances.

List the top 5 countries contributing to the Low Voltage Motor Market.

The top 5 countries driving market growth are the USA, UK, Europe, Japan, and South Korea.

Which segment in Product Type is expected to lead in the Low Voltage Motor Market?

The IE3 Low-Voltage Motors segment is expected to command a significant share over the assessment period.

Explore Similar Insights

Future Market Insights

Low Voltage Motor Market