Medium Density Fiberboard Market Size and Share Forecast Outlook 2025 to 2035

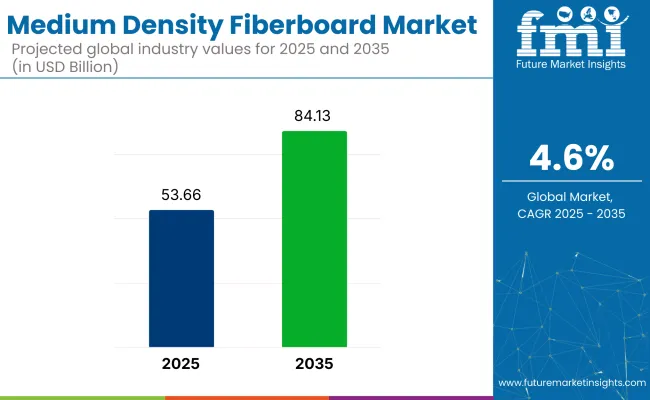
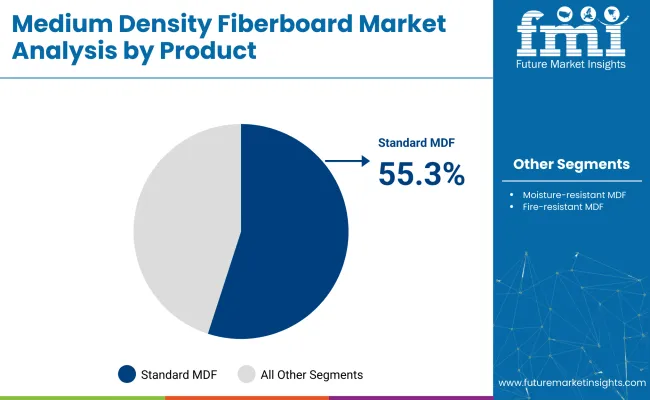
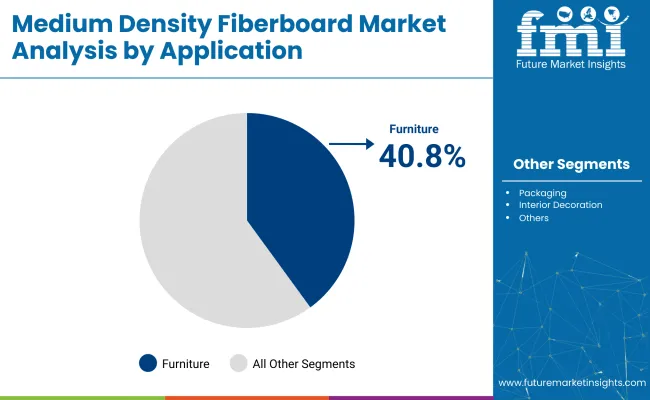
The medium density fiberboard (MDF) market is expected to register a valuation of USD 53.66 billion in 2025 and grow to USD 84.13 billion by 2035, accelerating at a CAGR of 4.6%. Standard MDF will dominate the product segment with a 55.3% share in 2025, while furniture applications will continue to lead the application segment with a 40.8% share of total demand.
Medium Density Fiberboard (MDF) Market Quick Stats

  • Medium Density Fiberboard Market Value (2025): USD 53.66 billion
  • Forecast Value (2035): USD 84.13 billion
  • Forecast CAGR (2025 to 2035): 4.6%
  • Leading Segment in 2035: Standard MDF (~55.3% share)
  • Key Growth Region: Asia Pacific (India)
  • Key Players: ARAUCO, Century Plyboards, Dare Panel Group, Dongwha Malaysia Holdings, Egger Group

Medium Density Fiberboard Market

As highlighted in a BBC-published overview on manufactured boards, medium-density fiberboard is produced using timber waste and adhesives, offering a smooth, light-brown surface that is easy to finish. These physical and working properties make MDF highly suitable for general carpentry and flat-pack furniture, although its moisture absorption characteristics limit its use in outdoor environments. This versatility in indoor applications significantly contributes to MDF’s widespread adoption across both residential and commercial sectors.

Key factors contributing to this growth include rising construction activities, particularly in the residential and commercial sectors, as well as a growing preference for sustainable and eco-friendly building materials. The ever-increasing demand for furniture, especially from emerging economies, and innovations in moisture-resistant and fire-resistant MDF products are also fueling market expansion.

By 2025, the standard medium-density fiberboard market is expected to hold a 55.3% market share, with furniture applications accounting for 40.8% of the total demand. The medium-priced MDF product market will be dominated by products within a price range of 40.2%, with offline distribution channels leading at 68.2%.

In regions such as the Asia-Pacific, particularly China and India, rapid urbanization and infrastructure development are expected to accelerate MDF demand further. Additionally, North America and Europe will continue to be major markets, driven by growing investments in renovation and construction projects that prioritize sustainable and durable materials.

Analyzing Medium Density Fiberboard Market by Top Investment Segments

The medium density fiberboard (MDF) market is witnessing steady growth, driven by demand from key applications in furniture, construction, and packaging. The market is segmented into product types, applications, price ranges, and distribution channels, with notable market shares across these categories.

Standard Medium Density Fiberboard Market Leads the Product Segment in 2025

Standard medium density fiberboard will dominate the product segment in 2025, accounting for 55.3% share of the global medium density fiberboard market.
  • The preference for standard MDF is driven by its versatility and ease of processing, making it an ideal material for furniture and interior decoration applications. Manufacturers such as Georgia-Pacific and Evergreen Fiberboard are focusing on improving product density and smoothness.
  • Its affordability and widespread availability make standard MDF popular in low- to medium-priced product ranges, supporting its continued dominance as demand rises from the residential and commercial sectors.

Medium Density Fiberboard Market Analysis By Product

Furniture Application Drives Demand for MDF in 2025

Furniture applications are expected to capture a significant portion of the MDF market in 2025, holding a 40.8% share.
  • The demand for cost-effective, sustainable, and durable materials in the furniture sector is propelling the use of MDF in products such as cabinets, tables, and decorative panels. Companies like Greenply Industries and Kastamonu Entegre are innovating MDF grades with improved moisture and wear resistance.
  • Growing urbanization and middle-class expansion, especially across the Asia-Pacific region, are fueling the need for affordable yet high-quality furniture, solidifying MDF’s position as a preferred material.

Medium Density Fiberboard Market Analysis By Application

Medium-Priced MDF Expected to Remain Dominant in 2025

Medium-priced medium-density fiberboard is projected to remain the dominant price segment in 2025, accounting for an estimated 60% of the global MDF market.

  • Medium-priced MDF strikes a balance between affordability and quality, making it the preferred choice for both residential and commercial buyers. Manufacturers like Kronospan and Unilin are expanding offerings in this segment to meet rising demand.
  • Its suitability for middle-income consumers and small-scale manufacturers ensures stable demand, especially as global construction and renovation activities increase.

Offline Distribution Channel to Lead in 2025

Offline distribution channels are set to continue leading the MDF market in 2025, with an estimated 85% share of the total market.

  • The dominance of offline channels is supported by strong manufacturer-distributor partnerships that enable bulk purchasing and in-person product inspection, critical for large-scale furniture and construction projects.
  • Companies like ARAUCO and Dongwha Malaysia are strengthening their retail and wholesale networks, ensuring customers can access MDF products directly through physical stores despite the growth of online sales channels.

Top Medium Density Fiberboard Market Dynamics

The medium density fiberboard market is experiencing growth due to rising demand in furniture, construction, and sustainable packaging applications. However, challenges related to price fluctuations in raw materials and environmental concerns are presenting barriers to further expansion.

Rising demand for sustainable building materials is driving market growth.

The increasing demand for sustainable, eco-friendly materials in construction and furniture is accelerating the adoption of medium-density fiberboard. Companies are focusing on improving the environmental profile of their products through innovations in low-emission, formaldehyde-free MDF, further bolstering market growth. With governments and consumers prioritizing green construction, MDF’s role in eco-friendly building practices is becoming more significant, especially in developed markets like North America and Europe.

Raw material price volatility posing a challenge to manufacturers.

Fluctuating prices of wood pulp and fiber, essential components of MDF, are impacting market stability. The volatility in raw material costs is affecting manufacturers’ ability to maintain consistent pricing, pushing up production costs. As the medium density fiberboard market is primarily derived from wood-based resources, any changes in raw material prices due to supply chain disruptions or policy changes can significantly affect overall market profitability, especially in price-sensitive regions.

Analyzing Top Countries Manufacturing, Distributing, and Supplying Medium Density Fiberboard

The medium density fiberboard market is driven by increasing demand for construction and furniture in both developed and emerging economies. The United States, China, India, the United Kingdom, and Brazil are major contributors to the market growth.

Countries CAGR (2025 to 2035)
United States 5.8%
United Kingdom 5.4%
China 7.1%
India 8.2%
Brazil 6.7%

An Overview of MDF Industry Growth and Trends in the United States

The medium density fiberboard sector in the U.S. is projected to grow at a CAGR of 5.8% from 2025 to 2035, fueled by steady demand in housing construction, home renovations, and the shift toward eco-conscious furniture manufacturing. Government initiatives promoting green buildings are further reinforcing market momentum.

Surging interest in sustainable materials, coupled with ongoing residential development and remodeling, is driving demand. Key manufacturers, such as Georgia-Pacific and West Fraser Timber, are increasing their production capacity to meet the growing needs. The push for sustainable practices in the construction and furniture sectors remains a significant growth catalyst.

Sales and Application Trends of MDF Products in the United Kingdom

The UK is witnessing a 5.4% CAGR in MDF-related products over the forecast period, driven by the rising adoption of moisture-resistant packaging and sustainable materials. Strict environmental policies and national low-carbon building initiatives are playing a crucial role.

The growing demand for eco-friendly interior décor and the increasing use of fire- and moisture-resistant boards in furniture and flooring are boosting sales. Leading players, such as the Egger Group, are investing in greener manufacturing processes to align with evolving regulations and consumer preferences.

China’s Medium Density Fiberboard Industry Outlook and Forecast (2025–2035)

In China, the MDF market is projected to grow at a robust 7.1% CAGR through 2035, driven by rapid urbanization and strong government support for affordable housing. The expanding domestic furniture industry also makes a significant contribution to growth.

With infrastructure development accelerating, MDF continues to gain popularity for its durability and cost-efficiency. Companies such as Dongwha Malaysia Holdings and Kronospan are expanding their operations to capitalize on the rising demand across the region.

India’s Evolving MDF Landscape: Trends and Opportunities

India is poised to record the highest growth rate, with the MDF segment expected to grow at a CAGR of 8.2% over the next decade. Urban expansion, increased housing activity, and a booming middle-class population are major drivers.

Affordable furniture and decorative solutions are in high demand, prompting domestic firms like Greenply Industries to invest in production capacity. The growing emphasis on modern interiors and smart city projects is also generating new opportunities for MDF applications in flooring, wall panels, and cabinetry.

Key Growth Drivers for MDF Use in Brazil

Brazil’s medium density fiberboard industry is on track for a 6.7% CAGR between 2025 and 2035, supported by government-led infrastructure programs and affordable housing development. The rising demand for durable, cost-effective materials in the local furniture sector is another key factor.

Manufacturers such as TRENOX Laminates are increasing output to meet domestic and regional needs. With MDF becoming a preferred choice in both residential and commercial construction, the country is experiencing steady upward demand across applications.

Leading Suppliers in the Medium Density Fiberboard Market

The MDF market is shaped by the strategies of dominant players, key players, and emerging players across global and regional landscapes. Dominant players such as ARAUCO, Century Plyboards, and Egger Group lead the market with extensive production capabilities and continuous innovation in moisture-resistant and fire-resistant MDF products.

Key players, such as Greenply Industries and Kastamonu Entegre, are expanding their footprint in emerging markets by offering cost-effective and high-quality MDF solutions tailored to local demands. Meanwhile, emerging players are entering the market by leveraging niche applications, competitive pricing, and regional distribution advantages.

Across all tiers, companies are focusing on R&D investments, sustainable product development, regulatory compliance, and technological advancements to expand product portfolios and optimize distribution networks.

Recent Industry News

  • Homanit to Invest USD 250 Million in First USA MDF Manufacturing Facility. In May 2025, Homanit, a leading German manufacturer of medium- and high-density fiberboards, announced plans to invest $250 million in establishing its first manufacturing facility in the United States. The greenfield plant will be located in Alcolu, South Carolina, and is scheduled to become operational by 2028.
  • Homanit’s South Carolina Plant to Create 300 Jobs and Serve Multiple Industries. The upcoming Homanit facility in South Carolina is expected to create 300 new jobs and cater to various industries, including furniture, automotive components, doors, and industrial coatings. This project marks the largest forest products manufacturing investment in the state in over three years and the most significant economic development initiative in Clarendon County in two decades.

Key Medium Density Fiberboard Market Players

  • ARAUCO
  • Century Plyboards
  • Dare Panel Group
  • Dongwha Malaysia Holdings
  • Egger Group
  • Evergreen Fiberboard
  • Georgia-Pacific
  • Greenply Industries
  • KastamonuEntegre
  • Kronospan
  • Nag Hamady Fiber Board
  • Norbord
  • TRENOX Laminates
  • Unilin
  • West Fraser Timber

Report Scope of the Medium Density Fiberboard Market

Report Attributes Details
Current Total Market Size (2025) USD 53.66 billion
Projected Market Size (2035) USD 84.13 billion
CAGR (2025 to 2035) 4.6%
Base Year for Estimation 2024
Historical Period 2020 to 2024
Projections Period 2025 to 2035
Quantitative Units USD billion for value and million cubic meters for volume
Product Types Analyzed (Segment 1) Standard MDF, Moisture Resistant MDF, Fire Resistant MDF
Application Segmentation (Segment 2) Packaging, Construction & Flooring, Interior Decoration, Furniture, Others
Price Range Segmentation (Segment 3) Low, Medium, High
Distribution Channel Segmentation (Segment 4) Online, Offline
Regions Covered North America, Latin America, Europe, Asia-Pacific, Middle East & Africa
Countries Covered United States, Canada, Mexico, Brazil, Argentina, Germany, France, United Kingdom, Italy, Spain, Netherlands, China, India, Japan, South Korea, Australia, New Zealand, GCC Countries, South Africa
Key Players Influencing the Market ARAUCO, Century Plyboards, Dare Panel Group, Dongwha Malaysia Holdings, Egger Group, Evergreen Fiberboard, Georgia-Pacific, Greenply Industries, Kastamonu Entegre, Kronospan, Nag Hamady Fiber Board, Norbord, TRENOX Laminates, Unilin, West Fraser Timber
Additional Attributes Dollar sales by product type, application, and price range, increasing demand for eco-friendly materials, trends in the construction and furniture packaging industries, rise in online sales channels, and regional variations in MDF demand driven by construction activities.

Key Segments

By Product:

The market is segmented into Standard MDF, Moisture-resistant MDF, and Fire-resistant MDF.

By Application:

The market is segmented into Packaging, Construction & Flooring, Interior Decoration, Furniture, and Others.

By Price Range:

The market is segmented into Low, Medium, and High.

By Distribution Channel:

The market is segmented into Online and Offline.

By Region:

The market is segmented into North America, Latin America, Europe, Asia-Pacific, and Middle East & Africa.

Table of Content

  1. Executive Summary
  2. Market Overview
  3. Market Background
  4. Global Market Analysis 2020 to 2024 and Forecast, 2025 to 2035
  5. Global Market Pricing Analysis 2020 to 2024 and Forecast 2025 to 2035
  6. Global Market Analysis 2020 to 2024 and Forecast 2025 to 2035, By Product
    • Standard MDF
    • Moisture-resistant MDF
    • Fire-resistant MDF
  7. Global Market Analysis 2020 to 2024 and Forecast 2025 to 2035, By Application
    • Packaging
    • Construction & Flooring
    • Interior Decoration
    • Furniture
    • Others
  8. Global Market Analysis 2020 to 2024 and Forecast 2025 to 2035, By Price Range
    • Low
    • Medium
    • High
  9. Global Market Analysis 2020 to 2024 and Forecast 2025 to 2035, By Distribution Channel
    • Online
    • Offline
  10. Global Market Analysis 2020 to 2024 and Forecast 2025 to 2035, By Region
    • North America
    • Latin America
    • Western Europe
    • Eastern Europe
    • East Asia
    • South Asia & Pacific
    • Middle East and Africa
  11. North America Market Analysis 2020 to 2024 and Forecast 2025 to 2035, By Country
  12. Latin America Market Analysis 2020 to 2024 and Forecast 2025 to 2035, By Country
  13. Western Europe Market Analysis 2020 to 2024 and Forecast 2025 to 2035, By Country
  14. Eastern Europe Market Analysis 2020 to 2024 and Forecast 2025 to 2035, By Country
  15. East Asia Market Analysis 2020 to 2024 and Forecast 2025 to 2035, By Country
  16. South Asia & Pacific Market Analysis 2020 to 2024 and Forecast 2025 to 2035, By Country
  17. Middle East and Africa Market Analysis 2020 to 2024 and Forecast 2025 to 2035, By Country
  18. Key Countries Market Analysis
  19. Market Structure Analysis
  20. Competition Analysis
    • ARAUCO
    • Century Plyboards
    • Dare Panel Group
    • Dongwha Malaysia Holdings
    • Egger Group
    • Evergreen Fiberboard
    • Georgia-Pacific
    • Greenply Industries
    • Kastamonu Entegre
    • Kronospan
    • Nag Hamady Fiber Board
    • Norbord
    • TRENOX Laminates
    • Unilin
    • West Fraser Timber
  21. Assumptions & Acronyms Used
  22. Research Methodology

List of Tables

  • Table 1: Global Market Value (USD Billion) Forecast by Region, 2020 to 2035
  • Table 2: Global Market Volume (cubic meters) Forecast by Region, 2020 to 2035
  • Table 3: Global Market Value (USD Billion) Forecast by Product, 2020 to 2035
  • Table 4: Global Market Volume (cubic meters) Forecast by Product, 2020 to 2035
  • Table 5: Global Market Value (USD Billion) Forecast by Application, 2020 to 2035
  • Table 6: Global Market Volume (cubic meters) Forecast by Application, 2020 to 2035
  • Table 7: Global Market Value (USD Billion) Forecast by Price Range, 2020 to 2035
  • Table 8: Global Market Volume (cubic meters) Forecast by Price Range, 2020 to 2035
  • Table 9: Global Market Value (USD Billion) Forecast by Distribution Channel, 2020 to 2035
  • Table 10: Global Market Volume (cubic meters) Forecast by Distribution Channel, 2020 to 2035
  • Table 11: North America Market Value (USD Billion) Forecast by Country, 2020 to 2035
  • Table 12: North America Market Volume (cubic meters) Forecast by Country, 2020 to 2035
  • Table 13: North America Market Value (USD Billion) Forecast by Product, 2020 to 2035
  • Table 14: North America Market Volume (cubic meters) Forecast by Product, 2020 to 2035
  • Table 15: North America Market Value (USD Billion) Forecast by Application, 2020 to 2035
  • Table 16: North America Market Volume (cubic meters) Forecast by Application, 2020 to 2035
  • Table 17: North America Market Value (USD Billion) Forecast by Price Range, 2020 to 2035
  • Table 18: North America Market Volume (cubic meters) Forecast by Price Range, 2020 to 2035
  • Table 19: North America Market Value (USD Billion) Forecast by Distribution Channel, 2020 to 2035
  • Table 20: North America Market Volume (cubic meters) Forecast by Distribution Channel, 2020 to 2035
  • Table 21: Latin America Market Value (USD Billion) Forecast by Country, 2020 to 2035
  • Table 22: Latin America Market Volume (cubic meters) Forecast by Country, 2020 to 2035
  • Table 23: Latin America Market Value (USD Billion) Forecast by Product, 2020 to 2035
  • Table 24: Latin America Market Volume (cubic meters) Forecast by Product, 2020 to 2035
  • Table 25: Latin America Market Value (USD Billion) Forecast by Application, 2020 to 2035
  • Table 26: Latin America Market Volume (cubic meters) Forecast by Application, 2020 to 2035
  • Table 27: Latin America Market Value (USD Billion) Forecast by Price Range, 2020 to 2035
  • Table 28: Latin America Market Volume (cubic meters) Forecast by Price Range, 2020 to 2035
  • Table 29: Latin America Market Value (USD Billion) Forecast by Distribution Channel, 2020 to 2035
  • Table 30: Latin America Market Volume (cubic meters) Forecast by Distribution Channel, 2020 to 2035
  • Table 31: Western Europe Market Value (USD Billion) Forecast by Country, 2020 to 2035
  • Table 32: Western Europe Market Volume (cubic meters) Forecast by Country, 2020 to 2035
  • Table 33: Western Europe Market Value (USD Billion) Forecast by Product, 2020 to 2035
  • Table 34: Western Europe Market Volume (cubic meters) Forecast by Product, 2020 to 2035
  • Table 35: Western Europe Market Value (USD Billion) Forecast by Application, 2020 to 2035
  • Table 36: Western Europe Market Volume (cubic meters) Forecast by Application, 2020 to 2035
  • Table 37: Western Europe Market Value (USD Billion) Forecast by Price Range, 2020 to 2035
  • Table 38: Western Europe Market Volume (cubic meters) Forecast by Price Range, 2020 to 2035
  • Table 39: Western Europe Market Value (USD Billion) Forecast by Distribution Channel, 2020 to 2035
  • Table 40: Western Europe Market Volume (cubic meters) Forecast by Distribution Channel, 2020 to 2035
  • Table 41: Eastern Europe Market Value (USD Billion) Forecast by Country, 2020 to 2035
  • Table 42: Eastern Europe Market Volume (cubic meters) Forecast by Country, 2020 to 2035
  • Table 43: Eastern Europe Market Value (USD Billion) Forecast by Product, 2020 to 2035
  • Table 44: Eastern Europe Market Volume (cubic meters) Forecast by Product, 2020 to 2035
  • Table 45: Eastern Europe Market Value (USD Billion) Forecast by Application, 2020 to 2035
  • Table 46: Eastern Europe Market Volume (cubic meters) Forecast by Application, 2020 to 2035
  • Table 47: Eastern Europe Market Value (USD Billion) Forecast by Price Range, 2020 to 2035
  • Table 48: Eastern Europe Market Volume (cubic meters) Forecast by Price Range, 2020 to 2035
  • Table 49: Eastern Europe Market Value (USD Billion) Forecast by Distribution Channel, 2020 to 2035
  • Table 50: Eastern Europe Market Volume (cubic meters) Forecast by Distribution Channel, 2020 to 2035
  • Table 51: East Asia Market Value (USD Billion) Forecast by Country, 2020 to 2035
  • Table 52: East Asia Market Volume (cubic meters) Forecast by Country, 2020 to 2035
  • Table 53: East Asia Market Value (USD Billion) Forecast by Product, 2020 to 2035
  • Table 54: East Asia Market Volume (cubic meters) Forecast by Product, 2020 to 2035
  • Table 55: East Asia Market Value (USD Billion) Forecast by Application, 2020 to 2035
  • Table 56: East Asia Market Volume (cubic meters) Forecast by Application, 2020 to 2035
  • Table 57: East Asia Market Value (USD Billion) Forecast by Price Range, 2020 to 2035
  • Table 58: East Asia Market Volume (cubic meters) Forecast by Price Range, 2020 to 2035
  • Table 59: East Asia Market Value (USD Billion) Forecast by Distribution Channel, 2020 to 2035
  • Table 60: East Asia Market Volume (cubic meters) Forecast by Distribution Channel, 2020 to 2035
  • Table 61: South Asia & Pacific Market Value (USD Billion) Forecast by Country, 2020 to 2035
  • Table 62: South Asia & Pacific Market Volume (cubic meters) Forecast by Country, 2020 to 2035
  • Table 63: South Asia & Pacific Market Value (USD Billion) Forecast by Product, 2020 to 2035
  • Table 64: South Asia & Pacific Market Volume (cubic meters) Forecast by Product, 2020 to 2035
  • Table 65: South Asia & Pacific Market Value (USD Billion) Forecast by Application, 2020 to 2035
  • Table 66: South Asia & Pacific Market Volume (cubic meters) Forecast by Application, 2020 to 2035
  • Table 67: South Asia & Pacific Market Value (USD Billion) Forecast by Price Range, 2020 to 2035
  • Table 68: South Asia & Pacific Market Volume (cubic meters) Forecast by Price Range, 2020 to 2035
  • Table 69: South Asia & Pacific Market Value (USD Billion) Forecast by Distribution Channel, 2020 to 2035
  • Table 70: South Asia & Pacific Market Volume (cubic meters) Forecast by Distribution Channel, 2020 to 2035
  • Table 71: Middle East and Africa Market Value (USD Billion) Forecast by Country, 2020 to 2035
  • Table 72: Middle East and Africa Market Volume (cubic meters) Forecast by Country, 2020 to 2035
  • Table 73: Middle East and Africa Market Value (USD Billion) Forecast by Product, 2020 to 2035
  • Table 74: Middle East and Africa Market Volume (cubic meters) Forecast by Product, 2020 to 2035
  • Table 75: Middle East and Africa Market Value (USD Billion) Forecast by Application, 2020 to 2035
  • Table 76: Middle East and Africa Market Volume (cubic meters) Forecast by Application, 2020 to 2035
  • Table 77: Middle East and Africa Market Value (USD Billion) Forecast by Price Range, 2020 to 2035
  • Table 78: Middle East and Africa Market Volume (cubic meters) Forecast by Price Range, 2020 to 2035
  • Table 79: Middle East and Africa Market Value (USD Billion) Forecast by Distribution Channel, 2020 to 2035
  • Table 80: Middle East and Africa Market Volume (cubic meters) Forecast by Distribution Channel, 2020 to 2035

List of Figures

  • Figure 1: Global Market Volume (cubic meters) Forecast 2020 to 2035
  • Figure 2: Global Market Pricing Analysis
  • Figure 3: Global Market Value (USD Billion) Forecast 2020 to 2035
  • Figure 4: Global Market Value Share and BPS Analysis by Product, 2025 and 2035
  • Figure 5: Global Market Y-o-Y Growth Comparison by Product, 2025 to 2035
  • Figure 6: Global Market Attractiveness Analysis by Product
  • Figure 7: Global Market Value Share and BPS Analysis by Application, 2025 and 2035
  • Figure 8: Global Market Y-o-Y Growth Comparison by Application, 2025 to 2035
  • Figure 9: Global Market Attractiveness Analysis by Application
  • Figure 10: Global Market Value Share and BPS Analysis by Price Range, 2025 and 2035
  • Figure 11: Global Market Y-o-Y Growth Comparison by Price Range, 2025 to 2035
  • Figure 12: Global Market Attractiveness Analysis by Price Range
  • Figure 13: Global Market Value Share and BPS Analysis by Distribution Channel, 2025 and 2035
  • Figure 14: Global Market Y-o-Y Growth Comparison by Distribution Channel, 2025 to 2035
  • Figure 15: Global Market Attractiveness Analysis by Distribution Channel
  • Figure 16: Global Market Value (USD Billion) Share and BPS Analysis by Region, 2025 and 2035
  • Figure 17: Global Market Y-o-Y Growth Comparison by Region, 2025 to 2035
  • Figure 18: Global Market Attractiveness Analysis by Region
  • Figure 19: North America Market Incremental USD Opportunity, 2025 to 2035
  • Figure 20: Latin America Market Incremental USD Opportunity, 2025 to 2035
  • Figure 21: Western Europe Market Incremental USD Opportunity, 2025 to 2035
  • Figure 22: Eastern Europe Market Incremental USD Opportunity, 2025 to 2035
  • Figure 23: East Asia Market Incremental USD Opportunity, 2025 to 2035
  • Figure 24: South Asia & Pacific Market Incremental USD Opportunity, 2025 to 2035
  • Figure 25: Middle East and Africa Market Incremental USD Opportunity, 2025 to 2035
  • Figure 26: North America Market Value Share and BPS Analysis by Country, 2025 and 2035
  • Figure 27: North America Market Value Share and BPS Analysis by Product, 2025 and 2035
  • Figure 28: North America Market Y-o-Y Growth Comparison by Product, 2025 to 2035
  • Figure 29: North America Market Attractiveness Analysis by Product
  • Figure 30: North America Market Value Share and BPS Analysis by Application, 2025 and 2035
  • Figure 31: North America Market Y-o-Y Growth Comparison by Application, 2025 to 2035
  • Figure 32: North America Market Attractiveness Analysis by Application
  • Figure 33: North America Market Value Share and BPS Analysis by Price Range, 2025 and 2035
  • Figure 34: North America Market Y-o-Y Growth Comparison by Price Range, 2025 to 2035
  • Figure 35: North America Market Attractiveness Analysis by Price Range
  • Figure 36: North America Market Value Share and BPS Analysis by Distribution Channel, 2025 and 2035
  • Figure 37: North America Market Y-o-Y Growth Comparison by Distribution Channel, 2025 to 2035
  • Figure 38: North America Market Attractiveness Analysis by Distribution Channel
  • Figure 39: Latin America Market Value Share and BPS Analysis by Country, 2025 and 2035
  • Figure 40: Latin America Market Value Share and BPS Analysis by Product, 2025 and 2035
  • Figure 41: Latin America Market Y-o-Y Growth Comparison by Product, 2025 to 2035
  • Figure 42: Latin America Market Attractiveness Analysis by Product
  • Figure 43: Latin America Market Value Share and BPS Analysis by Application, 2025 and 2035
  • Figure 44: Latin America Market Y-o-Y Growth Comparison by Application, 2025 to 2035
  • Figure 45: Latin America Market Attractiveness Analysis by Application
  • Figure 46: Latin America Market Value Share and BPS Analysis by Price Range, 2025 and 2035
  • Figure 47: Latin America Market Y-o-Y Growth Comparison by Price Range, 2025 to 2035
  • Figure 48: Latin America Market Attractiveness Analysis by Price Range
  • Figure 49: Latin America Market Value Share and BPS Analysis by Distribution Channel, 2025 and 2035
  • Figure 50: Latin America Market Y-o-Y Growth Comparison by Distribution Channel, 2025 to 2035
  • Figure 51: Latin America Market Attractiveness Analysis by Distribution Channel
  • Figure 52: Western Europe Market Value Share and BPS Analysis by Country, 2025 and 2035
  • Figure 53: Western Europe Market Value Share and BPS Analysis by Product, 2025 and 2035
  • Figure 54: Western Europe Market Y-o-Y Growth Comparison by Product, 2025 to 2035
  • Figure 55: Western Europe Market Attractiveness Analysis by Product
  • Figure 56: Western Europe Market Value Share and BPS Analysis by Application, 2025 and 2035
  • Figure 57: Western Europe Market Y-o-Y Growth Comparison by Application, 2025 to 2035
  • Figure 58: Western Europe Market Attractiveness Analysis by Application
  • Figure 59: Western Europe Market Value Share and BPS Analysis by Price Range, 2025 and 2035
  • Figure 60: Western Europe Market Y-o-Y Growth Comparison by Price Range, 2025 to 2035
  • Figure 61: Western Europe Market Attractiveness Analysis by Price Range
  • Figure 62: Western Europe Market Value Share and BPS Analysis by Distribution Channel, 2025 and 2035
  • Figure 63: Western Europe Market Y-o-Y Growth Comparison by Distribution Channel, 2025 to 2035
  • Figure 64: Western Europe Market Attractiveness Analysis by Distribution Channel
  • Figure 65: Eastern Europe Market Value Share and BPS Analysis by Country, 2025 and 2035
  • Figure 66: Eastern Europe Market Value Share and BPS Analysis by Product, 2025 and 2035
  • Figure 67: Eastern Europe Market Y-o-Y Growth Comparison by Product, 2025 to 2035
  • Figure 68: Eastern Europe Market Attractiveness Analysis by Product
  • Figure 69: Eastern Europe Market Value Share and BPS Analysis by Application, 2025 and 2035
  • Figure 70: Eastern Europe Market Y-o-Y Growth Comparison by Application, 2025 to 2035
  • Figure 71: Eastern Europe Market Attractiveness Analysis by Application
  • Figure 72: Eastern Europe Market Value Share and BPS Analysis by Price Range, 2025 and 2035
  • Figure 73: Eastern Europe Market Y-o-Y Growth Comparison by Price Range, 2025 to 2035
  • Figure 74: Eastern Europe Market Attractiveness Analysis by Price Range
  • Figure 75: Eastern Europe Market Value Share and BPS Analysis by Distribution Channel, 2025 and 2035
  • Figure 76: Eastern Europe Market Y-o-Y Growth Comparison by Distribution Channel, 2025 to 2035
  • Figure 77: Eastern Europe Market Attractiveness Analysis by Distribution Channel
  • Figure 78: East Asia Market Value Share and BPS Analysis by Country, 2025 and 2035
  • Figure 79: East Asia Market Value Share and BPS Analysis by Product, 2025 and 2035
  • Figure 80: East Asia Market Y-o-Y Growth Comparison by Product, 2025 to 2035
  • Figure 81: East Asia Market Attractiveness Analysis by Product
  • Figure 82: East Asia Market Value Share and BPS Analysis by Application, 2025 and 2035
  • Figure 83: East Asia Market Y-o-Y Growth Comparison by Application, 2025 to 2035
  • Figure 84: East Asia Market Attractiveness Analysis by Application
  • Figure 85: East Asia Market Value Share and BPS Analysis by Price Range, 2025 and 2035
  • Figure 86: East Asia Market Y-o-Y Growth Comparison by Price Range, 2025 to 2035
  • Figure 87: East Asia Market Attractiveness Analysis by Price Range
  • Figure 88: East Asia Market Value Share and BPS Analysis by Distribution Channel, 2025 and 2035
  • Figure 89: East Asia Market Y-o-Y Growth Comparison by Distribution Channel, 2025 to 2035
  • Figure 90: East Asia Market Attractiveness Analysis by Distribution Channel
  • Figure 91: South Asia & Pacific Market Value Share and BPS Analysis by Country, 2025 and 2035
  • Figure 92: South Asia & Pacific Market Value Share and BPS Analysis by Product, 2025 and 2035
  • Figure 93: South Asia & Pacific Market Y-o-Y Growth Comparison by Product, 2025 to 2035
  • Figure 94: South Asia & Pacific Market Attractiveness Analysis by Product
  • Figure 95: South Asia & Pacific Market Value Share and BPS Analysis by Application, 2025 and 2035
  • Figure 96: South Asia & Pacific Market Y-o-Y Growth Comparison by Application, 2025 to 2035
  • Figure 97: South Asia & Pacific Market Attractiveness Analysis by Application
  • Figure 98: South Asia & Pacific Market Value Share and BPS Analysis by Price Range, 2025 and 2035
  • Figure 99: South Asia & Pacific Market Y-o-Y Growth Comparison by Price Range, 2025 to 2035
  • Figure 100: South Asia & Pacific Market Attractiveness Analysis by Price Range
  • Figure 101: South Asia & Pacific Market Value Share and BPS Analysis by Distribution Channel, 2025 and 2035
  • Figure 102: South Asia & Pacific Market Y-o-Y Growth Comparison by Distribution Channel, 2025 to 2035
  • Figure 103: South Asia & Pacific Market Attractiveness Analysis by Distribution Channel
  • Figure 104: Middle East and Africa Market Value Share and BPS Analysis by Country, 2025 and 2035
  • Figure 105: Middle East and Africa Market Value Share and BPS Analysis by Product, 2025 and 2035
  • Figure 106: Middle East and Africa Market Y-o-Y Growth Comparison by Product, 2025 to 2035
  • Figure 107: Middle East and Africa Market Attractiveness Analysis by Product
  • Figure 108: Middle East and Africa Market Value Share and BPS Analysis by Application, 2025 and 2035
  • Figure 109: Middle East and Africa Market Y-o-Y Growth Comparison by Application, 2025 to 2035
  • Figure 110: Middle East and Africa Market Attractiveness Analysis by Application
  • Figure 111: Middle East and Africa Market Value Share and BPS Analysis by Price Range, 2025 and 2035
  • Figure 112: Middle East and Africa Market Y-o-Y Growth Comparison by Price Range, 2025 to 2035
  • Figure 113: Middle East and Africa Market Attractiveness Analysis by Price Range
  • Figure 114: Middle East and Africa Market Value Share and BPS Analysis by Distribution Channel, 2025 and 2035
  • Figure 115: Middle East and Africa Market Y-o-Y Growth Comparison by Distribution Channel, 2025 to 2035
  • Figure 116: Middle East and Africa Market Attractiveness Analysis by Distribution Channel
  • Figure 117: Global Market - Tier Structure Analysis
  • Figure 118: Global Market - Company Share Analysis

Frequently Asked Questions

What is the projected market size of the MDF industry by 2035?

The global medium density fiberboard market is projected to reach USD 84.13 billion by 2035.

What is the estimated size of the MDF market in 2025?

The market is expected to be valued at USD 53.66 billion in 2025.

Which product segment is expected to lead the medium density fiberboard market?

Standard MDF is expected to lead the product segment in 2025, with 55.3% market share.

Which application is the largest for medium density fiberboard market?

Furniture applications are expected to capture the largest demand for MDF, accounting for the 40.8% market share in 2025.

Which countries are expected to show strong growth in the MDF market?

India, China, and Brazil are expected to exhibit strong growth, with respective CAGRs of 8.2%, 7.1%, and 6.7%.

Explore General & Advanced Materials Insights

Future Market Insights

Medium Density Fiberboard Market