Transformer Monitoring System Market Outlook for 2024 to 2034

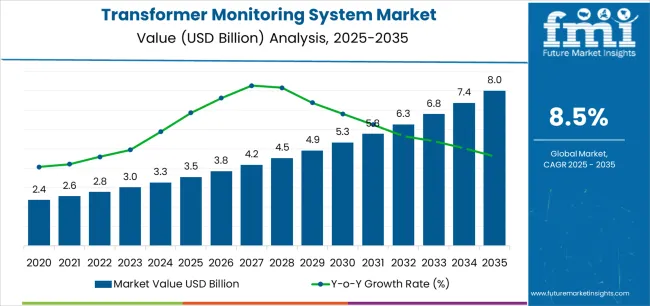
The transformer monitoring system market valuation is expected to be USD 3,259.70 million in 2024. Sales of transformer monitoring systems are proficient to attain the worth and strike USD 7,646.39 million by 2034 as these trends gain momentum and become prevalent. This portrays a robust 8.90% CAGR from 2024 to 2034.

Attributes Details
Transformer Monitoring System Market Value for 2024 USD 3,259.70 million
Forecast Market Value for 2034 USD 7,646.39 million
CAGR from 2024 to 2034 8.90%

Catalysts Promoting Transformer Monitoring System Adoption

Global commercial, urban, and industrial sector growth, associated with escalating electricity consumption, supports market expansion. The installation of more capacity for power production is a significant determining factor in the evolving infrastructure construction for distribution and transmission.

The factors, including the requirement for electricity and remarkable capital investments, amplify the demand for electrical transmission infrastructure. Investments in smart grids account for a decent market percentage. The mushrooming adoption of smart grids strengthens the industry to prevent power outages globally. Adopting contemporary communication technologies in smart grids is a major factor in expanding the market.

Attributes Details
Market Value for 2019 USD 2,425.50 million
Historical Market Value for 2023 USD 3,005.60 million
CAGR from 2019 to 2023 4.38%

Category-wise Outlook

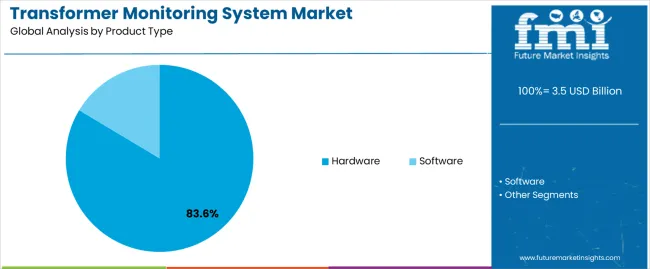
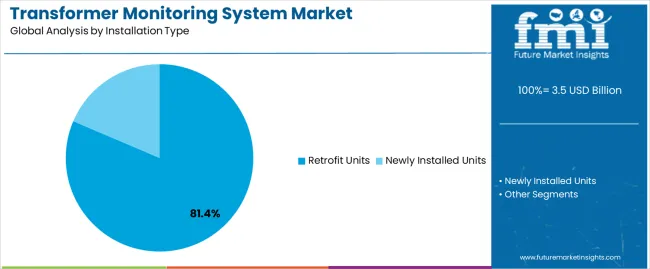
The categorized market analysis of transformer monitoring system is comprised in the ensuing portion. Based on all-inclusive explorations, the hardware segment commands the product type category. Followed by, the retrofit units sector dominating the installation type category.

Hardware Segment is the Supreme Product Type of Transformer Monitoring System Market

Leading Segment Hardware
Market Share (2024) 83.60%

Hardware is preferred by transformer monitoring system manufacturers because it gives them control over the monitoring process and a sense of security. For transformer monitoring system vendors, hardware's capacity to provide accurate, real-time data is essential, given the escalating concentration on grid efficiency and dependability. Hardware components frequently integrate with the current infrastructure effortlessly, causing the least amount of interruption and promising compatibility.

Retrofit Unit Segment is the Dominant Type of Transformer Monitoring System Installations

Leading Segment Retrofit Units
Market Share (2024) 81.40%

Initiatives to enhance a transformer's capacity to handle the ever-evolving energy loads reinforce sales of transformer monitoring systems. The flourishing installation of smart grids and environment-friendly transformers in metropolitan areas is a crucial factor that pushes sales upward. The high energy consumption in the residential and commercial sectors ushers the growth in the retrofit segment.

Country-wise Analysis

The transformer monitoring system industry is examined in the consequent tables, which focus on the dominant regions in North America, Europe, and Asia Pacific. A comprehensive evaluation demonstrates that Asia Pacific has enormous transformer monitoring system market opportunities.

Market Dynamics of Transformer Condition Monitoring in Asia Pacific

Countries CAGR (2024 to 2034)
Japan 10.10%
India 10.00%
China 9.40%
Australia 9.20%
South Korea 8.90%

Japan Power Transformer Monitoring Industry Outlook

The Japanese transformer asset management market has widened due to the increased investments in asset management and grid resilience. In light of this trend, the demand for these systems is intensified in Japan by the surging adoption of smart grid technologies.

Japan leads the way in the implementation of transformer monitoring systems through the merger of renewable energy sources and an emphasis on modernizing infrastructure.

India Transformer Condition Monitoring Market Outlook

Transformer monitoring system adoption is facilitated by government actions like the "Smart Cities Mission" and "Made in India," which spur investments in cutting-edge grid infrastructure. Large-scale renewable energy project implementation opens growth paths for Indian transformer monitoring system suppliers.

China Power Transformer Monitoring Industry Outlook

Rapid industrialization and urbanization prompt the electricity sector growth, which favors transformer monitoring system vendors in China. Government regulations catapult the demand in China to diminish emissions and strengthen energy efficiency.

Australia Transformer Condition Monitoring Market Outlook

The demand in Australia is developed by utilities' adoption of digital transformation efforts. The transformer monitoring system adoption in Australia is due to regulatory requirements for cybersecurity and grid stability.

South Korea Electrical Transformer Monitoring System Market Outlook

The concentration on condition-based monitoring and predictive maintenance quickens the adoption of transformer monitoring systems by South Korean utilities. The transformer monitoring system producers in South Korea benefit from the integration of renewable energy sources and electric vehicle charging infrastructure.

Overview of Electrical Transformer Monitoring System Market in North America

Countries CAGR (2024 to 2034)
United States 8.90%
Canada 7.30%

United States Transformer Health Monitoring Market Outlook

The demand for transformer monitoring systems to regulate the intricacy of decentralized power generation is surging in the United States market due to the broadening integration of renewable energy sources. These are gaining prominence in the United States because of the developing investments in smart grid infrastructure and the digitalization of power networks, which advance asset management and operational efficiency.

Canada Electrical Transformer Monitoring System Market Outlook

Due to its sizeable geography, Canada faces barriers in the distribution of power, leading to the adoption of transformer monitoring systems to control environmental conditions, load variations, and voltage oscillations. Canadian electricity providers are investing in transformer monitoring system adoption to optimize asset performance and ease the integration of renewable energy sources as their efforts to reduce carbon emissions.

Analysis of Power Transformer Monitoring Industry in Europe

Countries CAGR (2024 to 2034)
United Kingdom 9.60%
Spain 9.20%
France 8.50%
Germany 7.90%
Italy 5.60%

United Kingdom Transformer Health Monitoring Market Outlook

The transformer monitoring system providers are using advanced technologies to reduce the risk of equipment failure and downtime owing to the aging power infrastructure in the United Kingdom. There is wide adoption of transformer monitoring systems in the United Kingdom as grid modernization gains significance to improve grid resilience and reliability.

Spain Online Transformer Monitoring Market Outlook

The demand for transformer monitoring systems to facilitate remote monitoring and predictive maintenance is boosted by the energy sector's move to digitalization in Spain. To advance grid resilience and lower the effects of outages, Spain is investing in these systems due to the surged frequency of extreme weather occurrences.

France Transformer Diagnostic System Market Outlook

These are progressively important in France as transportation and heating systems get electrified to manage the booming load and strengthen energy distribution. The adoption is bolstered to ensure adherence and minimize risks during operations because of France's strict laws regarding grid safety.
Competitive Analysis

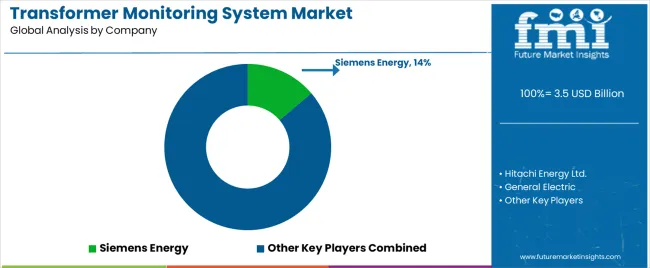
Key transformer monitoring system manufacturers such as Siemens Energy, General Electric, Mitsubishi Electric Corporation, Hitachi Energy Ltd., and Maschinenfabrik Reinhausen GmbH command, boosting invention. The transformer monitoring system vendors lead the technological advancements, influencing the innovation of TMS solutions.

Producers of transformer monitoring systems like Qualitrol Company LLC, Groupe Cahors S.A., and Eaton cater to the competitive outlook, providing distinctive expertise and transformer monitoring system solutions.

The competitive scenario is intensified by MTE Meter Test Equipment AG, CETT Co., Ltd, and other prestigious transformer monitoring system suppliers, each adding their unique contributions to the dynamic environment of TMS solutions. Through continual innovation and partnerships, the manufacturers spur the transformer health monitoring market growth.

As the transformer monitoring system producers continue to traverse improvements in technology, the market is poised for expansion, assuring magnified efficiency and attainment of power infrastructure.

Noticeable Evolutions

Company Details
Siemens Siemens made the acquisition of Senseye to widen its portfolio for innovative predictive maintenance and asset intelligence. Up to 50% less unscheduled machine downtime and up to 30% more productivity from maintenance personnel are possible with the predictive maintenance solution of Senseye.
Schneider Electric EcoStruxure Power Transformer Monitoring solution was introduced by Schneider Electric in the United Kingdom and Ireland to prolong the oil transformers lifespan and diminish downtime.
GANZ Transformers A collaboration agreement in the research and manufacturing of intelligent transformers was sealed in April 2022 by GANZ Transformers and Maschinenfabrik Reinhausen, who teamed up as solution providers.
Hitachi Energy On its mission to "advance a sustainable energy future for all," Hitachi Energy declared the launch of "EconiQ transformers" in October 2021.
Nepal Electricity Authority (NEA) To monitor its substations and large transformers, the Nepal Electricity Authority (NEA) launched in July 2019 that it intented to employ smart transformer monitoring systems. This enabled the authority to obtain substation data regarding voltage, loading, off-pick loading, and pick loading.

Principal Transformer Monitoring System Manufacturers

  • Siemens Energy
  • General Electric
  • Mitsubishi Electric Corporation
  • Hitachi Energy Ltd.
  • Maschinenfabrik Reinhausen GmbH
  • Qualitrol Company LLC
  • Groupe Cahors S.A.
  • Eaton
  • Koncar-Electrical Engineering Institute Inc.
  • Camlin Ltd
  • Advanced Power Technologies LLC
  • MTE Meter Test Equipment AG
  • CETT Co., Ltd.

Key Coverage in Transformer Monitoring System Market Report

  • Adjacent Study on Transformer Diagnostic System Market, Power Device Analyzer Market, and Power Tool Market
  • Japan’s Opportunity to Become a Global Frontrunner in Transformer Monitoring System (TMS)
  • Impact of Online Transformer Monitoring Market in the United Kingdom
  • Trends in the Transformer Monitoring System Market Escalating Sales in the United States
  • Blueprint for Transformer Monitoring System Manufacturers
  • Competitive Analysis of Leading Transformer Monitoring System Providers with Focus on Peptest, EsophyX Z, and Others.

Key Segments

By Product Type:

  • Hardware
    • Direct Winding Transformer Monitors
    • Intelligent Transformer Monitors
  • Software

By Installation Type:

  • Newly Installed Units
  • Retrofit Units

By End Use:

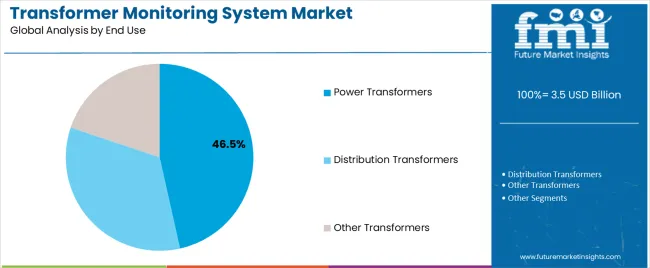
  • Power Transformers
  • Distribution Transformers
  • Other Transformers

By Application:

  • Dissolved Gas Analysis (DGA)
  • Partial Discharge (PD)
  • Bushing Monitoring
  • Cooling Control
  • Voltage Regulation

By Region:

  • North America
  • Latin America
  • Europe
  • East Asia
  • South Asia and Pacific
  • Middle East and Africa

Table of Content

  • 1. Executive Summary
  • 2. Market Overview
  • 3. Market Background
  • 4. Global Market Analysis 2019 to 2023 and Forecast, 2024 to 2034
  • 5. Global Market Analysis 2019 to 2023 and Forecast 2024 to 2034, By Component Type
    • 5.1. Hardware
      • 5.1.1. Direct Winding Transformer Monitors
      • 5.1.2. Intelligent Transformer Monitors
    • 5.2. Software
  • 6. Global Market Analysis 2019 to 2023 and Forecast 2024 to 2034, By Installation Type
    • 6.1. Newly Installed Units
    • 6.2. Retrofit Units
  • 7. Global Market Analysis 2019 to 2023 and Forecast 2024 to 2034, By End
    • 7.1. Power Transformers
    • 7.2. Distribution Transformers
    • 7.3. Other Transformers
  • 8. Global Market Analysis 2019 to 2023 and Forecast 2024 to 2034, By Application
    • 8.1. Dissolved Gas Analysis (DGA)
    • 8.2. Partial Discharge (PD)
    • 8.3. Bushing Monitoring
    • 8.4. Cooling Control
    • 8.5. Voltage Regulation
  • 9. Global Market Analysis 2019 to 2023 and Forecast 2024 to 2034, By Region
    • 9.1. North America
    • 9.2. Latin America
    • 9.3. Western Europe
    • 9.4. Eastern Europe
    • 9.5. South Asia and Pacific
    • 9.6. East Asia
    • 9.7. Middle East and Africa
  • 10. North America Market Analysis 2019 to 2023 and Forecast 2024 to 2034, By Country
  • 11. Latin America Market Analysis 2019 to 2023 and Forecast 2024 to 2034, By Country
  • 12. Western Europe Market Analysis 2019 to 2023 and Forecast 2024 to 2034, By Country
  • 13. Eastern Europe Market Analysis 2019 to 2023 and Forecast 2024 to 2034, By Country
  • 14. South Asia and Pacific Market Analysis 2019 to 2023 and Forecast 2024 to 2034, By Country
  • 15. East Asia Market Analysis 2019 to 2023 and Forecast 2024 to 2034, By Country
  • 16. Middle East and Africa Market Analysis 2019 to 2023 and Forecast 2024 to 2034, By Country
  • 17. Key Countries Market Analysis
  • 18. Market Structure Analysis
  • 19. Competition Analysis
    • 19.1. Siemens Energy
    • 19.2. General Electric
    • 19.3. Mitsubishi Electric Corporation
    • 19.4. Hitachi Energy Ltd.
    • 19.5. Maschinenfabrik Reinhausen GmbH
    • 19.6. Qualitrol Company LLC
    • 19.7. Groupe Cahors S.A.
    • 19.8. Eaton
    • 19.9. Koncar-Electrical Engineering Institute Inc.
    • 19.10. Camlin Ltd
    • 19.11. Advanced Power Technologies LLC
  • 20. Assumptions & Acronyms Used
  • 21. Research Methodology

List of Tables

Table 1: Global Market Value (US$ Million) Forecast by Region, 2019 to 2034

Table 2: Global Market Value (US$ Million) Forecast by Component Type, 2019 to 2034

Table 3: Global Market Value (US$ Million) Forecast by Installation Type, 2019 to 2034

Table 4: Global Market Value (US$ Million) Forecast by End Use, 2019 to 2034

Table 5: Global Market Value (US$ Million) Forecast by Application, 2019 to 2034

Table 6: North America Market Value (US$ Million) Forecast by Country, 2019 to 2034

Table 7: North America Market Value (US$ Million) Forecast by Component Type, 2019 to 2034

Table 8: North America Market Value (US$ Million) Forecast by Installation Type, 2019 to 2034

Table 9: North America Market Value (US$ Million) Forecast by End Use, 2019 to 2034

Table 10: North America Market Value (US$ Million) Forecast by Application, 2019 to 2034

Table 11: Latin America Market Value (US$ Million) Forecast by Country, 2019 to 2034

Table 12: Latin America Market Value (US$ Million) Forecast by Component Type, 2019 to 2034

Table 13: Latin America Market Value (US$ Million) Forecast by Installation Type, 2019 to 2034

Table 14: Latin America Market Value (US$ Million) Forecast by End Use, 2019 to 2034

Table 15: Latin America Market Value (US$ Million) Forecast by Application, 2019 to 2034

Table 16: Western Europe Market Value (US$ Million) Forecast by Country, 2019 to 2034

Table 17: Western Europe Market Value (US$ Million) Forecast by Component Type, 2019 to 2034

Table 18: Western Europe Market Value (US$ Million) Forecast by Installation Type, 2019 to 2034

Table 19: Western Europe Market Value (US$ Million) Forecast by End Use, 2019 to 2034

Table 20: Western Europe Market Value (US$ Million) Forecast by Application, 2019 to 2034

Table 21: Eastern Europe Market Value (US$ Million) Forecast by Country, 2019 to 2034

Table 22: Eastern Europe Market Value (US$ Million) Forecast by Component Type, 2019 to 2034

Table 23: Eastern Europe Market Value (US$ Million) Forecast by Installation Type, 2019 to 2034

Table 24: Eastern Europe Market Value (US$ Million) Forecast by End Use, 2019 to 2034

Table 25: Eastern Europe Market Value (US$ Million) Forecast by Application, 2019 to 2034

Table 26: South Asia and Pacific Market Value (US$ Million) Forecast by Country, 2019 to 2034

Table 27: South Asia and Pacific Market Value (US$ Million) Forecast by Component Type, 2019 to 2034

Table 28: South Asia and Pacific Market Value (US$ Million) Forecast by Installation Type, 2019 to 2034

Table 29: South Asia and Pacific Market Value (US$ Million) Forecast by End Use, 2019 to 2034

Table 30: South Asia and Pacific Market Value (US$ Million) Forecast by Application, 2019 to 2034

Table 31: East Asia Market Value (US$ Million) Forecast by Country, 2019 to 2034

Table 32: East Asia Market Value (US$ Million) Forecast by Component Type, 2019 to 2034

Table 33: East Asia Market Value (US$ Million) Forecast by Installation Type, 2019 to 2034

Table 34: East Asia Market Value (US$ Million) Forecast by End Use, 2019 to 2034

Table 35: East Asia Market Value (US$ Million) Forecast by Application, 2019 to 2034

Table 36: Middle East and Africa Market Value (US$ Million) Forecast by Country, 2019 to 2034

Table 37: Middle East and Africa Market Value (US$ Million) Forecast by Component Type, 2019 to 2034

Table 38: Middle East and Africa Market Value (US$ Million) Forecast by Installation Type, 2019 to 2034

Table 39: Middle East and Africa Market Value (US$ Million) Forecast by End Use, 2019 to 2034

Table 40: Middle East and Africa Market Value (US$ Million) Forecast by Application, 2019 to 2034

List of Figures

Figure 1: Global Market Value (US$ Million) by Component Type, 2024 to 2034

Figure 2: Global Market Value (US$ Million) by Installation Type, 2024 to 2034

Figure 3: Global Market Value (US$ Million) by End Use, 2024 to 2034

Figure 4: Global Market Value (US$ Million) by Application, 2024 to 2034

Figure 5: Global Market Value (US$ Million) by Region, 2024 to 2034

Figure 6: Global Market Value (US$ Million) Analysis by Region, 2019 to 2034

Figure 7: Global Market Value Share (%) and BPS Analysis by Region, 2024 to 2034

Figure 8: Global Market Y-o-Y Growth (%) Projections by Region, 2024 to 2034

Figure 9: Global Market Value (US$ Million) Analysis by Component Type, 2019 to 2034

Figure 10: Global Market Value Share (%) and BPS Analysis by Component Type, 2024 to 2034

Figure 11: Global Market Y-o-Y Growth (%) Projections by Component Type, 2024 to 2034

Figure 12: Global Market Value (US$ Million) Analysis by Installation Type, 2019 to 2034

Figure 13: Global Market Value Share (%) and BPS Analysis by Installation Type, 2024 to 2034

Figure 14: Global Market Y-o-Y Growth (%) Projections by Installation Type, 2024 to 2034

Figure 15: Global Market Value (US$ Million) Analysis by End Use, 2019 to 2034

Figure 16: Global Market Value Share (%) and BPS Analysis by End Use, 2024 to 2034

Figure 17: Global Market Y-o-Y Growth (%) Projections by End Use, 2024 to 2034

Figure 18: Global Market Value (US$ Million) Analysis by Application, 2019 to 2034

Figure 19: Global Market Value Share (%) and BPS Analysis by Application, 2024 to 2034

Figure 20: Global Market Y-o-Y Growth (%) Projections by Application, 2024 to 2034

Figure 21: Global Market Attractiveness by Component Type, 2024 to 2034

Figure 22: Global Market Attractiveness by Installation Type, 2024 to 2034

Figure 23: Global Market Attractiveness by End Use, 2024 to 2034

Figure 24: Global Market Attractiveness by Application, 2024 to 2034

Figure 25: Global Market Attractiveness by Region, 2024 to 2034

Figure 26: North America Market Value (US$ Million) by Component Type, 2024 to 2034

Figure 27: North America Market Value (US$ Million) by Installation Type, 2024 to 2034

Figure 28: North America Market Value (US$ Million) by End Use, 2024 to 2034

Figure 29: North America Market Value (US$ Million) by Application, 2024 to 2034

Figure 30: North America Market Value (US$ Million) by Country, 2024 to 2034

Figure 31: North America Market Value (US$ Million) Analysis by Country, 2019 to 2034

Figure 32: North America Market Value Share (%) and BPS Analysis by Country, 2024 to 2034

Figure 33: North America Market Y-o-Y Growth (%) Projections by Country, 2024 to 2034

Figure 34: North America Market Value (US$ Million) Analysis by Component Type, 2019 to 2034

Figure 35: North America Market Value Share (%) and BPS Analysis by Component Type, 2024 to 2034

Figure 36: North America Market Y-o-Y Growth (%) Projections by Component Type, 2024 to 2034

Figure 37: North America Market Value (US$ Million) Analysis by Installation Type, 2019 to 2034

Figure 38: North America Market Value Share (%) and BPS Analysis by Installation Type, 2024 to 2034

Figure 39: North America Market Y-o-Y Growth (%) Projections by Installation Type, 2024 to 2034

Figure 40: North America Market Value (US$ Million) Analysis by End Use, 2019 to 2034

Figure 41: North America Market Value Share (%) and BPS Analysis by End Use, 2024 to 2034

Figure 42: North America Market Y-o-Y Growth (%) Projections by End Use, 2024 to 2034

Figure 43: North America Market Value (US$ Million) Analysis by Application, 2019 to 2034

Figure 44: North America Market Value Share (%) and BPS Analysis by Application, 2024 to 2034

Figure 45: North America Market Y-o-Y Growth (%) Projections by Application, 2024 to 2034

Figure 46: North America Market Attractiveness by Component Type, 2024 to 2034

Figure 47: North America Market Attractiveness by Installation Type, 2024 to 2034

Figure 48: North America Market Attractiveness by End Use, 2024 to 2034

Figure 49: North America Market Attractiveness by Application, 2024 to 2034

Figure 50: North America Market Attractiveness by Country, 2024 to 2034

Figure 51: Latin America Market Value (US$ Million) by Component Type, 2024 to 2034

Figure 52: Latin America Market Value (US$ Million) by Installation Type, 2024 to 2034

Figure 53: Latin America Market Value (US$ Million) by End Use, 2024 to 2034

Figure 54: Latin America Market Value (US$ Million) by Application, 2024 to 2034

Figure 55: Latin America Market Value (US$ Million) by Country, 2024 to 2034

Figure 56: Latin America Market Value (US$ Million) Analysis by Country, 2019 to 2034

Figure 57: Latin America Market Value Share (%) and BPS Analysis by Country, 2024 to 2034

Figure 58: Latin America Market Y-o-Y Growth (%) Projections by Country, 2024 to 2034

Figure 59: Latin America Market Value (US$ Million) Analysis by Component Type, 2019 to 2034

Figure 60: Latin America Market Value Share (%) and BPS Analysis by Component Type, 2024 to 2034

Figure 61: Latin America Market Y-o-Y Growth (%) Projections by Component Type, 2024 to 2034

Figure 62: Latin America Market Value (US$ Million) Analysis by Installation Type, 2019 to 2034

Figure 63: Latin America Market Value Share (%) and BPS Analysis by Installation Type, 2024 to 2034

Figure 64: Latin America Market Y-o-Y Growth (%) Projections by Installation Type, 2024 to 2034

Figure 65: Latin America Market Value (US$ Million) Analysis by End Use, 2019 to 2034

Figure 66: Latin America Market Value Share (%) and BPS Analysis by End Use, 2024 to 2034

Figure 67: Latin America Market Y-o-Y Growth (%) Projections by End Use, 2024 to 2034

Figure 68: Latin America Market Value (US$ Million) Analysis by Application, 2019 to 2034

Figure 69: Latin America Market Value Share (%) and BPS Analysis by Application, 2024 to 2034

Figure 70: Latin America Market Y-o-Y Growth (%) Projections by Application, 2024 to 2034

Figure 71: Latin America Market Attractiveness by Component Type, 2024 to 2034

Figure 72: Latin America Market Attractiveness by Installation Type, 2024 to 2034

Figure 73: Latin America Market Attractiveness by End Use, 2024 to 2034

Figure 74: Latin America Market Attractiveness by Application, 2024 to 2034

Figure 75: Latin America Market Attractiveness by Country, 2024 to 2034

Figure 76: Western Europe Market Value (US$ Million) by Component Type, 2024 to 2034

Figure 77: Western Europe Market Value (US$ Million) by Installation Type, 2024 to 2034

Figure 78: Western Europe Market Value (US$ Million) by End Use, 2024 to 2034

Figure 79: Western Europe Market Value (US$ Million) by Application, 2024 to 2034

Figure 80: Western Europe Market Value (US$ Million) by Country, 2024 to 2034

Figure 81: Western Europe Market Value (US$ Million) Analysis by Country, 2019 to 2034

Figure 82: Western Europe Market Value Share (%) and BPS Analysis by Country, 2024 to 2034

Figure 83: Western Europe Market Y-o-Y Growth (%) Projections by Country, 2024 to 2034

Figure 84: Western Europe Market Value (US$ Million) Analysis by Component Type, 2019 to 2034

Figure 85: Western Europe Market Value Share (%) and BPS Analysis by Component Type, 2024 to 2034

Figure 86: Western Europe Market Y-o-Y Growth (%) Projections by Component Type, 2024 to 2034

Figure 87: Western Europe Market Value (US$ Million) Analysis by Installation Type, 2019 to 2034

Figure 88: Western Europe Market Value Share (%) and BPS Analysis by Installation Type, 2024 to 2034

Figure 89: Western Europe Market Y-o-Y Growth (%) Projections by Installation Type, 2024 to 2034

Figure 90: Western Europe Market Value (US$ Million) Analysis by End Use, 2019 to 2034

Figure 91: Western Europe Market Value Share (%) and BPS Analysis by End Use, 2024 to 2034

Figure 92: Western Europe Market Y-o-Y Growth (%) Projections by End Use, 2024 to 2034

Figure 93: Western Europe Market Value (US$ Million) Analysis by Application, 2019 to 2034

Figure 94: Western Europe Market Value Share (%) and BPS Analysis by Application, 2024 to 2034

Figure 95: Western Europe Market Y-o-Y Growth (%) Projections by Application, 2024 to 2034

Figure 96: Western Europe Market Attractiveness by Component Type, 2024 to 2034

Figure 97: Western Europe Market Attractiveness by Installation Type, 2024 to 2034

Figure 98: Western Europe Market Attractiveness by End Use, 2024 to 2034

Figure 99: Western Europe Market Attractiveness by Application, 2024 to 2034

Figure 100: Western Europe Market Attractiveness by Country, 2024 to 2034

Figure 101: Eastern Europe Market Value (US$ Million) by Component Type, 2024 to 2034

Figure 102: Eastern Europe Market Value (US$ Million) by Installation Type, 2024 to 2034

Figure 103: Eastern Europe Market Value (US$ Million) by End Use, 2024 to 2034

Figure 104: Eastern Europe Market Value (US$ Million) by Application, 2024 to 2034

Figure 105: Eastern Europe Market Value (US$ Million) by Country, 2024 to 2034

Figure 106: Eastern Europe Market Value (US$ Million) Analysis by Country, 2019 to 2034

Figure 107: Eastern Europe Market Value Share (%) and BPS Analysis by Country, 2024 to 2034

Figure 108: Eastern Europe Market Y-o-Y Growth (%) Projections by Country, 2024 to 2034

Figure 109: Eastern Europe Market Value (US$ Million) Analysis by Component Type, 2019 to 2034

Figure 110: Eastern Europe Market Value Share (%) and BPS Analysis by Component Type, 2024 to 2034

Figure 111: Eastern Europe Market Y-o-Y Growth (%) Projections by Component Type, 2024 to 2034

Figure 112: Eastern Europe Market Value (US$ Million) Analysis by Installation Type, 2019 to 2034

Figure 113: Eastern Europe Market Value Share (%) and BPS Analysis by Installation Type, 2024 to 2034

Figure 114: Eastern Europe Market Y-o-Y Growth (%) Projections by Installation Type, 2024 to 2034

Figure 115: Eastern Europe Market Value (US$ Million) Analysis by End Use, 2019 to 2034

Figure 116: Eastern Europe Market Value Share (%) and BPS Analysis by End Use, 2024 to 2034

Figure 117: Eastern Europe Market Y-o-Y Growth (%) Projections by End Use, 2024 to 2034

Figure 118: Eastern Europe Market Value (US$ Million) Analysis by Application, 2019 to 2034

Figure 119: Eastern Europe Market Value Share (%) and BPS Analysis by Application, 2024 to 2034

Figure 120: Eastern Europe Market Y-o-Y Growth (%) Projections by Application, 2024 to 2034

Figure 121: Eastern Europe Market Attractiveness by Component Type, 2024 to 2034

Figure 122: Eastern Europe Market Attractiveness by Installation Type, 2024 to 2034

Figure 123: Eastern Europe Market Attractiveness by End Use, 2024 to 2034

Figure 124: Eastern Europe Market Attractiveness by Application, 2024 to 2034

Figure 125: Eastern Europe Market Attractiveness by Country, 2024 to 2034

Figure 126: South Asia and Pacific Market Value (US$ Million) by Component Type, 2024 to 2034

Figure 127: South Asia and Pacific Market Value (US$ Million) by Installation Type, 2024 to 2034

Figure 128: South Asia and Pacific Market Value (US$ Million) by End Use, 2024 to 2034

Figure 129: South Asia and Pacific Market Value (US$ Million) by Application, 2024 to 2034

Figure 130: South Asia and Pacific Market Value (US$ Million) by Country, 2024 to 2034

Figure 131: South Asia and Pacific Market Value (US$ Million) Analysis by Country, 2019 to 2034

Figure 132: South Asia and Pacific Market Value Share (%) and BPS Analysis by Country, 2024 to 2034

Figure 133: South Asia and Pacific Market Y-o-Y Growth (%) Projections by Country, 2024 to 2034

Figure 134: South Asia and Pacific Market Value (US$ Million) Analysis by Component Type, 2019 to 2034

Figure 135: South Asia and Pacific Market Value Share (%) and BPS Analysis by Component Type, 2024 to 2034

Figure 136: South Asia and Pacific Market Y-o-Y Growth (%) Projections by Component Type, 2024 to 2034

Figure 137: South Asia and Pacific Market Value (US$ Million) Analysis by Installation Type, 2019 to 2034

Figure 138: South Asia and Pacific Market Value Share (%) and BPS Analysis by Installation Type, 2024 to 2034

Figure 139: South Asia and Pacific Market Y-o-Y Growth (%) Projections by Installation Type, 2024 to 2034

Figure 140: South Asia and Pacific Market Value (US$ Million) Analysis by End Use, 2019 to 2034

Figure 141: South Asia and Pacific Market Value Share (%) and BPS Analysis by End Use, 2024 to 2034

Figure 142: South Asia and Pacific Market Y-o-Y Growth (%) Projections by End Use, 2024 to 2034

Figure 143: South Asia and Pacific Market Value (US$ Million) Analysis by Application, 2019 to 2034

Figure 144: South Asia and Pacific Market Value Share (%) and BPS Analysis by Application, 2024 to 2034

Figure 145: South Asia and Pacific Market Y-o-Y Growth (%) Projections by Application, 2024 to 2034

Figure 146: South Asia and Pacific Market Attractiveness by Component Type, 2024 to 2034

Figure 147: South Asia and Pacific Market Attractiveness by Installation Type, 2024 to 2034

Figure 148: South Asia and Pacific Market Attractiveness by End Use, 2024 to 2034

Figure 149: South Asia and Pacific Market Attractiveness by Application, 2024 to 2034

Figure 150: South Asia and Pacific Market Attractiveness by Country, 2024 to 2034

Figure 151: East Asia Market Value (US$ Million) by Component Type, 2024 to 2034

Figure 152: East Asia Market Value (US$ Million) by Installation Type, 2024 to 2034

Figure 153: East Asia Market Value (US$ Million) by End Use, 2024 to 2034

Figure 154: East Asia Market Value (US$ Million) by Application, 2024 to 2034

Figure 155: East Asia Market Value (US$ Million) by Country, 2024 to 2034

Figure 156: East Asia Market Value (US$ Million) Analysis by Country, 2019 to 2034

Figure 157: East Asia Market Value Share (%) and BPS Analysis by Country, 2024 to 2034

Figure 158: East Asia Market Y-o-Y Growth (%) Projections by Country, 2024 to 2034

Figure 159: East Asia Market Value (US$ Million) Analysis by Component Type, 2019 to 2034

Figure 160: East Asia Market Value Share (%) and BPS Analysis by Component Type, 2024 to 2034

Figure 161: East Asia Market Y-o-Y Growth (%) Projections by Component Type, 2024 to 2034

Figure 162: East Asia Market Value (US$ Million) Analysis by Installation Type, 2019 to 2034

Figure 163: East Asia Market Value Share (%) and BPS Analysis by Installation Type, 2024 to 2034

Figure 164: East Asia Market Y-o-Y Growth (%) Projections by Installation Type, 2024 to 2034

Figure 165: East Asia Market Value (US$ Million) Analysis by End Use, 2019 to 2034

Figure 166: East Asia Market Value Share (%) and BPS Analysis by End Use, 2024 to 2034

Figure 167: East Asia Market Y-o-Y Growth (%) Projections by End Use, 2024 to 2034

Figure 168: East Asia Market Value (US$ Million) Analysis by Application, 2019 to 2034

Figure 169: East Asia Market Value Share (%) and BPS Analysis by Application, 2024 to 2034

Figure 170: East Asia Market Y-o-Y Growth (%) Projections by Application, 2024 to 2034

Figure 171: East Asia Market Attractiveness by Component Type, 2024 to 2034

Figure 172: East Asia Market Attractiveness by Installation Type, 2024 to 2034

Figure 173: East Asia Market Attractiveness by End Use, 2024 to 2034

Figure 174: East Asia Market Attractiveness by Application, 2024 to 2034

Figure 175: East Asia Market Attractiveness by Country, 2024 to 2034

Figure 176: Middle East and Africa Market Value (US$ Million) by Component Type, 2024 to 2034

Figure 177: Middle East and Africa Market Value (US$ Million) by Installation Type, 2024 to 2034

Figure 178: Middle East and Africa Market Value (US$ Million) by End Use, 2024 to 2034

Figure 179: Middle East and Africa Market Value (US$ Million) by Application, 2024 to 2034

Figure 180: Middle East and Africa Market Value (US$ Million) by Country, 2024 to 2034

Figure 181: Middle East and Africa Market Value (US$ Million) Analysis by Country, 2019 to 2034

Figure 182: Middle East and Africa Market Value Share (%) and BPS Analysis by Country, 2024 to 2034

Figure 183: Middle East and Africa Market Y-o-Y Growth (%) Projections by Country, 2024 to 2034

Figure 184: Middle East and Africa Market Value (US$ Million) Analysis by Component Type, 2019 to 2034

Figure 185: Middle East and Africa Market Value Share (%) and BPS Analysis by Component Type, 2024 to 2034

Figure 186: Middle East and Africa Market Y-o-Y Growth (%) Projections by Component Type, 2024 to 2034

Figure 187: Middle East and Africa Market Value (US$ Million) Analysis by Installation Type, 2019 to 2034

Figure 188: Middle East and Africa Market Value Share (%) and BPS Analysis by Installation Type, 2024 to 2034

Figure 189: Middle East and Africa Market Y-o-Y Growth (%) Projections by Installation Type, 2024 to 2034

Figure 190: Middle East and Africa Market Value (US$ Million) Analysis by End Use, 2019 to 2034

Figure 191: Middle East and Africa Market Value Share (%) and BPS Analysis by End Use, 2024 to 2034

Figure 192: Middle East and Africa Market Y-o-Y Growth (%) Projections by End Use, 2024 to 2034

Figure 193: Middle East and Africa Market Value (US$ Million) Analysis by Application, 2019 to 2034

Figure 194: Middle East and Africa Market Value Share (%) and BPS Analysis by Application, 2024 to 2034

Figure 195: Middle East and Africa Market Y-o-Y Growth (%) Projections by Application, 2024 to 2034

Figure 196: Middle East and Africa Market Attractiveness by Component Type, 2024 to 2034

Figure 197: Middle East and Africa Market Attractiveness by Installation Type, 2024 to 2034

Figure 198: Middle East and Africa Market Attractiveness by End Use, 2024 to 2034

Figure 199: Middle East and Africa Market Attractiveness by Application, 2024 to 2034

Figure 200: Middle East and Africa Market Attractiveness by Country, 2024 to 2034

Frequently Asked Questions

What is Current Transformer Monitoring System Market Valuation?

The transformer monitoring system industry is set to cultivate a valuation USD 3,259.70 million in 2024.

How Big will the Transformer Monitoring System Market Be by 2034?

The transformer asset management market has the proficiency to accumulate a worth of USD 7,646.39 million by 2034.

What is the Growth Potential of the Transformer Asset Management Market?

The transformer monitoring system industry is expected to register a CAGR of 8.90% through 2034.

What was the Historical Outlook of the Transformer Monitoring System Industry?

From 2019 to 2023, the transformer asset management market evolved at a moderate HCAGR of 4.38%.

Which Product Type Segment is set to Dominate the Transformer Condition Monitoring Market?

The hardware segment is prone to gain a global transformer monitoring system share of 83.60% in 2024.

Which Installation Type is Expected to Lead the Transformer Monitoring System (TMS) Market?

The retrofit units’ segment secures a potent share of 81.40% in 2024.

Explore Similar Insights

Future Market Insights

Transformer Monitoring System Market