Nerve Monitoring Devices Market Size and Share Forecast Outlook 2025 to 2035

The global Nerve Monitoring Devices Market is estimated to be valued at USD 1.3 billion in 2025 and is projected to reach USD 2.2 billion by 2035, registering a compound annual growth rate of 5.6% over the forecast period.

Quick Stats for Nerve Monitoring Devices Market

  • Industry Value (2025): USD 1.3 billion
  • Forecast Value (2035): USD 2.2 billion
  • Forecast CAGR: 5.6%
  • Leading Segment in 2025: Nerve Monitor Devices
  • Key Growth Region: Asia-Pacific (China, India, Japan, South Korea)
  • Top Key Players: Medtronic, NuVasive, Inc., Natus Medical Inc., Nihon Kohden, Masimo, GE Healthcare, Compumedics Limited, Checkpoint Surgical, Inc.,
Metric Value
Market Size in 2025 USD 1.3 billion
Projected Market Size in 2035 USD 2.2 billion
CAGR (2025 to 2035) 5.6%

The nerve monitoring devices market is experiencing a transformative phase, driven by a confluence of technological advancements, demographic shifts, and evolving surgical practices. The increasing prevalence of neurological disorders, coupled with a growing geriatric population, has heightened the demand for precise intraoperative nerve monitoring to prevent postoperative complications.

Technological innovations, such as AI-enhanced signal processing and the integration of nerve monitoring systems with robotic-assisted surgeries, are enhancing surgical precision and patient outcomes. Furthermore, the shift towards minimally invasive procedures necessitates advanced monitoring solutions to ensure nerve integrity during complex surgeries. Healthcare institutions are increasingly adopting these devices to improve surgical safety and efficiency, reflecting a broader trend towards value-based care.

Analyzing Nerve Monitoring Devices Market by Top Investment Segments

Nerve Monitors Lead the Market Owing to Rising Integration in Complex Surgical Workflows

The nerve monitors segment has been projected to hold a 48.8% revenue share in the global nerve monitoring devices market by 2025. This dominance has been attributed to the increasing integration of these systems in high-risk surgeries, where intraoperative nerve damage is a critical concern. Greater emphasis has been placed by surgical teams and hospital systems on ensuring nerve preservation, particularly during neurosurgical and spinal procedures.

Advanced monitor platforms have been preferred due to their ability to deliver real-time nerve function assessments, contributing to better post-surgical outcomes and minimized complications. Continuous innovations by OEMs in signal accuracy, portability, and multi-modal compatibility have further supported their adoption. Hospitals and specialty clinics have steadily invested in these devices due to their cost-benefit potential in complex procedures.
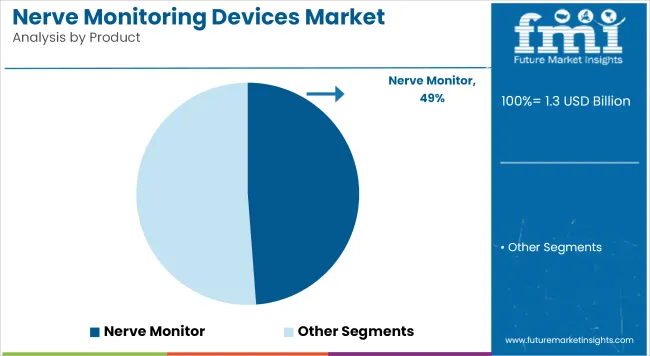
Nerve Monitoring Devices Market Analysis By Product

Electroencephalography (EEG) Dominates Due to Its Efficacy in Brain Function Monitoring and Surgical Mapping

Electroencephalography (EEG) technology is estimated to command 39.6% of the total market share in 2025, leading the technology segment. The dominance of EEG has been underpinned by its established role in monitoring electrical activity in the brain, which is crucial during neurosurgical procedures.

Enhanced utility in detecting seizure thresholds, cortical mapping, and assessing anesthesia depth has made EEG an indispensable modality in neurophysiology. This segment’s growth has been accelerated by technological advancements that have improved the resolution, portability, and signal processing capabilities of EEG devices. High adoption has been observed in tertiary care centers, driven by the growing incidence of neurological disorders requiring precise intraoperative mapping. Moreover, its non-invasive nature and compatibility with multimodal monitoring systems have made EEG a preferred solution among neuro-specialists.
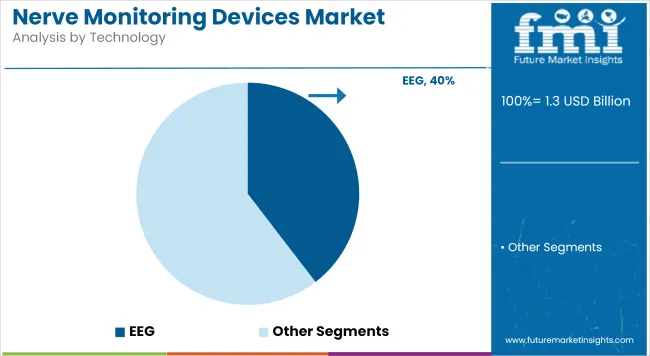
Nerve Monitoring Devices Market Analysis By Technology

Spine Surgery Applications Dominate Due to Increasing Procedural Volume and Demand for Nerve Integrity Monitoring

Spine surgery is expected to retain the leading position in the application segment, with a 40.2% market share in 2025. This has been driven by the rising global burden of spinal disorders, including herniated discs, scoliosis, and spinal stenosis. Surgical interventions in this area often pose a high risk of nerve damage, necessitating the intraoperative use of nerve monitoring devices to ensure functional preservation.

The segment’s dominance has been reinforced by an increasing preference for complex spine procedures such as spinal fusion and deformity correction surgeries. Regulatory agencies and surgical associations have emphasized nerve safety protocols, leading to broader use of EMG and SSEP-based monitoring solutions. Furthermore, improvements in minimally invasive spine surgery techniques have heightened the demand for precision-guided monitoring tools.
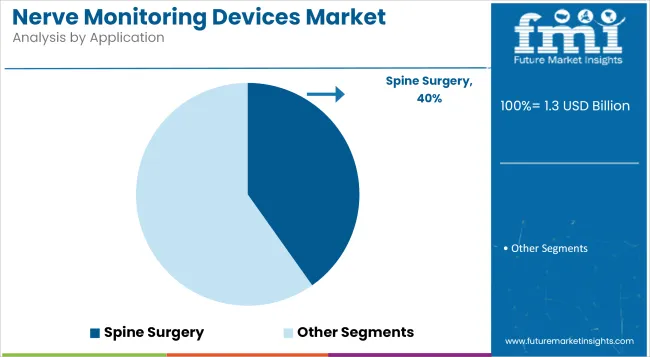
Nerve Monitoring Devices Market Analysis By Application

Challenges and Opportunities

Challenge: Reimbursement Gaps, Equipment Sensitivity, and Training Requirements

There are many systemic as well as clinical adoption hurdles in the nerve monitoring devices market. The high costs of equipment, surgical staff training requirements and limited reimbursement frameworks in emerging regions are preventing wider adoption particularly in outpatient and low-budget surgical centers.

And such devices need to be very precise and the signal stable in real time to avoid false positives or misinterpretation of nerve signals. This does not only add equipment to surgical products, but significantly increases the workload of hospitals to ensure the accuracy of electrode placement, the configuration of technicians, and the integration of multidisciplinary workflows, especially in otolaryngology (ENT), spinal surgery, neurosurgery or thyroid surgery. Older monitoring systems are not able to integrate with the latest robotic-assisted platforms, which inhibits their flexibility in advanced OR environments.

Opportunity: Surgical Safety, Robotics Integration, and AI-Augmented Monitoring

Despite these limitations, the market is witnessing rapid growth, primarily owing to the increasing global demand for neuroprotective surgical procedures, particularly in complex, minimally invasive or robotic-assisted procedures. Intraoperative Nerve Monitoring (IONM) systems have become a standard of care for surgical procedures that may put cranial, spinal, and peripheral nerve pathways at risk.

New IONM platforms won't be far behind, with breakthroughs in EMG/EEG signal capture, real-time visualization, and wireless, electrode-free (aquatic) systems, thanks to technological advances. Integration with robotic surgery systems, 3D surgical navigation, and AI-based pattern recognition reduce false alerts and improve response time. Furthermore, increasing focus on tracking post-operative outcomes and medico-legal compliance are also pushing the need for automated reporting, along with cloud-enabled data archiving.

Country Wise Outlook

United States

The nerve monitoring devices market in the USA is projected to grow at a steady pace owing to an increasing number of neurological surgeries, growth in an aging population, and higher adoption rates of intraoperative neurophysiological monitoring (IONM).

Also, high amount of healthcare expenditure coupled with presence of widespread awareness regarding prevention of nerve injury along with strong presence of topmost device manufacturers, are also going to drive the growth of the market.

Country CAGR (2025 to 2035)
USA 5.7%

United Kingdom

In United Kingdom nerve monitoring devices market is gaining acceleration due to growing investment in neurodiagnostics, increasing prevalence of spinal disorders and neurological diseases and higher adoption of IONM technologies in surgical centers. Healthcare infrastructure improvements and greater access to neurosurgical care will further boost the market.

Country CAGR (2025 to 2035)
UK 5.5%

European Union

The nerve monitoring devices market in Europe is also growing steadily, driven by a strong emphasis on patient safety during high-risk surgeries, increase in prevalence of neurodegenerative disorders, and support for technology innovation in surgical monitoring systems. Countries such as Germany, France and Italy are embracing both public and private healthcare sectors.

Country CAGR (2025 to 2035)
European Union (EU) 5.6%

Japan

The Japan nerve monitoring devices market is moderately growing, backed by the developed neurosurgical expertise of the country, a growing geriatric population, and growing preferences towards minimally invasive surgical procedures. Government initiatives encouraging medical technology upgradation, as well as neuro-care programs, are also fueling growth in the market.

Country CAGR (2025 to 2035)
Japan 5.5%

South Korea

The market in South Korea is anticipatory to grow due to rising consciousness towards preventing intra-operative nerve injury, enhance availability of neuro-monitoring services offered in supplementary hospitals along with integration of electrophysiological monitoring instruments in ENT, orthopedic and neurosurgery. Technological advancements alongside medical tourism is serving as a tailwind to the growth of the market.

Country CAGR (2025 to 2035)
South Korea 5.7%

Competition Outlook

The nerve monitoring devices market is characterized by intense competition, with a strong emphasis on technological innovation and clinical integration. Key players are actively engaged in expanding their product portfolios through the development of multifunctional, AI-enabled, and minimally invasive monitoring systems.

Strategic collaborations with hospitals and surgical centers are being pursued to strengthen clinical adoption and feedback-driven product design. Increased investment in R&D and real-time signal processing enhancements has intensified the competitive landscape. Additionally, firms are focusing on vertical integration across hardware, software, and service models to deliver end-to-end solutions. Regulatory approvals and CE mark expansions are being prioritized to enhance geographic presence.

Key Development
  • In 2024, The FDA has issued a Class I recall for Medtronic's NIM Vital Nerve Monitoring System due to potential false negative responses. This critical correction, linked to ten injuries, is for a device used to monitor nerve function during surgery, where errors could lead to serious harm.
  • In 2025, Philips and Medtronic have expanded their long-standing partnership with a new multi-year agreement. This collaboration aims to increase access to advanced patient monitoring technologies, integrating next-generation systems and consumables. Building on their 1992 alliance, the companies will continue to incorporate Medtronic's leading brands like Nellcor, Microstream, and BIS into Philips' monitoring solutions.

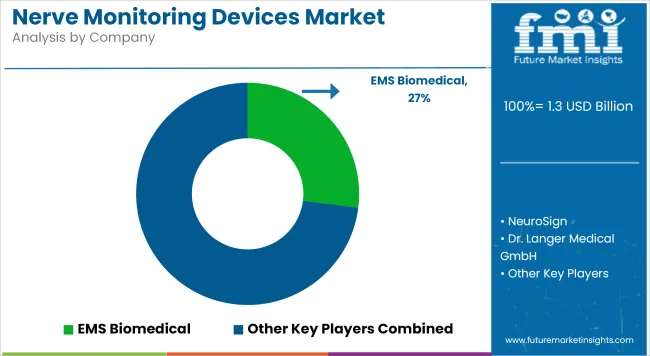
Nerve Monitoring Devices Market Analysis By Company

Companies

  • Medtronic
  • NuVasive, Inc.
  • Natus Medical Inc.
  • Nihon Kohden
  • Masimo
  • GE Healthcare
  • Compumedics Limited
  • Checkpoint Surgical, Inc.
  • Inomed Medizintechnik GmbH
  • Dr. Langer Medical GmbH
  • Neurovision Medical Products

Key Segmentation

By Product:

  • Nerve Monitor
  • Accessories
  • Probe
  • Electrode

By Technology:

  • EEG
  • ECOG
  • EP
  • EMG

By Application:

  • Neurosurgery
  • Spine Surgery
  • ENT Surgery
  • Cardiovascular Surgery

By Region:

  • North America
  • Latin America
  • Asia Pacific
  • MEA
  • Europe

Table of Content

  1. Executive Summary
  2. Industry Introduction, including Taxonomy and Market Definition
  3. Market Trends and Success Factors, including Macro-economic Factors, Market Dynamics, and Recent Industry Developments
  4. Market Demand Analysis 2020 to 2024 and Forecast 2025 to 2035, including Historical Analysis and Future Projections
  5. Pricing Analysis
  6. Market Analysis 2020 to 2024 and Forecast 2025 to 2035
    • By Product
    • By Technology
    • By Application
  7. Market Analysis 2020 to 2024 and Forecast 2025 to 2035, By Product
    • Nerve Monitor
    • Accessories
    • Probe
    • Electrode
  8. Market Analysis 2020 to 2024 and Forecast 2025 to 2035, By Technology
    • EEG
    • ECOG
    • EP
    • EMG
  9. Market Analysis 2020 to 2024 and Forecast 2025 to 2035, By Application
    • Neurosurgery
    • Spine Surgery
    • ENT Surgery
    • Cardiovascular Surgery
  10. Market Analysis 2020 to 2024 and Forecast 2025 to 2035, By Region
    • North America
    • Latin America
    • Western Europe
    • Eastern Europe
    • East Asia
    • South Asia Pacific
    • Middle East and Africa
  11. North America Sales Analysis 2020 to 2024 and Forecast 2025 to 2035, by Key Segments and Countries
  12. Latin America Sales Analysis 2020 to 2024 and Forecast 2025 to 2035, by Key Segments and Countries
  13. Western Europe Sales Analysis 2020 to 2024 and Forecast 2025 to 2035, by Key Segments and Countries
  14. Eastern Europe Sales Analysis 2020 to 2024 and Forecast 2025 to 2035, by Key Segments and Countries
  15. East Asia Sales Analysis 2020 to 2024 and Forecast 2025 to 2035, by Key Segments and Countries
  16. South Asia Pacific Sales Analysis 2020 to 2024 and Forecast 2025 to 2035, by Key Segments and Countries
  17. Middle East and Africa Sales Analysis 2020 to 2024 and Forecast 2025 to 2035, by Key Segments and Countries
  18. Sales Forecast 2025 to 2035 By Product, By Technology, and By Application for 30 Countries
  19. Competition Outlook, including Market Structure Analysis, Company Share Analysis by Key Players, and Competition Dashboard
  20. Company Profile
    • Medtronic, plc.
    • NuVasive, Inc.
    • Magtism
    • Inomed Medizintechnik
    • NIHON KOHDEN CORPORATION
    • EMS Biomedical
    • NeuroSign
    • Dr. Langer Medical GmbH
    • Natus Medical Incorporated
    • Deymed Diagnostic

List of Tables

  • Table 01: Global Market Value (USD Million) Forecast by Region, 2020 to 2035
  • Table 02: Global Market Volume (Units) Forecast by Region, 2020 to 2035
  • Table 03: Global Market Value (USD Million) Forecast by Product Type, 2020 to 2035
  • Table 04: Global Market Volume (Units) Forecast by Product Type, 2020 to 2035
  • Table 05: Global Market Value (USD Million) Forecast by Application, 2020 to 2035
  • Table 06: Global Market Volume (Units) Forecast by Application, 2020 to 2035
  • Table 07: Global Market Value (USD Million) Forecast by End User, 2020 to 2035
  • Table 08: Global Market Volume (Units) Forecast by End User, 2020 to 2035
  • Table 09: North America Market Value (USD Million) Forecast by Country, 2020 to 2035
  • Table 10: North America Market Volume (Units) Forecast by Country, 2020 to 2035
  • Table 11: North America Market Value (USD Million) Forecast by Product Type, 2020 to 2035
  • Table 12: North America Market Volume (Units) Forecast by Product Type, 2020 to 2035
  • Table 13: North America Market Value (USD Million) Forecast by Application, 2020 to 2035
  • Table 14: North America Market Volume (Units) Forecast by Application, 2020 to 2035
  • Table 15: North America Market Value (USD Million) Forecast by End User, 2020 to 2035
  • Table 16: North America Market Volume (Units) Forecast by End User, 2020 to 2035
  • Table 17: Latin America Market Value (USD Million) Forecast by Country, 2020 to 2035
  • Table 18: Latin America Market Volume (Units) Forecast by Country, 2020 to 2035
  • Table 19: Latin America Market Value (USD Million) Forecast by Product Type, 2020 to 2035
  • Table 20: Latin America Market Volume (Units) Forecast by Product Type, 2020 to 2035
  • Table 21: Latin America Market Value (USD Million) Forecast by Application, 2020 to 2035
  • Table 22: Latin America Market Volume (Units) Forecast by Application, 2020 to 2035
  • Table 23: Latin America Market Value (USD Million) Forecast by End User, 2020 to 2035
  • Table 24: Latin America Market Volume (Units) Forecast by End User, 2020 to 2035
  • Table 25: Europe Market Value (USD Million) Forecast by Country, 2020 to 2035
  • Table 26: Europe Market Volume (Units) Forecast by Country, 2020 to 2035
  • Table 27: Europe Market Value (USD Million) Forecast by Product Type, 2020 to 2035
  • Table 28: Europe Market Volume (Units) Forecast by Product Type, 2020 to 2035
  • Table 29: Europe Market Value (USD Million) Forecast by Application, 2020 to 2035
  • Table 30: Europe Market Volume (Units) Forecast by Application, 2020 to 2035
  • Table 31: Europe Market Value (USD Million) Forecast by End User, 2020 to 2035
  • Table 32: Europe Market Volume (Units) Forecast by End User, 2020 to 2035
  • Table 33: East Asia Market Value (USD Million) Forecast by Country, 2020 to 2035
  • Table 34: East Asia Market Volume (Units) Forecast by Country, 2020 to 2035
  • Table 35: East Asia Market Value (USD Million) Forecast by Product Type, 2020 to 2035
  • Table 36: East Asia Market Volume (Units) Forecast by Product Type, 2020 to 2035
  • Table 37: East Asia Market Value (USD Million) Forecast by Application, 2020 to 2035
  • Table 38: East Asia Market Volume (Units) Forecast by Application, 2020 to 2035
  • Table 39: East Asia Market Value (USD Million) Forecast by End User, 2020 to 2035
  • Table 40: East Asia Market Volume (Units) Forecast by End User, 2020 to 2035
  • Table 41: South Asia & Pacific Market Value (USD Million) Forecast by Country, 2020 to 2035
  • Table 42: South Asia & Pacific Market Volume (Units) Forecast by Country, 2020 to 2035
  • Table 43: South Asia & Pacific Market Value (USD Million) Forecast by Product Type, 2020 to 2035
  • Table 44: South Asia & Pacific Market Volume (Units) Forecast by Product Type, 2020 to 2035
  • Table 45: South Asia & Pacific Market Value (USD Million) Forecast by Application, 2020 to 2035
  • Table 46: South Asia & Pacific Market Volume (Units) Forecast by Application, 2020 to 2035
  • Table 47: South Asia & Pacific Market Value (USD Million) Forecast by End User, 2020 to 2035
  • Table 48: South Asia & Pacific Market Volume (Units) Forecast by End User, 2020 to 2035
  • Table 49: MEA Market Value (USD Million) Forecast by Country, 2020 to 2035
  • Table 50: MEA Market Volume (Units) Forecast by Country, 2020 to 2035
  • Table 51: MEA Market Value (USD Million) Forecast by Product Type, 2020 to 2035
  • Table 52: MEA Market Volume (Units) Forecast by Product Type, 2020 to 2035
  • Table 53: MEA Market Value (USD Million) Forecast by Application, 2020 to 2035
  • Table 54: MEA Market Volume (Units) Forecast by Application, 2020 to 2035
  • Table 55: MEA Market Value (USD Million) Forecast by End User, 2020 to 2035
  • Table 56: MEA Market Volume (Units) Forecast by End User, 2020 to 2035

List of Figures

  • Figure 01: Global Market Value (USD Million) by Product Type, 2025 to 2035
  • Figure 02: Global Market Value (USD Million) by Application, 2025 to 2035
  • Figure 03: Global Market Value (USD Million) by End User, 2025 to 2035
  • Figure 04: Global Market Value (USD Million) by Region, 2025 to 2035
  • Figure 05: Global Market Value (USD Million) Analysis by Region, 2020 to 2035
  • Figure 06: Global Market Volume (Units) Analysis by Region, 2020 to 2035
  • Figure 07: Global Market Value Share (%) and BPS Analysis by Region, 2025 to 2035
  • Figure 08: Global Market Y-o-Y Growth (%) Projections by Region, 2025 to 2035
  • Figure 09: Global Market Value (USD Million) Analysis by Product Type, 2020 to 2035
  • Figure 10: Global Market Volume (Units) Analysis by Product Type, 2020 to 2035
  • Figure 11: Global Market Value Share (%) and BPS Analysis by Product Type, 2025 to 2035
  • Figure 12: Global Market Y-o-Y Growth (%) Projections by Product Type, 2025 to 2035
  • Figure 13: Global Market Value (USD Million) Analysis by Application, 2020 to 2035
  • Figure 14: Global Market Volume (Units) Analysis by Application, 2020 to 2035
  • Figure 15: Global Market Value Share (%) and BPS Analysis by Application, 2025 to 2035
  • Figure 16: Global Market Y-o-Y Growth (%) Projections by Application, 2025 to 2035
  • Figure 17: Global Market Value (USD Million) Analysis by End User, 2020 to 2035
  • Figure 18: Global Market Volume (Units) Analysis by End User, 2020 to 2035
  • Figure 19: Global Market Value Share (%) and BPS Analysis by End User, 2025 to 2035
  • Figure 20: Global Market Y-o-Y Growth (%) Projections by End User, 2025 to 2035
  • Figure 21: Global Market Attractiveness by Product Type, 2025 to 2035
  • Figure 22: Global Market Attractiveness by Application, 2025 to 2035
  • Figure 23: Global Market Attractiveness by End User, 2025 to 2035
  • Figure 24: Global Market Attractiveness by Region, 2025 to 2035
  • Figure 25: North America Market Value (USD Million) by Product Type, 2025 to 2035
  • Figure 26: North America Market Value (USD Million) by Application, 2025 to 2035
  • Figure 27: North America Market Value (USD Million) by End User, 2025 to 2035
  • Figure 28: North America Market Value (USD Million) by Country, 2025 to 2035
  • Figure 29: North America Market Value (USD Million) Analysis by Country, 2020 to 2035
  • Figure 30: North America Market Volume (Units) Analysis by Country, 2020 to 2035
  • Figure 31: North America Market Value Share (%) and BPS Analysis by Country, 2025 to 2035
  • Figure 32: North America Market Y-o-Y Growth (%) Projections by Country, 2025 to 2035
  • Figure 33: North America Market Value (USD Million) Analysis by Product Type, 2020 to 2035
  • Figure 34: North America Market Volume (Units) Analysis by Product Type, 2020 to 2035
  • Figure 35: North America Market Value Share (%) and BPS Analysis by Product Type, 2025 to 2035
  • Figure 36: North America Market Y-o-Y Growth (%) Projections by Product Type, 2025 to 2035
  • Figure 37: North America Market Value (USD Million) Analysis by Application, 2020 to 2035
  • Figure 38: North America Market Volume (Units) Analysis by Application, 2020 to 2035
  • Figure 39: North America Market Value Share (%) and BPS Analysis by Application, 2025 to 2035
  • Figure 40: North America Market Y-o-Y Growth (%) Projections by Application, 2025 to 2035
  • Figure 41: North America Market Value (USD Million) Analysis by End User, 2020 to 2035
  • Figure 42: North America Market Volume (Units) Analysis by End User, 2020 to 2035
  • Figure 43: North America Market Value Share (%) and BPS Analysis by End User, 2025 to 2035
  • Figure 44: North America Market Y-o-Y Growth (%) Projections by End User, 2025 to 2035
  • Figure 45: North America Market Attractiveness by Product Type, 2025 to 2035
  • Figure 46: North America Market Attractiveness by Application, 2025 to 2035
  • Figure 47: North America Market Attractiveness by End User, 2025 to 2035
  • Figure 48: North America Market Attractiveness by Country, 2025 to 2035
  • Figure 49: Latin America Market Value (USD Million) by Product Type, 2025 to 2035
  • Figure 50: Latin America Market Value (USD Million) by Application, 2025 to 2035
  • Figure 51: Latin America Market Value (USD Million) by End User, 2025 to 2035
  • Figure 52: Latin America Market Value (USD Million) by Country, 2025 to 2035
  • Figure 53: Latin America Market Value (USD Million) Analysis by Country, 2020 to 2035
  • Figure 54: Latin America Market Volume (Units) Analysis by Country, 2020 to 2035
  • Figure 55: Latin America Market Value Share (%) and BPS Analysis by Country, 2025 to 2035
  • Figure 56: Latin America Market Y-o-Y Growth (%) Projections by Country, 2025 to 2035
  • Figure 57: Latin America Market Value (USD Million) Analysis by Product Type, 2020 to 2035
  • Figure 58: Latin America Market Volume (Units) Analysis by Product Type, 2020 to 2035
  • Figure 59: Latin America Market Value Share (%) and BPS Analysis by Product Type, 2025 to 2035
  • Figure 60: Latin America Market Y-o-Y Growth (%) Projections by Product Type, 2025 to 2035
  • Figure 61: Latin America Market Value (USD Million) Analysis by Application, 2020 to 2035
  • Figure 62: Latin America Market Volume (Units) Analysis by Application, 2020 to 2035
  • Figure 63: Latin America Market Value Share (%) and BPS Analysis by Application, 2025 to 2035
  • Figure 64: Latin America Market Y-o-Y Growth (%) Projections by Application, 2025 to 2035
  • Figure 65: Latin America Market Value (USD Million) Analysis by End User, 2020 to 2035
  • Figure 66: Latin America Market Volume (Units) Analysis by End User, 2020 to 2035
  • Figure 67: Latin America Market Value Share (%) and BPS Analysis by End User, 2025 to 2035
  • Figure 68: Latin America Market Y-o-Y Growth (%) Projections by End User, 2025 to 2035
  • Figure 69: Latin America Market Attractiveness by Product Type, 2025 to 2035
  • Figure 70: Latin America Market Attractiveness by Application, 2025 to 2035
  • Figure 71: Latin America Market Attractiveness by End User, 2025 to 2035
  • Figure 72: Latin America Market Attractiveness by Country, 2025 to 2035
  • Figure 73: Europe Market Value (USD Million) by Product Type, 2025 to 2035
  • Figure 74: Europe Market Value (USD Million) by Application, 2025 to 2035
  • Figure 75: Europe Market Value (USD Million) by End User, 2025 to 2035
  • Figure 76: Europe Market Value (USD Million) by Country, 2025 to 2035
  • Figure 77: Europe Market Value (USD Million) Analysis by Country, 2020 to 2035
  • Figure 78: Europe Market Volume (Units) Analysis by Country, 2020 to 2035
  • Figure 79: Europe Market Value Share (%) and BPS Analysis by Country, 2025 to 2035
  • Figure 80: Europe Market Y-o-Y Growth (%) Projections by Country, 2025 to 2035
  • Figure 81: Europe Market Value (USD Million) Analysis by Product Type, 2020 to 2035
  • Figure 82: Europe Market Volume (Units) Analysis by Product Type, 2020 to 2035
  • Figure 83: Europe Market Value Share (%) and BPS Analysis by Product Type, 2025 to 2035
  • Figure 84: Europe Market Y-o-Y Growth (%) Projections by Product Type, 2025 to 2035
  • Figure 85: Europe Market Value (USD Million) Analysis by Application, 2020 to 2035
  • Figure 86: Europe Market Volume (Units) Analysis by Application, 2020 to 2035
  • Figure 87: Europe Market Value Share (%) and BPS Analysis by Application, 2025 to 2035
  • Figure 88: Europe Market Y-o-Y Growth (%) Projections by Application, 2025 to 2035
  • Figure 89: Europe Market Value (USD Million) Analysis by End User, 2020 to 2035
  • Figure 90: Europe Market Volume (Units) Analysis by End User, 2020 to 2035
  • Figure 91: Europe Market Value Share (%) and BPS Analysis by End User, 2025 to 2035
  • Figure 92: Europe Market Y-o-Y Growth (%) Projections by End User, 2025 to 2035
  • Figure 93: Europe Market Attractiveness by Product Type, 2025 to 2035
  • Figure 94: Europe Market Attractiveness by Application, 2025 to 2035
  • Figure 95: Europe Market Attractiveness by End User, 2025 to 2035
  • Figure 96: Europe Market Attractiveness by Country, 2025 to 2035
  • Figure 97: East Asia Market Value (USD Million) by Product Type, 2025 to 2035
  • Figure 98: East Asia Market Value (USD Million) by Application, 2025 to 2035
  • Figure 99: East Asia Market Value (USD Million) by End User, 2025 to 2035
  • Figure 100: East Asia Market Value (USD Million) by Country, 2025 to 2035
  • Figure 101: East Asia Market Value (USD Million) Analysis by Country, 2020 to 2035
  • Figure 102: East Asia Market Volume (Units) Analysis by Country, 2020 to 2035
  • Figure 103: East Asia Market Value Share (%) and BPS Analysis by Country, 2025 to 2035
  • Figure 104: East Asia Market Y-o-Y Growth (%) Projections by Country, 2025 to 2035
  • Figure 105: East Asia Market Value (USD Million) Analysis by Product Type, 2020 to 2035
  • Figure 106: East Asia Market Volume (Units) Analysis by Product Type, 2020 to 2035
  • Figure 107: East Asia Market Value Share (%) and BPS Analysis by Product Type, 2025 to 2035
  • Figure 108: East Asia Market Y-o-Y Growth (%) Projections by Product Type, 2025 to 2035
  • Figure 109: East Asia Market Value (USD Million) Analysis by Application, 2020 to 2035
  • Figure 110: East Asia Market Volume (Units) Analysis by Application, 2020 to 2035
  • Figure 111: East Asia Market Value Share (%) and BPS Analysis by Application, 2025 to 2035
  • Figure 112: East Asia Market Y-o-Y Growth (%) Projections by Application, 2025 to 2035
  • Figure 113: East Asia Market Value (USD Million) Analysis by End User, 2020 to 2035
  • Figure 114: East Asia Market Volume (Units) Analysis by End User, 2020 to 2035
  • Figure 115: East Asia Market Value Share (%) and BPS Analysis by End User, 2025 to 2035
  • Figure 116: East Asia Market Y-o-Y Growth (%) Projections by End User, 2025 to 2035
  • Figure 117: East Asia Market Attractiveness by Product Type, 2025 to 2035
  • Figure 118: East Asia Market Attractiveness by Application, 2025 to 2035
  • Figure 119: East Asia Market Attractiveness by End User, 2025 to 2035
  • Figure 120: East Asia Market Attractiveness by Country, 2025 to 2035
  • Figure 121: South Asia & Pacific Market Value (USD Million) by Product Type, 2025 to 2035
  • Figure 122: South Asia & Pacific Market Value (USD Million) by Application, 2025 to 2035
  • Figure 123: South Asia & Pacific Market Value (USD Million) by End User, 2025 to 2035
  • Figure 124: South Asia & Pacific Market Value (USD Million) by Country, 2025 to 2035
  • Figure 125: South Asia & Pacific Market Value (USD Million) Analysis by Country, 2020 to 2035
  • Figure 126: South Asia & Pacific Market Volume (Units) Analysis by Country, 2020 to 2035
  • Figure 127: South Asia & Pacific Market Value Share (%) and BPS Analysis by Country, 2025 to 2035
  • Figure 128: South Asia & Pacific Market Y-o-Y Growth (%) Projections by Country, 2025 to 2035
  • Figure 129: South Asia & Pacific Market Value (USD Million) Analysis by Product Type, 2020 to 2035
  • Figure 130: South Asia & Pacific Market Volume (Units) Analysis by Product Type, 2020 to 2035
  • Figure 131: South Asia & Pacific Market Value Share (%) and BPS Analysis by Product Type, 2025 to 2035
  • Figure 132: South Asia & Pacific Market Y-o-Y Growth (%) Projections by Product Type, 2025 to 2035
  • Figure 133: South Asia & Pacific Market Value (USD Million) Analysis by Application, 2020 to 2035
  • Figure 134: South Asia & Pacific Market Volume (Units) Analysis by Application, 2020 to 2035
  • Figure 135: South Asia & Pacific Market Value Share (%) and BPS Analysis by Application, 2025 to 2035
  • Figure 136: South Asia & Pacific Market Y-o-Y Growth (%) Projections by Application, 2025 to 2035
  • Figure 137: South Asia & Pacific Market Value (USD Million) Analysis by End User, 2020 to 2035
  • Figure 138: South Asia & Pacific Market Volume (Units) Analysis by End User, 2020 to 2035
  • Figure 139: South Asia & Pacific Market Value Share (%) and BPS Analysis by End User, 2025 to 2035
  • Figure 140: South Asia & Pacific Market Y-o-Y Growth (%) Projections by End User, 2025 to 2035
  • Figure 141: South Asia & Pacific Market Attractiveness by Product Type, 2025 to 2035
  • Figure 142: South Asia & Pacific Market Attractiveness by Application, 2025 to 2035
  • Figure 143: South Asia & Pacific Market Attractiveness by End User, 2025 to 2035
  • Figure 144: South Asia & Pacific Market Attractiveness by Country, 2025 to 2035
  • Figure 145: MEA Market Value (USD Million) by Product Type, 2025 to 2035
  • Figure 146: MEA Market Value (USD Million) by Application, 2025 to 2035
  • Figure 147: MEA Market Value (USD Million) by End User, 2025 to 2035
  • Figure 148: MEA Market Value (USD Million) by Country, 2025 to 2035
  • Figure 149: MEA Market Value (USD Million) Analysis by Country, 2020 to 2035
  • Figure 150: MEA Market Volume (Units) Analysis by Country, 2020 to 2035
  • Figure 151: MEA Market Value Share (%) and BPS Analysis by Country, 2025 to 2035
  • Figure 152: MEA Market Y-o-Y Growth (%) Projections by Country, 2025 to 2035
  • Figure 153: MEA Market Value (USD Million) Analysis by Product Type, 2020 to 2035
  • Figure 154: MEA Market Volume (Units) Analysis by Product Type, 2020 to 2035
  • Figure 155: MEA Market Value Share (%) and BPS Analysis by Product Type, 2025 to 2035
  • Figure 156: MEA Market Y-o-Y Growth (%) Projections by Product Type, 2025 to 2035
  • Figure 157: MEA Market Value (USD Million) Analysis by Application, 2020 to 2035
  • Figure 158: MEA Market Volume (Units) Analysis by Application, 2020 to 2035
  • Figure 159: MEA Market Value Share (%) and BPS Analysis by Application, 2025 to 2035
  • Figure 160: MEA Market Y-o-Y Growth (%) Projections by Application, 2025 to 2035
  • Figure 161: MEA Market Value (USD Million) Analysis by End User, 2020 to 2035
  • Figure 162: MEA Market Volume (Units) Analysis by End User, 2020 to 2035
  • Figure 163: MEA Market Value Share (%) and BPS Analysis by End User, 2025 to 2035
  • Figure 164: MEA Market Y-o-Y Growth (%) Projections by End User, 2025 to 2035
  • Figure 165: MEA Market Attractiveness by Product Type, 2025 to 2035
  • Figure 166: MEA Market Attractiveness by Application, 2025 to 2035
  • Figure 167: MEA Market Attractiveness by End User, 2025 to 2035
  • Figure 168: MEA Market Attractiveness by Country, 2025 to 2035

Frequently Asked Questions

What was the overall size of the nerve monitoring devices market in 2025?

The overall market size for the nerve monitoring devices market was USD 1.3 billion in 2025.

How big is the nerve monitoring devices market expected to be in 2035?

The nerve monitoring devices market is expected to reach USD 2.2 billion in 2035.

What will drive the demand for the nerve monitoring devices market during the forecast period?

Growth is driven by the increasing prevalence of neurological disorders, rising number of complex surgeries requiring intraoperative nerve monitoring, advancements in neuromonitoring technology, and growing awareness about postoperative nerve damage prevention.

List the top 5 countries contributing to the nerve monitoring devices market.

The top 5 countries driving the development of the nerve monitoring devices market are the USA, Germany, Japan, China, and the UK.

Which segment in type is expected to lead in the nerve monitoring devices market?

Nerve Monitors and EMG Technology are expected to command a significant share over the assessment period due to their critical role in spinal, ENT, and neurosurgical procedures.

Explore Similar Insights

Future Market Insights

Nerve Monitoring Devices Market