Nerve Repair Market
How will Rising Cases of Neurological Disorders Worldwide Create Conducive Environment for Nerve Repair Products Manufacturers? Explore FMI’s Latest Study
Nerve Repair Market by Treatment, End Use & region - Forecast 2022 - 2032
Nerve Repair Market Outlook (2022-2032)
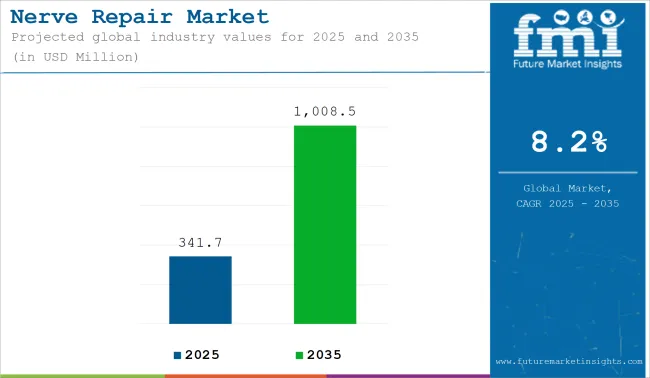
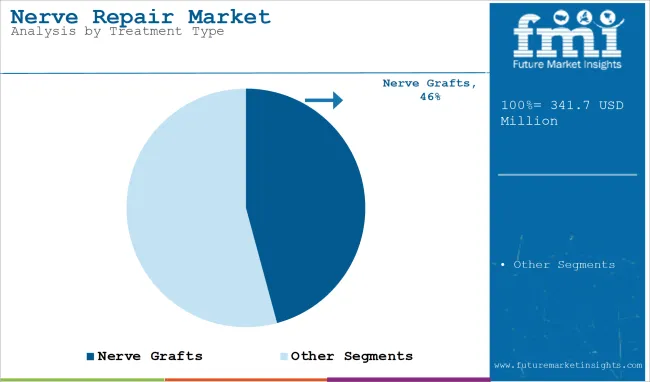
[226 Pages Report] The overall sales in the global nerve repair market are expected to surpass US$ 242.8 Mn in 2022, registering growth at 12.3% CAGR between 2022 and 2032. With growing prevalence of neurological illness, the sales in the market are projected to reach ~US$ 771.6 Mn in 2032. According to the study, in terms of product type, the nerve grafts led the market with a share of about 42.2% in 2021.
As the cases of several chronic nervous systems such as Alzheimer and Parkinson’s disease rises, the demand for nerve repair products is predicted to burgeon over the forecast period. Further, growth in the market will accelerate on the back of technological advancements in the neurological treatments.
For instance, in 2022, Medtronic announced the approval for its Intellis neurostimulator and the Vanta neurostimulator from the U.S. Food and Drug Administration (FDA) for the chronic pain treatment associated with diabetic peripheral neuropathy (DPN).
Attributes |
Key Insights |
Nerve Repair Market Value 2021 |
US$ 216.8 Mn |
Estimated Market Size 2022 |
US$ 242.8 Mn |
Projected Market Value 2032 |
US$ 771.6 Mn |
CAGR 2022-2032 |
12.3% |
Market Share of Top 5 Countries |
60.5% |
When a nerve is damaged, it can lead to serious motor and sensory issues that ache and cause the appendages to malfunction. Hence, health professionals are employing biomaterials in the nerve repair process are included in products for nerve repair. Auto graft is the gold standard for nerve repair procedures, although the specifics of the procedure are determined by the type and severity of the nerve injury.
Advanced nerve repair therapies are used to treat nerve damage brought on by trauma and other factors, which is a key driver influencing the market. Adult stem cells, which can be obtained from adipose tissue, skin, and bone marrow, are now being employed in many developed nations to repair and regenerate nerves.
Let us know your requirement to get
100% FREE customization
Sales Analysis of Nerve Repair Market from 2015 to 2021 Vs Market Outlook for 2022 to 2032
As per Future Market Insights (FMI), the nerve repair market was approximately 3.1% of the overall ~US$ 7.0 Bn of the global nerve repair and regeneration market in 2021. Sales in the nerve repair market expanded at a CAGR of 9.5% between 2015 and 2021. However, growth in the market is predicted to surge by 3.5x through 2022 & beyond.
Key players in the market are increasing the manufacturing of nerve repair products as prevalence of neurological disorders surges. Additionally, increase in the nerve repair expenditure is likely to drive the sales in nerve repair market over the forecast period (2022-2032).
As per the study, cases of nerve damage in developed countries are increasing, fuelling the demand in the market. According to the American Society for Peripheral Nerve, an average of 1.2 Million procedures are performed alone in the U.S.,
An estimated US$ 150 billion are spent on medical care for nerve injuries yearly in the US. This portrays the expenditure on nerve repair, replacement and regeneration due to rise in cases of indications like amyotrophic lateral sclerosis, multiple system atrophy, Parkinson’s disease, Alzheimer’s disease and multiple sclerosis.
According to the Pan American Health Organization in 2019, neurological conditions account for 32.9 deaths per 100,000 populations, out of which 33.1 deaths per 100,000 populations in men and 32.2 deaths per 100,000 populations in women.
Hence, to reduce the global burden, key players are increasing the manufacturing of nerve repair products. Consequently, the governments across the globe are also investing in creating awareness across countries such as India, South Africa, and others, propelling the sales of nerve repair products over the forecast period. On the back of this, the demand in nerve repair market is poised to expand at a CAGR of 12.3% from 2022 to 2032.
What are the Key Trends Driving the Growth in Nerve Repair Market?
Key Players are Capitalizing on Untapped Opportunities in South & East Asia
Key players are eyeing the East and South Asia market to capitalize on growing demand for neurological products coupled with rising awareness in countries such as India, China, and Japan. They are also tapping into the markets of Mexico, Indonesia, and other Middle Eastern nations. This is also expected to fuel the demand in the nerve repair market.
Further, leading producers are investing a great deal of effort into streamlining their R&D and improving production for nerve repair products. Due to the cost-effectiveness achieved by outsourcing their manufacturing capabilities, CDMOs will likely anticipate a profitable decade.
Find your sweet spots for generating winning opportunities in this market.
Talk to AnalystWhat are the Factors Restraining the Demand within the Nerve Repair Market?
In addition to grafting, there are a number of other treatment options for nerve repair. Stem cell treatment is another method for regenerating damaged nerves. The injured nerve is ultimately repaired by the adult stem cells, which are applied directly to the affected area. Over the projected period, this is expected to impede the growth of the market's sales revenues for nerve repair.
Furthermore, the infrastructure for health care is typically inadequate in emerging economies like Brazil, Argentina, and a number of Middle Eastern and African nations. There are an insufficient number of highly skilled healthcare practitioners due to the underdeveloped healthcare infrastructure. This has ultimately resulted in the lack of adoption of cutting-edge therapies for nerve repair and other treatments in emerging economies, which has limited sales revenue in the market for nerve repair.
These factors cumulatively propose a negative effect on the developmental growth of the nerve repair market.
Country-Wise Insights
What Makes the U.S. a Highly Lucrative Nerve Repair Market?
Availability of Favorable Reimbursement Policies in the U.S. to Fuel the Sales
The U.S. held approximately 89.5% share in the global nerve repair market in 2021, opines FMI. Sales in the U.S. are slated to grow at an impressive CAGR of 13.3% during the forecast period.
Growth in the market is underpinned by strong presence of several health insurance companies. These companies incorporate government programs to provide insurance coverage for standard procedures in nerve repair and regeneration. Backed by this, the U.S. nerve repair market is set to witness stupendous growth over the upcoming decade.
In the U.S., the reimbursement system is a combination of public/private payers, where government, employers and individuals, bear the cost. Around 200 million people in the U.S. were insured with some form of private insurance, while 70 – 80 million were insured by public insurance in 2020, as per the Commonwealth Fund.
Will China Emerge as the Most Remunerative Nerve Repair Market?
China to Contribute Nearly 2/5th of Sales in the Global Nerve Repair Market
FMI estimates, China held around a demand share of 37.6% in 2021 in the East Asia nerve repair market. With growing awareness regarding neurological disorders and increasing government initiatives, China is anticipated to witness favorable growth during the forecast period. This is mostly due to the presence of numerous biomaterial and mobility devices manufacturing companies.
The country also has the robust supply-chain system, and with burgeoning cases of Alzheimer among geriatric population, the demand in the market is predicted to rise at a rapid pace. Further, improved healthcare infrastructure and technological advancements in the treatment of nerve repair and regeneration will create conducive environment for the market.
What is the Demand Outlook for Germany Nerve Repair Market?
Increasing Cases of Nerve Injury to Create Lucrative Sales Prospects in Germany
Germany is set to exhibit growth at a CAGR of nearly 14.5% in the Europe nerve repair market during the forecast period. As per the study, Germany contributed around 19.1% of the demand share in the Europe nerve repair market in 2021.
The motor reflexes become less active among patients with neurological trauma and minor accidents. In Germany, the number of patients with nerve injury is surging as the population ages. According to a study, people aged 50 and older undergo over 65% of limb surgeries, 82% of surgeries worldwide are performed as a result of diabetes and peripheral vascular diseases. This is anticipated to propel the demand for nerve repair products in the country.

A unified Market Research Subscription Platform, built for today's disparate research needs.
Category-Wise Insights
Which Type of Nerve Repair Product is Gaining Traction?
Over 42% of Revenue in Nerve Repair Market to be Contributed by Nerve Grafts
In terms of product type, the nerve grafts segment is expected to witness impressive growth at 13.8% CAGR during the forecast period. The segment contributed over 42.2% of revenue in 2021.
Nerve graft is a self-healthy cell made from human nerve allograft, which is applied on a damaged nerve and proposed for the surgical repair of peripheral nerve breaks. Effective results of this grafting make this segment as a leading factor driving the growth of the overall nerve repair market.
What Type of Nerve Repair will Generate Maximum Revenue in the Market?
Epineural Nerve Repair to be the Most Preferred among Neurologists
The epineural nerve repair segment held a revenue share of around 64.7% in 2021 and the segment is expected to display growth at a CAGR of 13.2% over the forecast period. This procedure is a common surgical process to repair a nerve cut via the epineurium, and repair the nerve fibers originating from the spinal cord. This procedure is very effective and easy to conduct, improving the adoption among healthcare professionals.
Which is the Leading End User in the Nerve Repair Market?
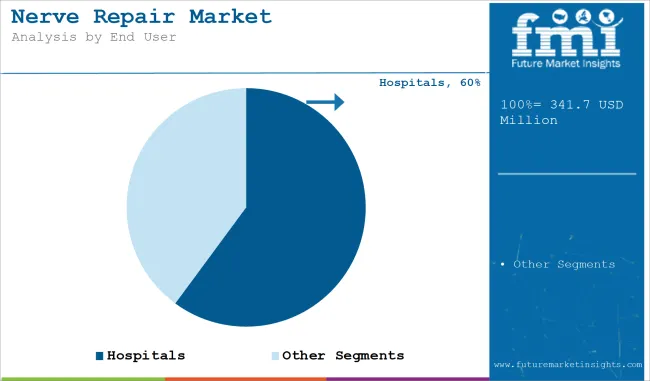
Hospitals to Generate Nearly 3/5th of Revenue in Nerve Repair Market
Based on end user, the hospitals segment held the highest market share value of about 58.6% in 2021. Availability of advanced medical equipment for comprehensive patient care in hospitals is the key factor propelling the growth in the segment. Moreover, with contracts through multiple distribution channels, hospitals can provide services with subsidized costs for equipment. With a large patient footfall and growing burden of neurological disorders, the adoption of nerve repair products in hospitals is predicted to surge over the forecast period.
Competitive Landscape
With several established nerve repair production companies across the globe, the overall market is estimated to be highly fragmented. To maintain a strong foothold in the industry, key players are increasing R&D efforts to expand their novel product portfolios. Several products are in their pipeline stage, and the companies are moving their efforts into promoting regularization and licensing of these pipelined products after assessing their efficacy.
For instance:
- Integra LifeSciences Holding Corporation announced the launch of NeuraGen® 3D Nerve Guide Matrix, a resorbable implant for the repair of peripheral nerve discontinuities, in March 2022.
- Topline findings from Avance Nerve Graft vs. compared with Conduits in Digital Nerve Injuries from the RECON Clinical Study were released by Axogen, Inc. in May 2022. The company will submit a biologics licence application (BLA) in the second half of 2023 with the help of the data collected from this clinical study.
- Checkpoint Surgical, Inc. introduced The NeuroShield® Chitosan Nerve Wrap in August 2021, expanding their portfolio of intraoperative nerve care products.
Report Scope as per Nerve Repair Industry Analysis
Attribute |
Details |
Estimated Market Size 2022 |
US$ 242.8 Mn |
Projected Market Value 2032 |
US$ 771.6 Mn |
CAGR 2022-2032 |
12.3% |
Forecast Period |
2015-2021 |
Historical Data Available for |
2022-2032 |
Market Analysis |
US$ Mn for Value |
Key Regions Covered |
North America, Latin America, Europe, South Asia, East Asia, Oceania, and Middle East & Africa |
Key Countries Covered |
U.S., Canada, Brazil, Mexico, Argentina, U.K., Germany, Italy, Russia, Spain, France, BENELUX, Russia, India, Thailand, Indonesia, Malaysia, Japan, China, South Korea, Australia, New Zealand, Turkey, GCC, North Africa, North Africa, and South Africa |
Key Market Segments Covered |
Product, Nerve Repair, End User, and Region |
Key Companies Profiled |
|
Key Market Segments Covered in Nerve Repair Industry Research
By Product:
- Nerve Wrap
- Nerve Protector
- Nerve Connector
- Nerve Graft
By Nerve Repair:
- Epineural Nerve Repair
- Perineural Nerve Repair
- Fascicular Nerve Repair
By End User:
- Hospitals
- Ambulatory Surgical Centers
- Specialty Clinics
By Region:
- North America
- Latin America
- Europe
- South Asia
- East Asia
- Oceania
- The Middle East and Africa (MEA)
Frequently Asked Questions
The global nerve repair market valued around US$ 216.8 Mn in 2021 and is set to expand 3.2X over the next ten years.
The nerve repair market is expected to reach US$ 771.6 Mn by the end of 2032, with sales expected to register a 12.3% CAGR.
Government initiatives to promote awareness over nerve disorders, use of advanced therapies, and presence of reimbursement, are some of the key trends in this market.
The U.S., Japan, China, Russia, and Canada, are the leading countries in nerve repair market.
North America is one of the key markets for nerve repair, with the U.S. accounting for about 89.5% of the North America nerve repair market.
Demand for nerve repair in India is expected to register a CAGR of 9.3% over the next ten years.
Demand for nerve repair in the U.K. is expected to register a CAGR of 12.2% over the next ten years.
The U.S., China, and Germany are the key producers within the nerve repair market space.
Axogen, Inc., Stryker Corporation, Baxter International Inc., Integra Lifesciences Holdings Corp, Neurotex Ltd, Polyganics B.V., Abbott Laboratories, Boston Scientific Inc, Medtronic Plc, Checkpoint Surgical, Polyganics, Synovis Micro Companies Alliance, and Orthomed, Inc are some of the key players in the nerve repair industry.
Table of Content
1. Executive Summary
1.1. Global Market Outlook
1.2. Demand Side Trends
1.3. Supply Side Trends
1.4. Analysis and Recommendations
2. Market Overview
2.1. Market Coverage / Taxonomy
2.2. Market Definition / Scope / Limitations
2.3. Inclusions and Exclusions
3. Key Market Trends
3.1. Key Trends Impacting the Market
3.2. Product Development and Innovation Trends
4. Key Success Factors
4.1. Product USPs/features
4.2. Product Adoption Analysis by Region
4.3. Key Industry Developments
4.4. Regulatory Landscape
4.5. Reimbursement Scenario
4.6. Promotional Strategies by Manufacturer
4.7. Technology Assessment
4.8. Porter’s Analysis
4.9. PESTLE Analysis
4.10. Value Chain Analysis
5. Market Background
5.1. Macro-Economic Factors
5.1.1. Global GDP Growth Outlook
5.1.2. Global Healthcare Expenditure Outlook
5.1.3. Global And Regeneration Outlook
5.2. Forecast Factors - Relevance & Impact
5.2.1. Global Increase in Healthcare Expenditure
5.2.2. Rising R&D Activities
5.2.3. Growing Incidence of Neurological Disorders
5.2.4. Rising Geriatric Population
5.2.5. Advancements in Next-Generation Neurostimulation Devices
5.2.6. Product Pipeline
5.2.7. Growing Investments by Key Companies
5.2.8. Rising Applications of Stem Cell Therapy
5.3. Market Dynamics
5.3.1. Drivers
5.3.2. Restraints
5.3.3. Opportunity Analysis
6. COVID-19 Crisis – Impact Assessment
6.1. COVID19 and Impact Analysis
6.1.1. By Product
6.1.2. By Nerve Repair
6.1.3. By End User
6.1.4. By Country
7. Global Market Demand (in Volume) Analysis 2015-2021 and Forecast, 2022–2032
7.1. Historical Market Volume (Units) Analysis, 2015-2021
7.2. Current and Future Market Volume (Units) Projections, 2022–2032
7.2.1. Y-o-Y Growth Trend Analysis
8. Global Market - Pricing Analysis
8.1. Region-wise Analysis By Product
8.2. Pricing Break-up
8.2.1. Manufacturer Level Pricing
8.2.2. Distributor Level Pricing
8.3. Global Average Pricing Analysis Benchmark
8.4. Pricing Assumptions
9. Global Market Demand (in Value or Size in US$ Mn) Analysis 2015-2021 and Forecast, 2022–2032
9.1. Historical Market Value (US$ Mn) Analysis, 2015-2021
9.2. Current and Future Market Value (US$ Mn) Projections, 2022–2032
9.2.1. Y-o-Y Growth Trend Analysis
9.2.2. Absolute $ Opportunity Analysis
10. Global Market Analysis 2015-2021 and Forecast 2022–2032, By Product
10.1. Introduction / Key Findings
10.2. Historical Market Size (US$ Mn) and Volume (Units) Analysis, By Product, 2015-2021
10.3. Current and Future Market Size (US$ Mn) and Volume (Units) Analysis, By Product, 2022–2032
10.3.1. Nerve Wrap
10.3.2. Nerve Protector
10.3.3. Nerve Connector
10.3.4. Nerve Graft
10.4. Market Attractiveness Analysis By Product
11. Global Market Analysis 2015-2021 and Forecast 2022–2032, By Application
11.1. Introduction / Key Findings
11.2. Historical Market Size (US$ Mn) Analysis By , 2015-2021
11.3. Current and Future Market Size (US$ Mn) Analysis By , 2022–2032
11.3.1. Epineural Nerve Repair
11.3.2. Perineural Nerve Repair
11.3.3. Fascicular Nerve Repair
11.4. Market Attractiveness Analysis By Type
12. Global Market Analysis 2015-2021 and Forecast 2022–2032, By End User
12.1. Introduction / Key Findings
12.2. Historical Market Size (US$ Mn) Analysis, By End User, 2015-2021
12.3. Current and Future Market Size (US$ Mn) Analysis By End User, 2022–2032
12.3.1. Hospitals
12.3.2. Ambulatory Surgical Centers
12.3.3. Specialty Clinics
12.4. Market Attractiveness Analysis By End User
13. Global Market Analysis 2015-2021 and Forecast 2022–2032, By Region
13.1. Introduction
13.2. Historical Market Size (US$ Mn) and Volume (Units) Analysis By Region, 2015-2021
13.3. Current and Future Market Size (US$ Mn) and Volume (Units) Analysis By Region, 2022–2032
13.3.1. North America
13.3.2. Latin America
13.3.3. Europe
13.3.4. East Asia
13.3.5. South Asia
13.3.6. Oceania
13.3.7. Middle East and Africa (MEA)
13.4. Market Attractiveness Analysis By Region
14. North America Market Analysis 2015-2021 and Forecast 2022–2032
14.1. Introduction
14.2. Historical Market Size (US$ Mn) and Volume (Units) Analysis, By Market Taxonomy, 2015-2021
14.3. Current and Future Market Size (US$ Mn) and Volume (Units) Analysis, By Market Taxonomy 2022–2032
14.3.1. By Country
14.3.1.1. U.S.
14.3.1.2. Canada
14.3.2. By Product
14.3.3. By Nerve Repair
14.3.4. By End User
14.4. Market Attractiveness Analysis
14.4.1. By Country
14.4.2. By Product
14.4.3. By Nerve Repair
14.4.4. By End User
14.5. Market Trends
14.6. Key Market Participants - Intensity Mapping
14.7. Drivers and Restraints - Impact Analysis
14.8. Country Level Analysis & Forecast
14.8.1. U.S. Market Analysis
14.8.1.1. .Introduction
14.8.1.2. Market Analysis and Forecast by Market Taxonomy
14.8.1.2.1. By Product
14.8.1.2.2. By Nerve Repair
14.8.1.2.3. By End User
14.8.2. Canada Market Analysis
14.8.2.1. Introduction
14.8.2.2. Market Analysis and Forecast by Market Taxonomy
14.8.2.2.1. By Product
14.8.2.2.2. By Nerve Repair
14.8.2.2.3. By End User
15. Latin America Market Analysis 2015-2021 and Forecast 2022–2032
15.1. Introduction
15.2. Historical Market Size (US$ Mn) and Volume (Units) Analysis By Market Taxonomy, 2015-2021
15.3. Current and Future Market Size (US$ Mn) and Volume (Units) Analysis, By Market Taxonomy, 2022–2032
15.3.1. By Country
15.3.1.1. Mexico
15.3.1.2. Brazil
15.3.1.3. Argentina
15.3.1.4. Rest of Latin America
15.3.2. By Product
15.3.3. By Nerve Repair
15.3.4. By End User
15.4. Market Attractiveness Analysis
15.4.1. By Country
15.4.2. By Product
15.4.3. By Nerve Repair
15.4.4. By End User
15.5. Market Trends
15.6. Key Market Participants - Intensity Mapping
15.7. Drivers and Restraints - Impact Analysis
15.8. Country Level Analysis & Forecast
15.8.1. Mexico Market Analysis
15.8.1.1. Introduction
15.8.1.2. Market Analysis and Forecast by Market Taxonomy
15.8.1.2.1. By Product
15.8.1.2.2. By Nerve Repair
15.8.1.2.3. By End User
15.8.2. Brazil Market Analysis
15.8.2.1. Introduction
15.8.2.2. Market Analysis and Forecast by Market Taxonomy
15.8.2.2.1. By Product
15.8.2.2.2. By Nerve Repair
15.8.2.2.3. By End User
15.8.3. Argentina Market Analysis
15.8.3.1. Introduction
15.8.3.2. Market Analysis and Forecast by Market Taxonomy
15.8.3.2.1. By Product
15.8.3.2.2. By Nerve Repair
15.8.3.2.3. By End User
16. Europe Market Analysis 2015-2021 and Forecast 2022–2032
16.1. Introduction
16.2. Historical Market Size (US$ Mn) and Volume (Units) Analysis, By Market Taxonomy, 2015-2021
16.3. Current and Future Market Size (US$ Mn) and Volume (Units) Analysis, By Market Taxonomy, 2022–2032
16.3.1. By Country
16.3.1.1. Germany
16.3.1.2. Italy
16.3.1.3. France
16.3.1.4. U.K.
16.3.1.5. Spain
16.3.1.6. BENELUX
16.3.1.7. Russia
16.3.1.8. Rest of Europe
16.3.2. By Product
16.3.3. By Nerve Repair
16.3.4. By End User
16.4. Market Attractiveness Analysis
16.4.1. By Country
16.4.2. By Product
16.4.3. By Nerve Repair
16.4.4. By End User
16.5. Market Trends
16.6. Key Market Participants - Intensity Mapping
16.7. Drivers and Restraints - Impact Analysis
16.8. Country Level Analysis & Forecast
16.8.1. Germany Market Analysis
16.8.1.1. Introduction
16.8.1.2. Market Analysis and Forecast by Market Taxonomy
16.8.1.2.1. By Product
16.8.1.2.2. By Nerve Repair
16.8.1.2.3. By End User
16.8.2. Italy Market Analysis
16.8.2.1. Introduction
16.8.2.2. Market Analysis and Forecast by Market Taxonomy
16.8.2.2.1. By Product
16.8.2.2.2. By Nerve Repair
16.8.2.2.3. By End User
16.8.3. France Market Analysis
16.8.3.1. Introduction
16.8.3.2. Market Analysis and Forecast by Market Taxonomy
16.8.3.2.1. By Product
16.8.3.2.2. By Nerve Repair
16.8.3.2.3. By End User
16.8.4. U.K. Market Analysis
16.8.4.1. Introduction
16.8.4.2. Market Analysis and Forecast by Market Taxonomy
16.8.4.2.1. By Product
16.8.4.2.2. By Nerve Repair
16.8.4.2.3. By End User
16.8.5. Spain Market Analysis
16.8.5.1. Introduction
16.8.5.2. Market Analysis and Forecast by Market Taxonomy
16.8.5.2.1. By Product
16.8.5.2.2. By Nerve Repair
16.8.5.2.3. By End User
16.8.6. BENELUX Market Analysis
16.8.6.1. Introduction
16.8.6.2. Market Analysis and Forecast by Market Taxonomy
16.8.6.2.1. By Product
16.8.6.2.2. By Nerve Repair
16.8.6.2.3. By End User
16.8.7. Russia Market Analysis
16.8.7.1. Introduction
16.8.7.2. Market Analysis and Forecast by Market Taxonomy
16.8.7.2.1. By Product
16.8.7.2.2. By Nerve Repair
16.8.7.2.3. By End User
17. South Asia Market Analysis 2015-2021 and Forecast 2022–2032
17.1. Introduction
17.2. Historical Market Size (US$ Mn) and Volume (Units) Analysis By Market Taxonomy, 2015-2021
17.3. Current and Future Market Size (US$ Mn) and Volume (Units) Analysis, By Market Taxonomy, 2022–2032
17.3.1. By Country
17.3.1.1. India
17.3.1.2. Indonesia
17.3.1.3. Malaysia
17.3.1.4. Thailand
17.3.1.5. Rest of South Asia
17.3.2. By Product
17.3.3. By Nerve Repair
17.3.4. By End User
17.4. Market Attractiveness Analysis
17.4.1. By Country
17.4.2. By Product
17.4.3. By Nerve Repair
17.4.4. By End User
17.5. Market Trends
17.6. Key Market Participants - Intensity Mapping
17.7. Drivers and Restraints - Impact Analysis
17.8. Country Level Analysis & Forecast
17.8.1. India Market Analysis
17.8.1.1. Introduction
17.8.1.2. Market Analysis and Forecast by Market Taxonomy
17.8.1.2.1. By Product
17.8.1.2.2. By Nerve Repair
17.8.1.2.3. By End User
17.8.2. Indonesia Market Analysis
17.8.2.1. Introduction
17.8.2.2. Market Analysis and Forecast by Market Taxonomy
17.8.2.2.1. By Product
17.8.2.2.2. By Nerve Repair
17.8.2.2.3. By End User
17.8.3. Malaysia Market Analysis
17.8.3.1. Introduction
17.8.3.2. Market Analysis and Forecast by Market Taxonomy
17.8.3.2.1. By Product
17.8.3.2.2. By Nerve Repair
17.8.3.2.3. By End User
17.8.4. Thailand Market Analysis
17.8.4.1. Introduction
17.8.4.2. Market Analysis and Forecast by Market Taxonomy
17.8.4.2.1. By Product
17.8.4.2.2. By Nerve Repair
17.8.4.2.3. By End User
18. East Asia Market Analysis 2015-2021 and Forecast 2022–2032
18.1. Introduction
18.2. Historical Market Size (US$ Mn) and Volume (Units) Analysis By Market Taxonomy, 2015-2021
18.3. Current and Future Market Size (US$ Mn) and Volume (Units) Analysis, By Market Taxonomy, 2022–2032
18.3.1. By Country
18.3.1.1. China
18.3.1.2. Japan
18.3.1.3. South Korea
18.3.2. By Product
18.3.3. By Nerve Repair
18.3.4. By End User
18.4. Market Attractiveness Analysis
18.4.1. By Country
18.4.2. By Product
18.4.3. By Nerve Repair
18.4.4. By End User
18.5. Market Trends
18.6. Key Market Participants - Intensity Mapping
18.7. Drivers and Restraints - Impact Analysis
18.8. Country Level Analysis & Forecast
18.8.1. China Market Analysis
18.8.1.1. Introduction
18.8.1.2. Market Analysis and Forecast by Market Taxonomy
18.8.1.2.1. By Product
18.8.1.2.2. By Nerve Repair
18.8.1.2.3. By End User
18.8.2. Japan Market Analysis
18.8.2.1. Introduction
18.8.2.2. Market Analysis and Forecast by Market Taxonomy
18.8.2.2.1. By Product
18.8.2.2.2. By Nerve Repair
18.8.2.2.3. By End User
18.8.3. South Korea Market Analysis
18.8.3.1. Introduction
18.8.3.2. Market Analysis and Forecast by Market Taxonomy
18.8.3.2.1. By Product
18.8.3.2.2. By Nerve Repair
18.8.3.2.3. By End User
19. Oceania Market 2015-2021 and Forecast 2022-2032
19.1. Introduction
19.2. Historical Market Size (US$ Mn) and Volume (Units) Analysis By Market Taxonomy, 2015-2021
19.3. Current and Future Market Size (US$ Mn) and Volume (Units) Analysis, By Market Taxonomy, 2022–2032
19.3.1. By Country
19.3.1.1. Australia
19.3.1.2. New Zealand
19.3.2. By Product
19.3.3. By Nerve Repair
19.3.4. By End User
19.4. Market Attractiveness Analysis
19.4.1. By Country
19.4.2. By Product
19.4.3. By Nerve Repair
19.4.4. By End User
19.5. Market Trends
19.6. Key Market Participants - Intensity Mapping
19.7. Drivers and Restraints - Impact Analysis
19.8. Country Level Analysis & Forecast
19.8.1. Australia Market Analysis
19.8.1.1. Introduction
19.8.1.2. Market Analysis and Forecast by Market Taxonomy
19.8.1.2.1. By Product
19.8.1.2.2. By Nerve Repair
19.8.1.2.3. By End User
19.8.2. New Zealand Market Analysis
19.8.2.1. Introduction
19.8.2.2. Market Analysis and Forecast by Market Taxonomy
19.8.2.2.1. By Product
19.8.2.2.2. By Nerve Repair
19.8.2.2.3. By End User
20. Middle East and Africa (MEA) Market Analysis 2015-2021 and Forecast 2022–2032
20.1. Introduction
20.2. Historical Market Size (US$ Mn) and Volume (Units) Analysis By Market Taxonomy, 2015-2021
20.3. Current and Future Market Size (US$ Mn) and Volume (Units) Analysis, By Market Taxonomy, 2022–2032
20.3.1. By Country
20.3.1.1. GCC Countries
20.3.1.2. South Africa
20.3.1.3. North Africa
20.3.1.4. Turkey
20.3.1.5. Rest of Middle East and Africa
20.4. By Product
20.5. By Nerve Repair
20.6. By End User
20.7. Market Attractiveness Analysis
20.7.1. By Country
20.7.2. By Product
20.7.3. By Nerve Repair
20.7.4. By End User
20.8. Market Trends
20.9. Key Market Participants - Intensity Mapping
20.10. Drivers and Restraints - Impact Analysis
20.11. Country Level Analysis & Forecast
20.11.1. GCC Countries Market Analysis
20.11.1.1. Introduction
20.11.1.2. Market Analysis and Forecast by Market Taxonomy
20.11.1.2.1. By Product
20.11.1.2.2. By Nerve Repair
20.11.1.2.3. By End User
20.11.2. Turkey Market Analysis
20.11.2.1. Introduction
20.11.2.2. Market Analysis and Forecast by Market Taxonomy
20.11.2.2.1. By Product
20.11.2.2.2. By Nerve Repair
20.11.2.2.3. By End User
20.11.3. South Africa Market Analysis
20.11.3.1. Introduction
20.11.3.2. Market Analysis and Forecast by Market Taxonomy
20.11.3.2.1. By Product
20.11.3.2.2. By Nerve Repair
20.11.3.2.3. By End User
20.11.4. North Africa Market Analysis
20.11.4.1. Introduction
20.11.4.2. Market Analysis and Forecast by Market Taxonomy
20.11.4.2.1. By Product
20.11.4.2.2. By Nerve Repair
20.11.4.2.3. By End User
21. Market Structure Analysis
21.1. Market Analysis by Tier of Companies
21.2. Market Share Analysis of Top Players
21.3. Market Presence Analysis
21.3.1. By Regional footprint of Players
21.3.2. Product footprint by Players
21.3.3. Channel Foot Print by Players
22. Competition Analysis
22.1. Competition Dashboard
22.2. Competition Benchmarking
22.3. Competition Deep Dive (Tentative List)
22.3.1. Axogen Inc.
22.3.1.1. Overview
22.3.1.2. Product Portfolio
22.3.1.3. Key Financials
22.3.1.4. SWOT Analysis
22.3.1.5. Sales Footprint
22.3.1.6. Key developments
22.3.1.7. Strategy Overview
22.3.1.7.1. Marketing Strategies
22.3.1.7.2. Channel Strategies
22.3.2. Stryker Corporation
22.3.2.1. Overview
22.3.2.2. Product Portfolio
22.3.2.3. Key Financials
22.3.2.4. SWOT Analysis
22.3.2.5. Sales Footprint
22.3.2.6. Key developments
22.3.2.7. Strategy Overview
22.3.2.7.1. Marketing Strategies
22.3.2.7.2. Channel Strategies
22.3.3. Baxter International Inc.
22.3.3.1. Overview
22.3.3.2. Product Portfolio
22.3.3.3. Key Financials
22.3.3.4. SWOT Analysis
22.3.3.5. Sales Footprint
22.3.3.6. Key developments
22.3.3.7. Strategy Overview
22.3.3.7.1. Marketing Strategies
22.3.3.7.2. Channel Strategies
22.3.4. Integra Lifesciences Holdings Corp
22.3.4.1. Overview
22.3.4.2. Product Portfolio
22.3.4.3. Key Financials
22.3.4.4. SWOT Analysis
22.3.4.5. Sales Footprint
22.3.4.6. Key developments
22.3.4.7. Strategy Overview
22.3.4.7.1. Marketing Strategies
22.3.4.7.2. Channel Strategies
22.3.5. Neurotex Ltd
22.3.5.1. Overview
22.3.5.2. Product Portfolio
22.3.5.3. Key Financials
22.3.5.4. SWOT Analysis
22.3.5.5. Sales Footprint
22.3.5.6. Key developments
22.3.5.7. Strategy Overview
22.3.5.7.1. Marketing Strategies
22.3.5.7.2. Channel Strategies
22.3.6. Polyganics B.V.
22.3.6.1. Overview
22.3.6.2. Product Portfolio
22.3.6.3. Key Financials
22.3.6.4. SWOT Analysis
22.3.6.5. Sales Footprint
22.3.6.6. Key developments
22.3.6.7. Strategy Overview
22.3.6.7.1. Marketing Strategies
22.3.6.7.2. Channel Strategies
22.3.7. Abbott Laboratories
22.3.7.1. Overview
22.3.7.2. Product Portfolio
22.3.7.3. Key Financials
22.3.7.4. SWOT Analysis
22.3.7.5. Sales Footprint
22.3.7.6. Key developments
22.3.7.7. Strategy Overview
22.3.7.7.1. Marketing Strategies
22.3.7.7.2. Channel Strategies
22.3.8. Boston Scientific Inc
22.3.8.1. Overview
22.3.8.2. Product Portfolio
22.3.8.3. Key Financials
22.3.8.4. SWOT Analysis
22.3.8.5. Sales Footprint
22.3.8.6. Key developments
22.3.8.7. Strategy Overview
22.3.8.7.1. Marketing Strategies
22.3.8.7.2. Channel Strategies
22.3.9. Medtronic Plc
22.3.9.1. Overview
22.3.9.2. Product Portfolio
22.3.9.3. Key Financials
22.3.9.4. SWOT Analysis
22.3.9.5. Sales Footprint
22.3.9.6. Key developments
22.3.9.7. Strategy Overview
22.3.9.7.1. Marketing Strategies
22.3.9.7.2. Channel Strategies
22.3.10. Checkpoint Surgical
22.3.10.1. Overview
22.3.10.2. Product Portfolio
22.3.10.3. Key Financials
22.3.10.4. SWOT Analysis
22.3.10.5. Sales Footprint
22.3.10.6. Key developments
22.3.10.7. Strategy Overview
22.3.10.7.1. Marketing Strategies
22.3.10.7.2. Channel Strategies
22.3.11. Polyganics
22.3.11.1. Overview
22.3.11.2. Product Portfolio
22.3.11.3. Key Financials
22.3.11.4. SWOT Analysis
22.3.11.5. Sales Footprint
22.3.11.6. Key developments
22.3.11.7. Strategy Overview
22.3.11.7.1. Marketing Strategies
22.3.11.7.2. Channel Strategies
22.3.12. Synovis Micro Companies Alliance
22.3.12.1. Overview
22.3.12.2. Product Portfolio
22.3.12.3. Key Financials
22.3.12.4. SWOT Analysis
22.3.12.5. Sales Footprint
22.3.12.6. Key developments
22.3.12.7. Strategy Overview
22.3.12.7.1. Marketing Strategies
22.3.12.7.2. Channel Strategies
22.3.13. Orthomed, Inc
22.3.13.1. Overview
22.3.13.2. Product Portfolio
22.3.13.3. Key Financials
22.3.13.4. SWOT Analysis
22.3.13.5. Sales Footprint
22.3.13.6. Key developments
22.3.13.7. Strategy Overview
22.3.13.7.1. Marketing Strategies
22.3.13.7.2. Channel Strategies
23. Assumptions and Acronyms Used
24. Research Methodology
Let us know your requirement to get
100% FREE customization
List of Tables
Table 01: Global Market Value (US$ Mn) Analysis and Forecast 2015–2032, by Product
Table 02: Global Market Volume (Units) Analysis and Forecast 2015–2032, by Product
Table 03: Global Market Value (US$ Mn) Analysis and Forecast 2015–2032, by Nerve Repair
Table 04: Global Market Value (US$ Mn) Analysis and Forecast 2015–2032, by End User
Table 05: Global Market Value (US$ Mn) Analysis and Forecast 2015–2032, by Region
Table 06: North America Market Value (US$ Mn) Analysis 2015-2021 and Forecast 2022–2032, by Country
Table 07: North America Market Value (US$ Mn) Analysis and Forecast 2015–2032, by Product
Table 08: North America Market Volume (Units) Analysis and Forecast 2015–2032, by Product
Table 09: North America Market Value (US$ Mn) Analysis and Forecast 2015–2032, by Nerve Repair
Table 10: North America Market Value (US$ Mn) Analysis and Forecast 2015–2032, by End User
Table 11: Latin America Market Value (US$ Mn) Analysis 2015-2021 and Forecast 2022–2032, by Country
Table 12: Latin America Market Value (US$ Mn) Analysis and Forecast 2015–2032, by Product
Table 13: Latin America Market Volume (Units) Analysis and Forecast 2015–2032, by Product
Table 14: Latin America Market Value (US$ Mn) Analysis and Forecast 2015–2032, by Nerve Repair
Table 15: Latin America Market Value (US$ Mn) Analysis and Forecast 2015–2032, by End User
Table 16: Europe Market Value (US$ Mn) Analysis 2015-2021 and Forecast 2022–2032, by Country
Table 17: Europe Market Value (US$ Mn) Analysis and Forecast 2015–2032, by Product
Table 18: Europe Market Volume (Units) Analysis and Forecast 2015–2032, by Product
Table 19: Europe Market Value (US$ Mn) Analysis and Forecast 2015–2032, by Nerve Repair
Table 20: Europe Market Value (US$ Mn) Analysis and Forecast 2015–2032, by End User
Table 21: South Asia Market Value (US$ Mn) Analysis 2015-2021 and Forecast 2022–2032, by Country
Table 22: South Asia Market Value (US$ Mn) Analysis and Forecast 2015–2032, by Product
Table 23: South Asia Market Volume (Units) Analysis and Forecast 2015–2032, by Product
Table 24: South Asia Market Value (US$ Mn) Analysis and Forecast 2015–2032, by Nerve Repair
Table 25: South Asia Market Value (US$ Mn) Analysis and Forecast 2015–2032, by End User
Table 26: East Asia Market Value (US$ Mn) Analysis 2015-2021 and Forecast 2022–2032, by Country
Table 27: East Asia Market Value (US$ Mn) Analysis and Forecast 2015–2032, by Product
Table 28: East Asia Market Volume (Units) Analysis and Forecast 2015–2032, by Product
Table 29: East Asia Market Value (US$ Mn) Analysis and Forecast 2015–2032, by Nerve Repair
Table 30: East Asia Market Value (US$ Mn) Analysis and Forecast 2015–2032, by End User
Table 31: Oceania Market Value (US$ Mn) Analysis 2015-2021 and Forecast 2022–2032, by Country
Table 32: Oceania Market Value (US$ Mn) Analysis and Forecast 2015–2032, by Product
Table 33: Oceania Market Volume (Units) Analysis and Forecast 2015–2032, by Product
Table 34: Oceania Market Value (US$ Mn) Analysis and Forecast 2015–2032, by Nerve Repair
Table 35: Oceania Market Value (US$ Mn) Analysis and Forecast 2015–2032, by End User
Table 36: MEA Market Value (US$ Mn) Analysis 2015-2021 and Forecast 2022–2032, by Country
Table 37: MEA Market Value (US$ Mn) Analysis and Forecast 2015–2032, by Product
Table 38: MEA Market Volume (Units) Analysis and Forecast 2015–2032, by Product
Table 39: MEA Market Value (US$ Mn) Analysis and Forecast 2015–2032, by Nerve Repair
Table 40: MEA Market Value (US$ Mn) Analysis and Forecast 2015–2032, by End User
Find your sweet spots for generating winning opportunities in this market.
Talk to AnalystList of Charts
Figure 01: Global Market Volume (Units), 2015 – 2021
Figure 02: Global Market Volume (Units) & Y-o-Y Growth (%) Analysis, 2022–2032
Figure 03: Nerve Repair, Pricing Analysis per unit (US$), in 2022
Figure 04: Nerve Repair, Pricing Forecast per unit (US$), in 2032
Figure 05: Global Market Value (US$ Mn) Analysis, 2015–2021
Figure 06: Global Market Forecast & Y-o-Y Growth, 2022–2032
Figure 07: Global Market Absolute $ Opportunity (US$ Mn) Analysis, 2021–2032
Figure 08: Global Market Value Share (%) Analysis 2022 and 2032, by Product
Figure 09: Global Market Y-o-Y Growth (%) Analysis 2021-2032, by Product
Figure 10: Global Market Attractiveness Analysis 2022–2032, by Product
Figure 11: Global Market Value Share (%) Analysis 2022 and 2032, by Nerve Repair
Figure 12: Global Market Y-o-Y Growth (%) Analysis 2021-2032, by Nerve Repair
Figure 13: Global Market Attractiveness Analysis 2022–2032, by Nerve Repair
Figure 14: Global Market Value Share (%) Analysis 2022 and 2032, by End User
Figure 15: Global Market Y-o-Y Growth (%) Analysis 2021-2032, by End User
Figure 16: Global Market Attractiveness Analysis 2022–2032, by End User
Figure 17: Global Market Value Share (%) Analysis 2022 and 2032, by Region
Figure 18: Global Market Y-o-Y Growth (%) Analysis 2021-2032, by Region
Figure 19: Global Market Attractiveness Analysis 2022–2032, by Region
Figure 20: North America Market Value (US$ Mn) Analysis, 2015–2021
Figure 21: North America Market Value (US$ Mn) Forecast, 2022-2032
Figure 22: North America Market Value Share, by Product (2022 E)
Figure 23: North America Market Value Share, by (2022 E)
Figure 24: North America Market Value Share, by End User (2022 E)
Figure 25: North America Market Value Share, by Country (2022 E)
Figure 26: North America Market Attractiveness Analysis by Product, 2022–2032
Figure 27: North America Market Attractiveness Analysis by Nerve Repair, 2022–2032
Figure 28: North America Market Attractiveness Analysis by End User, 2022–2032
Figure 29: North America Market Attractiveness Analysis by Country, 2022–2032
Figure 30: U.S. Market Value Proportion Analysis, 2021
Figure 31: Global Vs. U.S. Growth Comparison
Figure 32: U.S. Market Share Analysis (%) by Product, 2021 & 2032
Figure 33: U.S. Market Share Analysis (%) by Nerve Repair, 2021 & 2032
Figure 34: U.S. Market Share Analysis (%) by End User, 2021 & 2032
Figure 35: Canada Market Value Proportion Analysis, 2021
Figure 36: Global Vs. Canada. Growth Comparison
Figure 37: Canada Market Share Analysis (%) by Product, 2021 & 2032
Figure 38: Canada Market Share Analysis (%) by Nerve Repair, 2021 & 2032
Figure 39: Canada Market Share Analysis (%) by End User, 2021 & 2032
Figure 40: Latin America Market Value (US$ Mn) Analysis, 2015–2021
Figure 41: Latin America Market Value (US$ Mn) Forecast, 2022-2032
Figure 42: Latin America Market Value Share, by Product (2022 E)
Figure 43: Latin America Market Value Share, by (2022 E)
Figure 44: Latin America Market Value Share, by End User (2022 E)
Figure 45: Latin America Market Value Share, by Country (2022 E)
Figure 46: Latin America Market Attractiveness Analysis by Product, 2022–2032
Figure 47: Latin America Market Attractiveness Analysis by Nerve Repair, 2022–2032
Figure 48: Latin America Market Attractiveness Analysis by End User, 2022–2032
Figure 49: Latin America Market Attractiveness Analysis by Country, 2022–2032
Figure 50: Mexico Market Value Proportion Analysis, 2021
Figure 51: Global Vs Mexico Growth Comparison
Figure 52: Mexico Market Share Analysis (%) by Product, 2021 & 2032
Figure 53: Mexico Market Share Analysis (%) by Nerve Repair, 2021 & 2032
Figure 54: Mexico Market Share Analysis (%) by End User, 2021 & 2032
Figure 55: Brazil Market Value Proportion Analysis, 2021
Figure 56: Global Vs. Brazil. Growth Comparison
Figure 57: Brazil Market Share Analysis (%) by Product, 2021 & 2032
Figure 58: Brazil Market Share Analysis (%) by Nerve Repair, 2021 & 2032
Figure 59: Brazil Market Share Analysis (%) by End User, 2021 & 2032
Figure 60: Argentina Market Value Proportion Analysis, 2021
Figure 61: Global Vs Argentina Growth Comparison
Figure 62: Argentina Market Share Analysis (%) by Product, 2021 & 2032
Figure 63: Argentina Market Share Analysis (%) by Nerve Repair, 2021 & 2032
Figure 64: Argentina Market Share Analysis (%) by End User, 2021 & 2032
Figure 65: Europe Market Value (US$ Mn) Analysis, 2015–2021
Figure 66: Europe Market Value (US$ Mn) Forecast, 2022-2032
Figure 67: Europe Market Value Share, by Product (2022 E)
Figure 68: Europe Market Value Share, by (2022 E)
Figure 69: Europe Market Value Share, by End User (2022 E)
Figure 70: Europe Market Value Share, by Country (2022 E)
Figure 71: Europe Market Attractiveness Analysis by Product, 2022–2032
Figure 72: Europe Market Attractiveness Analysis by Nerve Repair, 2022–2032
Figure 73: Europe Market Attractiveness Analysis by End User, 2022–2032
Figure 74: Europe Market Attractiveness Analysis by Country, 2022–2032
Figure 75: UK Market Value Proportion Analysis, 2021
Figure 76: Global Vs. UK Growth Comparison
Figure 77: UK Market Share Analysis (%) by Product, 2021 & 2032
Figure 78: UK Market Share Analysis (%) by Nerve Repair, 2021 & 2032
Figure 79: UK Market Share Analysis (%) by End User, 2021 & 2032
Figure 80: Germany Market Value Proportion Analysis, 2021
Figure 81: Global Vs. Germany Growth Comparison
Figure 82: Germany Market Share Analysis (%) by Product, 2021 & 2032
Figure 83: Germany Market Share Analysis (%) by Nerve Repair, 2021 & 2032
Figure 84: Germany Market Share Analysis (%) by End User, 2021 & 2032
Figure 85: Italy Market Value Proportion Analysis, 2021
Figure 86: Global Vs. Italy Growth Comparison
Figure 87: Italy Market Share Analysis (%) by Product, 2021 & 2032
Figure 88: Italy Market Share Analysis (%) by Nerve Repair, 2021 & 2032
Figure 89: Italy Market Share Analysis (%) by End User, 2021 & 2032
Figure 90: France Market Value Proportion Analysis, 2021
Figure 91: Global Vs France Growth Comparison
Figure 92: France Market Share Analysis (%) by Product, 2021 & 2032
Figure 93: France Market Share Analysis (%) by Nerve Repair, 2021 & 2032
Figure 94: France Market Share Analysis (%) by End User, 2021 & 2032
Figure 95: Spain Market Value Proportion Analysis, 2021
Figure 96: Global Vs Spain Growth Comparison
Figure 97: Spain Market Share Analysis (%) by Product, 2021 & 2032
Figure 98: Spain Market Share Analysis (%) by Nerve Repair, 2021 & 2032
Figure 99: Spain Market Share Analysis (%) by End User, 2021 & 2032
Figure 100: Russia Market Value Proportion Analysis, 2021
Figure 101: Global Vs Russia Growth Comparison
Figure 102: Russia Market Share Analysis (%) by Product, 2021 & 2032
Figure 103: Russia Market Share Analysis (%) by Nerve Repair, 2021 & 2032
Figure 104: Russia Market Share Analysis (%) by End User, 2021 & 2032
Figure 105: BENELUX Market Value Proportion Analysis, 2021
Figure 106: Global Vs BENELUX Growth Comparison
Figure 107: BENELUX Market Share Analysis (%) by Product, 2021 & 2032
Figure 108: BENELUX Market Share Analysis (%) by Nerve Repair, 2021 & 2032
Figure 109: BENELUX Market Share Analysis (%) by End User, 2021 & 2032
Figure 110: East Asia Market Value (US$ Mn) Analysis, 2015–2021
Figure 111: East Asia Market Value (US$ Mn) Forecast, 2022-2032
Figure 112: East Asia Market Value Share, by Product (2022 E)
Figure 113: East Asia Market Value Share, by (2022 E)
Figure 114: East Asia Market Value Share, by End User (2022 E)
Figure 115: East Asia Market Value Share, by Country (2022 E)
Figure 116: East Asia Market Attractiveness Analysis by Product, 2022–2032
Figure 117: East Asia Market Attractiveness Analysis by Nerve Repair, 2022–2032
Figure 118: East Asia Market Attractiveness Analysis by End User, 2022–2032
Figure 119: East Asia Market Attractiveness Analysis by Country, 2022–2032
Figure 120: China Market Value Proportion Analysis, 2021
Figure 121: Global Vs. China Growth Comparison
Figure 122: China Market Share Analysis (%) by Product, 2021 & 2032
Figure 123: China Market Share Analysis (%) by Nerve Repair, 2021 & 2032
Figure 124: China Market Share Analysis (%) by End User, 2021 & 2032
Figure 125: Japan Market Value Proportion Analysis, 2021
Figure 126: Global Vs. Japan Growth Comparison
Figure 127: Japan Market Share Analysis (%) by Product, 2021 & 2032
Figure 128: Japan Market Share Analysis (%) by Nerve Repair, 2021 & 2032
Figure 129: Japan Market Share Analysis (%) by End User, 2021 & 2032
Figure 130: South Korea Market Value Proportion Analysis, 2021
Figure 131: Global Vs South Korea Growth Comparison
Figure 132: South Korea Market Share Analysis (%) by Product, 2021 & 2032
Figure 133: South Korea Market Share Analysis (%) by Nerve Repair, 2021 & 2032
Figure 134: South Korea Market Share Analysis (%) by End User, 2021 & 2032
Figure 135: South Asia Market Value (US$ Mn) Analysis, 2015–2021
Figure 136: South Asia Market Value (US$ Mn) Forecast, 2022-2032
Figure 137: South Asia Market Value Share, by Product (2022 E)
Figure 138: South Asia Market Value Share, by (2022 E)
Figure 139: South Asia Market Value Share, by End User (2022 E)
Figure 140: South Asia Market Value Share, by Country (2022 E)
Figure 141: South Asia Market Attractiveness Analysis by Product, 2022–2032
Figure 142: South Asia Market Attractiveness Analysis by Nerve Repair, 2022–2032
Figure 143: South Asia Market Attractiveness Analysis by End User, 2022–2032
Figure 144: South Asia Market Attractiveness Analysis by Country, 2022–2032
Figure 145: India Market Value Proportion Analysis, 2021
Figure 146: Global Vs. India Growth Comparison
Figure 147: India Market Share Analysis (%) by Product, 2021 & 2032
Figure 148: India Market Share Analysis (%) by Nerve Repair, 2021 & 2032
Figure 149: India Market Share Analysis (%) by End User, 2021 & 2032
Figure 150: Indonesia Market Value Proportion Analysis, 2021
Figure 151: Global Vs. Indonesia Growth Comparison
Figure 152: Indonesia Market Share Analysis (%) by Product, 2021 & 2032
Figure 153: Indonesia Market Share Analysis (%) by Nerve Repair, 2021 & 2032
Figure 154: Indonesia Market Share Analysis (%) by End User, 2021 & 2032
Figure 155: Malaysia Market Value Proportion Analysis, 2021
Figure 156: Global Vs. Malaysia Growth Comparison
Figure 157: Malaysia Market Share Analysis (%) by Product, 2021 & 2032
Figure 158: Malaysia Market Share Analysis (%) by Nerve Repair, 2021 & 2032
Figure 159: Malaysia Market Share Analysis (%) by End User, 2021 & 2032
Figure 160: Thailand Market Value Proportion Analysis, 2021
Figure 161: Global Vs. Thailand Growth Comparison
Figure 162: Thailand Market Share Analysis (%) by Product, 2021 & 2032
Figure 163: Thailand Market Share Analysis (%) by Nerve Repair, 2021 & 2032
Figure 164: Thailand Market Share Analysis (%) by End User, 2021 & 2032
Figure 165: Oceania Market Value (US$ Mn) Analysis, 2015–2021
Figure 166: Oceania Market Value (US$ Mn) Forecast, 2022-2032
Figure 167: Oceania Market Value Share, by Product (2022 E)
Figure 168: Oceania Market Value Share, by (2022 E)
Figure 169: Oceania Market Value Share, by End User (2022 E)
Figure 170: Oceania Market Value Share, by Country (2022 E)
Figure 171: Oceania Market Attractiveness Analysis by Product, 2022–2032
Figure 172: Oceania Market Attractiveness Analysis by Nerve Repair, 2022–2032
Figure 173: Oceania Market Attractiveness Analysis by End User, 2022–2032
Figure 174: Oceania Market Attractiveness Analysis by Country, 2022–2032
Figure 175: Australia Market Value Proportion Analysis, 2021
Figure 176: Global Vs. Australia Growth Comparison
Figure 177: Australia Market Share Analysis (%) by Product, 2021 & 2032
Figure 178: Australia Market Share Analysis (%) by Nerve Repair, 2021 & 2032
Figure 179: Australia Market Share Analysis (%) by End User, 2021 & 2032
Figure 180: New Zealand Market Value Proportion Analysis, 2021
Figure 181: Global Vs New Zealand Growth Comparison
Figure 182: New Zealand Market Share Analysis (%) by Product, 2021 & 2032
Figure 183: New Zealand Market Share Analysis (%) by Nerve Repair, 2021 & 2032
Figure 184: New Zealand Market Share Analysis (%) by End User, 2021 & 2032
Figure 185: Middle East & Africa Market Value (US$ Mn) Analysis, 2015–2021
Figure 186: Middle East & Africa Market Value (US$ Mn) Forecast, 2022-2032
Figure 187: Middle East & Africa Market Value Share, by Product (2022 E)
Figure 188: Middle East & Africa Market Value Share, by (2022 E)
Figure 189: Middle East & Africa Market Value Share, by End User (2022 E)
Figure 190: Middle East & Africa Market Value Share, by Country (2022 E)
Figure 191: Middle East & Africa Market Attractiveness Analysis by Product, 2022–2032
Figure 192: Middle East & Africa Market Attractiveness Analysis by Nerve Repair, 2022–2032
Figure 193: Middle East & Africa Market Attractiveness Analysis by End User, 2022–2032
Figure 194: Middle East & Africa Market Attractiveness Analysis by Country, 2022–2032
Figure 195: GCC Countries Market Value Proportion Analysis, 2021
Figure 196: Global Vs GCC Countries Growth Comparison
Figure 197: GCC Countries Market Share Analysis (%) by Product, 2021 & 2032
Figure 198: GCC Countries Market Share Analysis (%) by Nerve Repair, 2021 & 2032
Figure 199: GCC Countries Market Share Analysis (%) by End User, 2021 & 2032
Figure 200: Turkey Market Value Proportion Analysis, 2021
Figure 201: Global Vs. Turkey Growth Comparison
Figure 202: Turkey Market Share Analysis (%) by Product, 2021 & 2032
Figure 203: Turkey Market Share Analysis (%) by Nerve Repair, 2021 & 2032
Figure 204: Turkey Market Share Analysis (%) by End User, 2021 & 2032
Figure 205: South Africa Market Value Proportion Analysis, 2021
Figure 206: Global Vs. South Africa Growth Comparison
Figure 207: South Africa Market Share Analysis (%) by Product, 2021 & 2032
Figure 208: South Africa Market Share Analysis (%) by Nerve Repair, 2021 & 2032
Figure 209: South Africa Market Share Analysis (%) by End User, 2021 & 2032
Figure 210: North Africa Market Value Proportion Analysis, 2021
Figure 211: Global Vs North Africa Growth Comparison
Figure 212: North Africa Market Share Analysis (%) by Product, 2021 & 2032
Figure 213: North Africa Market Share Analysis (%) by Nerve Repair, 2021 & 2032
Figure 214: North Africa Market Share Analysis (%) by End User, 2021 & 2032
Need specific information?
Request CustomizationExplore Healthcare Insights
View Reports