The electronic equipment repair service market has been growing steadily. This growth is driven by concerns about electronic waste and the need to make devices last longer. In 2024, the market was valued at around USD 142.6 billion. It is expected to grow to USD 148.6 billion by 2025. By 2035, the market could reach USD 294.8 billion. This represents a CAGR of 6.8% from 2025 to 2035.
This rise is supported by better repair technologies and more awareness of sustainability. Many service providers now use remote diagnostics, AI-based maintenance, and modular repair kits. Government support and a shift in consumer behavior toward longer product use are also helping the market grow.
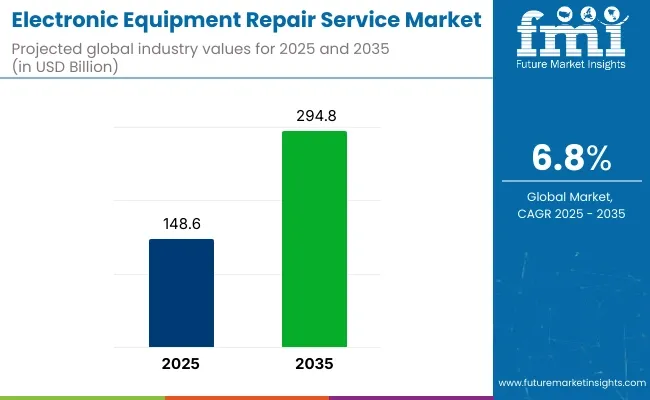
| Metric | Value |
|---|---|
| Industry Size (2025) | USD 148.6 billion |
| Industry Value (2035) | USD 294.8 billion |
| CAGR (2025 to 2035) | 6.8% |
Recent progress includes AI tools for troubleshooting, augmented reality support for repair staff, and easier access to spare parts. Companies such as uBreakiFix and Techy are now using green materials in their services. This change is helping the push toward eco-friendlier repair practices.
The pandemic has made people rely more on electronics for both work and daily life. As a result, many consumers and businesses now choose to repair their devices instead of buying new ones. Partnerships between OEMs and independent repair shops are becoming stronger. More training centers have also opened to teach the skills needed for this work.
John Meyers, Chief Strategy Officer at GlobalTech Repairs, said, “Repair services are no longer a side operation. They represent a vital sustainability channel and a major revenue stream. Our investments in AI tools and technician training reflect where this market is heading.”
Per capita spending on electronic equipment repair services is growing steadily across global markets, driven by the increasing reliance on consumer electronics and the rising cost of device replacement. In developed regions, established service networks and demand for authorized repairs boost expenditure. Meanwhile, emerging markets are witnessing growing awareness of repair benefits, supported by expanding service providers and digital platforms. This combination of factors is fueling consistent growth in per capita spending on repair services worldwide.
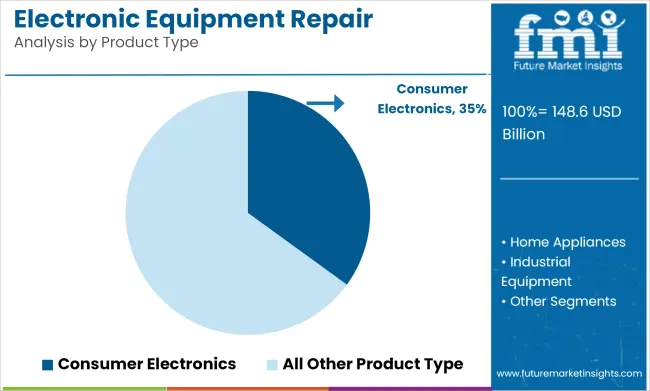
The consumer electronics segment is expected to lead, making up about 35% of the market by 2025. More people now own smartphones, laptops, and tablets. These devices have shorter life cycles, which increases the demand for repair. Rapid growth in cities and increased use of technology in developing countries are adding to this trend. The home appliances segment will likely hold 25% of the market. The rise of smart refrigerators, washing machines, and other smart appliances means there is a growing need for skilled repairs and regular diagnostics.
Industrial equipment is projected to hold about 20% of the market. Factories and automated systems depend on electronics to keep running. When equipment breaks down, it can stop production. That’s why repair services are vital for this sector. IT and Telecom Equipment is expected to make up 15% of the market. As businesses look to cut costs, they are choosing to fix servers, routers, and other systems instead of replacing them.
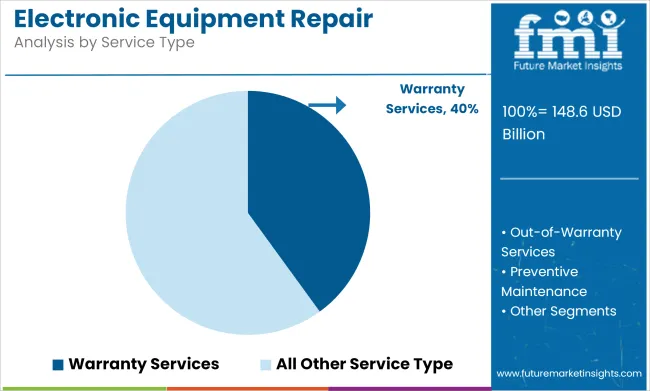
Warranty services are set to lead with 40% of the market by 2025. These services are usually offered by manufacturers or their certified partners. Many buyers also purchase extended warranty packages to protect expensive items. Out-of-Warranty Services will come next, holding a 35% share. As devices get older and fall out of warranty, many people turn to third-party repair shops. These services are often cheaper and more convenient than full replacement.
Preventive maintenance will account for about 15% of the market. This is popular among companies that want to avoid downtime. Tools like smart sensors and AI alerts are helping to make this type of maintenance more common. The Others category, which includes installation, upgrades, and tech consulting, will hold the final 10%. Growth here is driven by smart home systems and modern upgrades to business IT networks.
Challenges
The electronic outfit form service request faces multiple challenges, including the growing complexity of ultramodern bias. As manufacturers integrate advanced technology into electronic products, repairs bear technical chops and tools, adding service costs.
Numerous brands circumscribe third-party repairs, forcing consumers to calculate on precious manufacturer-authorized centers. Also, fake spare corridors and low-quality repairs posture a threat to consumer trust and device life. Chancing professed technicians remains another challenge, as the assiduity requires nonstop upskilling to keep pace with evolving technology.
Opportunities
The request presents significant openings, particularly in the expansion of on-demand and doorstep form services. Consumers decreasingly prefer accessible form results, creating a demand for mobile form units and home service immolations. AI-driven diagnostics and prophetic conservation will revise diligence by enabling briskly and more accurate repairs.
The emergence of eco-friendly form enterprise and the refurbishment request offers economic growth eventuality. Hook-ups between manufacturers and third-party form services will better service availability and quality. The development of online platforms that connect consumers with pukka form technicians will streamline service booking and enhance client satisfaction.
| Country | United States |
|---|---|
| Population (millions) | 345.4 |
| Estimated Per Capita Spending (USD) | 36.80 |
| Country | China |
|---|---|
| Population (millions) | 1,419.3 |
| Estimated Per Capita Spending (USD) | 24.90 |
| Country | Japan |
|---|---|
| Population (millions) | 123.3 |
| Estimated Per Capita Spending (USD) | 32.70 |
| Country | Germany |
|---|---|
| Population (millions) | 84.1 |
| Estimated Per Capita Spending (USD) | 28.50 |
| Country | United Kingdom |
|---|---|
| Population (millions) | 68.3 |
| Estimated Per Capita Spending (USD) | 26.20 |
Country-wise Interpretation
The USA`s USD 12.71 billion electronic outfit form service request grows as consumers and businesses seek cost-effective results over reserves. Demand for smartphone, laptop, and appliance repairs rises, with independent form shops, authorized service centers, and correspondence- services dominating. Right-to-form laws energy assiduity expansion, while sustainability trends push brands toward form-friendly product designs.
China's USD 35.33 billion form service request thrives due to a massive electronics consumer base and rising form demand. Consumers and businesses prioritize cost savings, concluding for refurbished factors and forming services over new purchases. Mobile form capital, e-commerce platforms, and doorstep form services dominate. Government impulses and sustainability pretensions encourage form culture.
Japan’s USD 4.03 billion request benefits from a strong focus on quality repairs for decoration electronics. Consumers prefer manufacturer-certified form services, emphasizing high perfection and original corridors. Convenience drives demand for on-point and pick-up form options. Sustainability mindfulness promotes form over relief, with brands offering extended service guarantees and recycling programs.
Germany’s USD 2.40 billion form service request expands due to strict environmental regulations and a sustainability-driven mind-set. Consumers prioritize durable products and professional form services over disposables. Electronics form chains, manufacturer service centers, and independent technicians play a pivotal part. The EU’s right-to-form legislation strengthens request growth, pushing brands to design fixable bias.
The UK’s USD 1.79 billion electronic repair market experiences growth as consumers embrace cost-effective, sustainable solutions. Smartphone, gaming consoles, and home appliance repairs see high demand. E-waste concerns drive refurbishing trends, with independent repair shops, online booking platforms, and brand-certified centers catering to rising consumer needs. Extended warranties and subscription-based repair services have gained popularity.
The electronic equipment repair market is growing with need for cost-effectiveness, eco-friendliness, and ease over repeated replacement. A poll of 250 USA, UK, EU, and Korea, Japan, Southeast Asia, Chinese, ANZ, and Middle East consumers indicates underlying trends behind service demand and consumer choice.
Affordability becomes a dominant reason, with 70% of the USA sample and 65% of the UK sample selecting repair services as a cost-effective option compared to new acquisition. In Japan and Korea, 60% prefer quality repair service over cheap repair service, and in Southeast Asia and China, 45% prefer affordability and hence opt for local repair shops over authorized centers.
Waste minimization and sustainability drive decision-making, as 55% of EU and 50% of ANZ consumers choose repair services to attain maximum device lifespan and e-waste reduction. But in the Middle East, consumers are more conscious of electronics waste disposal, where 42% of consumers show greater demand for repair services. But in Southeast Asia and China, consumers are only concerned with sustainability for 35%-38%, where other options are still cheaper for low-end electronics.
Brand-certified versus independent repair shops differ by region, and 58% of USA and 54% of UK consumers prefer brand-certified repair shops for greater reliability. Locally owned shops are prevalent in China (62%) and Southeast Asia (59%), where price and convenience are most important. Japan and Korea (50%-52%) prefer brand-authorized repairs because certified engineers and original spare parts assure consumers.
Doorstep repair and online booking are on the rise, with 65% of USA and 60% of Chinese consumers using online booking for convenience. Mail-in repair facilities and on-demand technicians via e-commerce websites are becoming popular in ANZ (55%) and the EU (50%), while walk-in repair centers are the mode of preference in Japan and Korea (48%-50%) because customers want the feel of touch.
With increasing device durability, cost competitiveness, and eco-friendliness driving demand, the electronics repair service business is transforming into web-based booking platforms, OEM-accredited remedies, and store network dominance of penny-pincher segments. Companies are able to ride warranty-pitched repairs, fix-it-as-you-go, and greenwashing promotion to build buyer trust and deepen service networks.
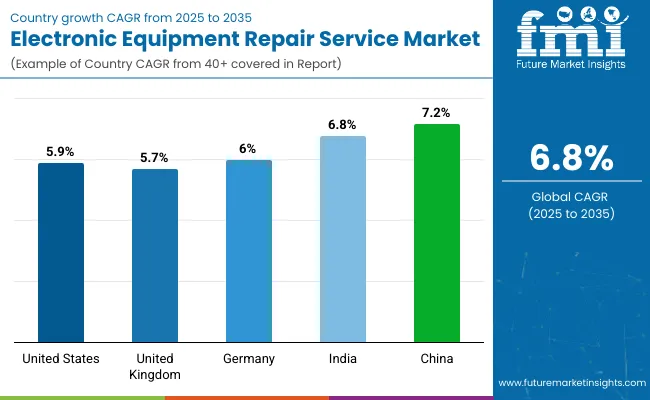
The USA electronic outfit form service request is passing steady growth, driven by adding electronic device power, rising form costs for new bias, and consumer preference for sustainable results. Major players include BreakiFix, Best Buy Geek Squad, and CPR Cell Phone form.
Market Growth Factors
| Country | CAGR (2025 to 2035) |
|---|---|
| United States | 5.9% |
The UK electronic equipment repair service market is expanding due to rising consumer electronics usage, regulatory support for the right to repair, and increasing demand for refurbishment services. Leading companies include iSmash, Timpson, and MendIT.
Market Growth Factors
| Country | CAGR (2025 to 2035) |
|---|---|
| United Kingdom | 5.7% |
Germany’s electronic equipment repair service market is growing, with consumers prioritizing repair-friendly policies, sustainability, and skilled technician services. Key players include MediaMarkt, Saturn, and WERTGARANTIE.
Market Growth Factors
| Country | CAGR (2025 to 2035) |
|---|---|
| Germany | 6.0% |
India’s electronic outfit form service request is witnessing rapid-fire growth, fuelled by adding smartphone and laptop penetration, affordability enterprises, and a rise in organized form networks. Major brands include Urban Clap, Cashify, and Quick Mobile Fix.
Market Growth Factors
| Country | CAGR (2025 to 2035) |
|---|---|
| India | 6.8% |
China’s electronic outfit form service request is expanding significantly, driven by a growing consumer electronics assiduity, demand for ultra expensive device repairs, and government sweats to promote sustainability. Crucial players include Aihuishou, Geek Squad China, and JD Repair.
Market Growth Factors
| Country | CAGR (2025 to 2035) |
|---|---|
| China | 7.2% |
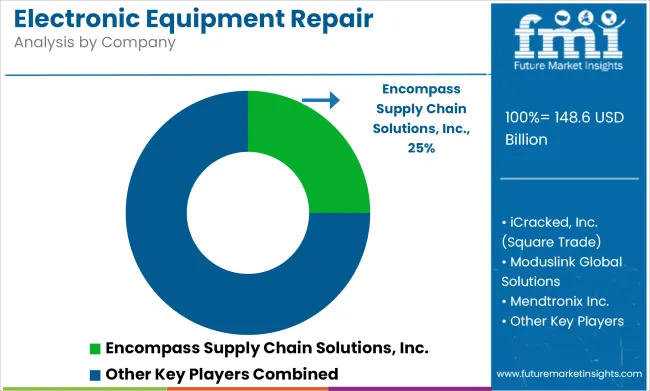
The electronic outfit form service request is largely competitive, with major players operating sanctioned service centers, third- party form shops, and OEM- supported form networks. Companies separate themselves through fast reversal times, access to original spare corridors, and strong client support. The assiduity features a blend of transnational pots, indigenous service providers, and independent form shops, all contending to expand their service networks and client base.
BreakiFix (Asurion LLC) (12-16%)
Break fix is a leader in the B2C (business-to-consumer) member, offering quick form services for smartphones, tablets, laptops, and gaming consoles. The company has strong cooperation with Samsung and Google, furnishing sanctioned form services for their bias. Expansion sweats concentrate on ballot-grounded retail growth and adding client convenience through home form services.
Encompass Supply Chain Solutions (10-14%)
Encompass Supply Chain results operate as a major B2B electronic form service provider, offering OEM- authorized repairs for home appliances, boxes, and IT tackle. The company mates with top manufacturers like Whirlpool, Sony, and LG, expanding its network of service centers and spare corridor distribution channels.
iFixit (8-12%)
Ifixit is a major player in the Right to Repair movement, offering DIY form accoutrements , spare corridor, and educational attendants. It continues to push for legislative changes worldwide, prompting manufacturers to make form tools and factors accessible to consumers. Ifixit is expanding its product range to include laptops, gaming consoles, and home appliances, targeting both individual guests and small form businesses.
Worldwide TechServices (6-10%)
Worldwide techservices specializes in enterprise IT repairs, servicing waiters, data centers, and networking tackle. The company focuses on B2B contracts with Fortune 500 companies, government agencies, and pall service providers. Investing in remote troubleshooting technology and prophetic conservation results is a crucial strategy for growth.
Elec fix Repair Services (4-8%)
Elec fix Repair Services operates in the artificial and medical electronics form sector, fastening on charge-critical diligence like healthcare, aeronautics, and artificial robotization. The company is expanding its AI- driven prophetic conservation results, allowing businesses to identify implicit failures before they do. Unborn growth sweats include expansion into European and Asian requests to meet rising demand for artificial form services.
Other Key Players (40-50% Combined)
Several independent and regional service providers contribute to the electronic equipment repair service market, focusing on specific segments, fast service, and competitive pricing. Notable companies include:
| Report Attributes | Details |
|---|---|
| Current Total Market Size (2025) | USD 148.6 billion |
| Projected Market Size (2035) | USD 294.8 billion |
| CAGR (2025 to 2035) | 6.8% |
| Base Year for Estimation | 2024 |
| Historical Period | 2020 to 2024 |
| Projections Period | 2025 to 2035 |
| Quantitative Units | USD billion for value and million repair jobs for volume |
| Product Types Analyzed (Segment 1) | Consumer Electronics, Home Appliances, Industrial Equipment, IT & Telecom Equipment, Others |
| Service Types Analyzed (Segment 2) | Warranty Services, Out-of-Warranty Services, Preventive Maintenance, Others |
| Sales Channels Analyzed (Segment 3) | Authorized Service Centers, Third-Party Repair Shops, Online Service Booking, Others |
| End Users Analyzed (Segment 4) | Residential, Commercial, Industrial |
| Regions Covered | North America; Latin America; Western Europe; Eastern Europe; South Asia and Pacific; East Asia; Middle East & Africa |
| Countries Covered | United States, Canada, Mexico, Brazil, Argentina, Germany, France, United Kingdom, Italy, Spain, Netherlands, China, India, Japan, South Korea, ANZ, GCC Countries, South Africa |
| Key Players influencing the Electronic Equipment Repair Service Market | Encompass Supply Chain Solutions, Inc., uBreakiFix (Asurion LLC), iCracked, Inc. (Square Trade), Moduslink Global Solutions, Mendtronix Inc., The Cableshoppe Inc. (CSI), Redington Services, Electronix Services Ltd., B2X Care Solutions GmbH, Quest International, Inc. |
| Additional Attributes | Market dynamics of warranty vs out-of-warranty services, Adoption trends of online service booking platforms, Growth in industrial equipment maintenance, Sustainability impact on repair service demand, Regional market growth by end-user segment |
| Customization and Pricing | Customization and Pricing Available on Request |
Consumer Electronics, Home Appliances, Industrial Equipment, IT & Telecom Equipment, and Others.
Warranty Services, Out-of-Warranty Services, Preventive Maintenance, and Others.
Authorized Service Centers, Third-Party Repair Shops, Online Service Booking, and Others.
Residential, Commercial, and Industrial.
North America, Latin America, Europe, South Asia, East Asia, Oceania, and the Middle East & Africa (MEA).
The Electronic Equipment Repair Service industry is projected to witness a CAGR of 6.8% between 2025 and 2035.
The Electronic Equipment Repair Service industry stood at USD 142.5 billion in 2024.
The Electronic Equipment Repair Service industry is anticipated to reach USD 294.8 billion by 2035 end.
South Asia & Pacific is set to record the highest CAGR of 7.2% in the assessment period.
The key players operating in the Electronic Equipment Repair Service industry include uBreakiFix, Geek Squad, iFixit, Encompass Supply Chain Solutions, B2X, and Asurion.


Full Research Suite comprises of:
Market outlook & trends analysis
Interviews & case studies
Strategic recommendations
Vendor profiles & capabilities analysis
5-year forecasts
8 regions and 60+ country-level data splits
Market segment data splits
12 months of continuous data updates
DELIVERED AS:
PDF EXCEL ONLINE
Industry Share & Competitive Positioning in Electronic Equipment Repair Service
Electronic Packaging Adhesives Market Forecast and Outlook 2025 to 2035
Electronic Sealants Market Size and Share Forecast Outlook 2025 to 2035
Electronic Nasal Spray Devices Market Size and Share Forecast Outlook 2025 to 2035
Electronic Expansion Valves Market Size and Share Forecast Outlook 2025 to 2035
Electronics Adhesives Market Size and Share Forecast Outlook 2025 to 2035
Electronic Tactile Tester Market Size and Share Forecast Outlook 2025 to 2035
Electronic Trial Master File (eTMF) System Market Size and Share Forecast Outlook 2025 to 2035
Electronic Wipes Market Size and Share Forecast Outlook 2025 to 2035
Electronic Grade Trisilylamine Market Size and Share Forecast Outlook 2025 to 2035
Electronically Scanned Arrays System Market Size and Share Forecast Outlook 2025 to 2035
Electronics Retailing Market Size and Share Forecast Outlook 2025 to 2035
Electronic Dictionary Market Size and Share Forecast Outlook 2025 to 2035
Electronic Shelf Label Market Analysis - Size, Share, and Forecast Outlook 2025 to 2035
Electronics Films Market Size and Share Forecast Outlook 2025 to 2035
Electronic Payment System For Transportation Market Size and Share Forecast Outlook 2025 to 2035
Electronic Skin Market Analysis - Size, Share, and Forecast Outlook 2025 to 2035
Electronic Ceramics Market Size and Share Forecast Outlook 2025 to 2035
Electronic Logging Device Market Size and Share Forecast Outlook 2025 to 2035
Electronic Skin Patch Market Size and Share Forecast Outlook 2025 to 2035

Thank you!
You will receive an email from our Business Development Manager. Please be sure to check your SPAM/JUNK folder too.
Chat With
MaRIA