Electronically Scanned Arrays System Market Size and Share Forecast Outlook 2025 to 2035

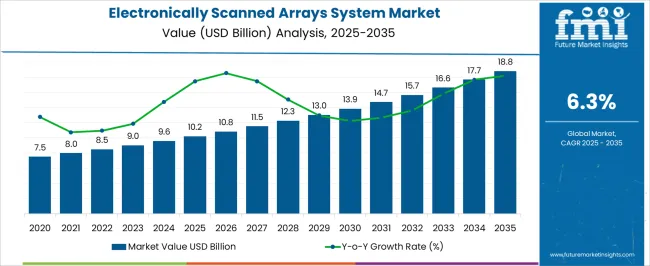
The Electronically Scanned Arrays System Market is estimated to be valued at USD 10.2 billion in 2025 and is projected to reach USD 18.8 billion by 2035, registering a compound annual growth rate (CAGR) of 6.3% over the forecast period.
Quick Stats for Electronically Scanned Arrays System Market

  • Electronically Scanned Arrays System Market Value (2025): USD 10.2 billion
  • Electronically Scanned Arrays System Market Forecast Value (2035): USD 18.8 billion
  • Electronically Scanned Arrays System Market Forecast CAGR: 6.3%
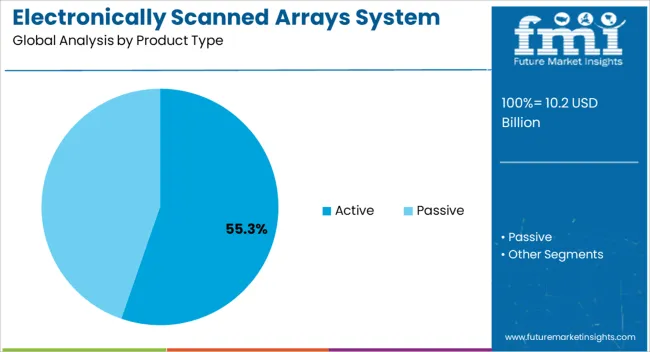
  • Leading Segment in Electronically Scanned Arrays System Market in 2025: Active (55.3%)
  • Key Growth Regions in Electronically Scanned Arrays System Market: North America, Asia-Pacific, Europe
  • Top Key Players in Electronically Scanned Arrays System Market: Raytheon Technologies Corporation, Lockheed Martin Corporation, Northrop Grumman, Saab AB, Aselsan A.S., Hanwha Systems, BAE Systems
Electronically Scanned Arrays System Market Market Value Analysis

Electronically Scanned Arrays System Market Key Takeaways

Metric Value
Electronically Scanned Arrays System Market Estimated Value in (2025 E) USD 10.2 billion
Electronically Scanned Arrays System Market Forecast Value in (2035 F) USD 18.8 billion
Forecast CAGR (2025 to 2035) 6.3%

Why is the Electronically Scanned Arrays System Market Growing?

The Electronically Scanned Arrays (ESA) System market is experiencing strong growth, driven by increasing demand for advanced radar and communication systems across defense, aviation, and surveillance sectors. Adoption is being supported by the need for highly accurate, fast, and reliable detection capabilities in both military and commercial applications. The integration of active electronically scanned arrays enhances operational flexibility by allowing rapid beam steering without mechanical movement, improving tracking precision and response times.

Increasing investments in modern defense systems, situational awareness technologies, and autonomous platforms are further fueling market expansion. Continuous innovation in signal processing, software-defined platforms, and miniaturization of components is enabling scalable and cost-efficient deployment.

The market is also shaped by rising geopolitical tensions, defense modernization programs, and growing requirements for multi-mission radar systems As the focus on interoperability, network-centric operations, and threat detection grows, the ESA system market is expected to sustain long-term growth, driven by technological advancements and increased adoption across air, land, and sea platforms.

Segmental Analysis

The electronically scanned arrays system market is segmented by product type, application platform, range, array geometry, components, and geographic regions. By product type, electronically scanned arrays system market is divided into Active and Passive. In terms of application platform, electronically scanned arrays system market is classified into Land, Naval, and Airborne. Based on range, electronically scanned arrays system market is segmented into Medium Range, Short Range, and Long Range. By array geometry, electronically scanned arrays system market is segmented into Linear, Planar, and Frequency Scanning. By components, electronically scanned arrays system market is segmented into Transmit Receive Module (TRM), Beam Forming Network (BFN), Phase Shifters, Signal Processing, Radar Data Processor, Power Supply Module, and Cooling System. Regionally, the electronically scanned arrays system industry is classified into North America, Latin America, Western Europe, Eastern Europe, Balkan & Baltic Countries, Russia & Belarus, Central Asia, East Asia, South Asia & Pacific, and the Middle East & Africa.
Insights into the Active Product Type Segment

Electronically Scanned Arrays System Market Analysis By Product Type

The active product type segment is projected to hold 55.3% of the ESA system market revenue in 2025, establishing it as the leading product category. Its dominance is being driven by the ability to deliver higher efficiency, longer operational life, and superior signal quality compared to passive arrays. Active ESA systems allow for precise control of power distribution and beam shaping, enabling enhanced detection, tracking, and multi-target engagement capabilities.

These systems also provide higher reliability and reduced maintenance requirements, making them the preferred choice in defense and critical surveillance applications. Continuous advancements in semiconductor technologies, including gallium nitride and other high-power components, are improving performance and operational flexibility.

Integration with software-defined control systems allows upgrades and enhancements without major hardware modifications With growing demand for scalable and high-performance radar solutions in modern military and security programs, active ESA systems are expected to maintain their market leadership, supported by their adaptability, precision, and operational efficiency.
Insights into the Land Application Platform Segment

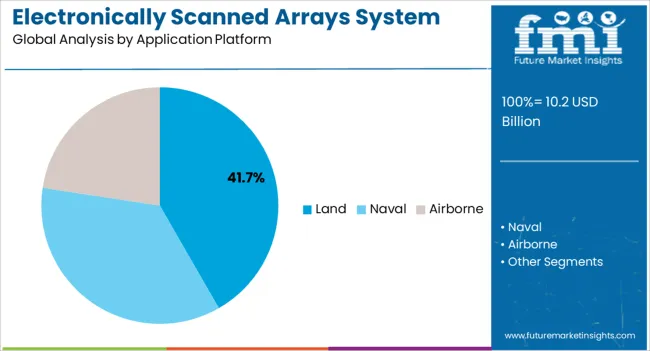
Electronically Scanned Arrays System Market Analysis By Application Platform

The land application platform segment is anticipated to account for 41.7% of the ESA system market revenue in 2025, making it the leading application area. Growth is being driven by increasing deployment of radar systems for ground-based defense, border security, and tactical operations. ESA systems provide high-resolution imaging, rapid target acquisition, and long-range tracking capabilities critical for land surveillance and threat monitoring.

The ability to integrate these systems with command and control platforms enhances situational awareness and operational coordination. Investments in mobile radar units, unmanned ground vehicles, and border monitoring infrastructure are further accelerating adoption.

The segment benefits from the demand for reliable and rapid-response detection technologies that can operate under diverse environmental conditions As modernization of land-based defense networks and security infrastructure continues, the land application platform segment is expected to remain the primary driver of market growth, supported by technological advancements in array design, signal processing, and system interoperability.
Insights into the Medium Range Segment

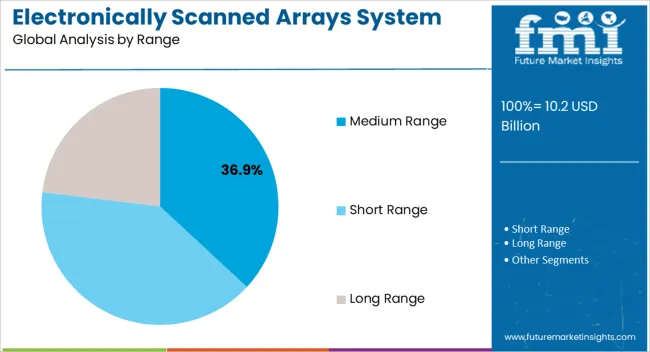
Electronically Scanned Arrays System Market Analysis By Range

The medium range segment is projected to hold 36.9% of the ESA system market revenue in 2025, establishing it as the leading range category. Its growth is driven by the balance it provides between detection distance, coverage, and cost-effectiveness, making it suitable for multi-mission applications including tactical operations, border monitoring, and mobile defense units.

Medium-range ESA systems are capable of providing rapid scanning, high resolution, and precise target identification, enabling real-time threat assessment and decision-making. Integration with advanced software-defined controls allows for dynamic adjustment of detection parameters without physical modifications, enhancing operational flexibility.

The ability to combine performance efficiency with cost optimization has strengthened adoption in both emerging and established defense markets With increasing investments in defense modernization programs, autonomous monitoring systems, and situational awareness solutions, the medium range segment is expected to continue leading, driven by demand for versatile and reliable radar capabilities that balance performance and affordability.

Market Overview

Electronically Scanned Arrays System Market Outlook from 2025 to 2035

A key trend shaping the electronically scanned arrays system market is the integration of artificial intelligence and machine learning capabilities. Electronically scanned arrays systems are increasingly incorporating artificial intelligence algorithms to enhance their operational efficiency, accuracy, and responsiveness in dynamic environments.

Artificial intelligence enables electronically scanned arrays systems to autonomously adapt their radar scanning patterns, prioritize targets based on threat assessments, and optimize resource allocation in real time.

Machine learning algorithms analyze vast amounts of data collected by electronically scanned arrays system to identify patterns, predict behaviours, and improve decision making processes.

The above trend is driven by the need for electronically scanned arrays system to handle complex scenarios, such as electronic warfare, urban operations, and multiple target engagements, with greater precision and speed.

As artificial intelligence continues to advance, electronically scanned arrays system equipped with intelligent capabilities are expected to play a pivotal role in enhancing defense capabilities, improving situational awareness, and supporting critical missions across military, aerospace, and surveillance applications.
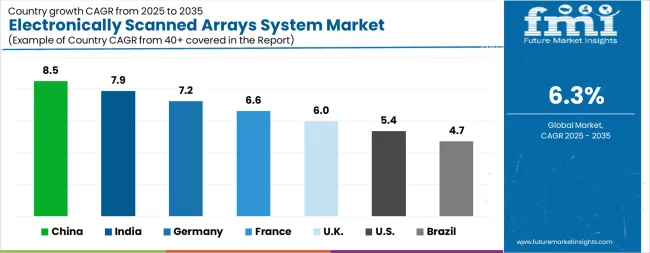
Analysis of Electronically Scanned Arrays System Market By Key Countries

Electronically Scanned Arrays System Market Cagr Analysis By Country
Country CAGR
China 8.5%
India 7.9%
Germany 7.2%
France 6.6%
UK 6.0%
USA 5.4%
Brazil 4.7%

Country-wise Analysis

The Electronically Scanned Arrays System Market is expected to register a CAGR of 6.3% during the forecast period, exhibiting varied country level momentum. China leads with the highest CAGR of 8.5%, followed by India at 7.9%. Developed markets such as Germany, France, and the UK continue to expand steadily, while the USA is likely to grow at consistent rates. Brazil posts the lowest CAGR at 4.7%, yet still underscores a broadly positive trajectory for the global Electronically Scanned Arrays System Market. In 2024, Germany held a dominant revenue in the Western Europe market and is expected to grow with a CAGR of 7.2%. The USA Electronically Scanned Arrays System Market is estimated to be valued at USD 3.6 billion in 2025 and is anticipated to reach a valuation of USD 6.1 billion by 2035. Sales are projected to rise at a CAGR of 5.4% over the forecast period between 2025 and 2035. While Japan and South Korea markets are estimated to be valued at USD 515.2 million and USD 258.1 million respectively in 2025.
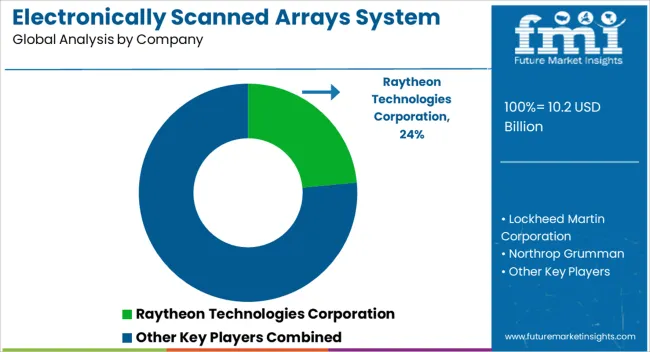
Key Players in the Electronically Scanned Arrays System Market

Electronically Scanned Arrays System Market Analysis By Company

  • Raytheon Technologies Corporation
  • Lockheed Martin Corporation
  • Northrop Grumman
  • Saab AB
  • Aselsan A.S.
  • Hanwha Systems
  • BAE Systems

Scope of the Report

Item Value
Quantitative Units USD 10.2 Billion
Product Type Active and Passive
Application Platform Land, Naval, and Airborne
Range Medium Range, Short Range, and Long Range
Array Geometry Linear, Planar, and Frequency Scanning
Components Transmit Receive Module (TRM), Beam Forming Network (BFN), Phase Shifters, Signal Processing, Radar Data Processor, Power Supply Module, and Cooling System
Regions Covered North America, Europe, Asia-Pacific, Latin America, Middle East & Africa
Country Covered United States, Canada, Germany, France, United Kingdom, China, Japan, India, Brazil, South Africa
Key Companies Profiled Raytheon Technologies Corporation, Lockheed Martin Corporation, Northrop Grumman, Saab AB, Aselsan A.S., Hanwha Systems, and BAE Systems

Electronically Scanned Arrays System Market by Segments

Product Type:

  • Active
  • Passive

Application Platform:

  • Land
  • Naval
  • Airborne

Range:

  • Medium Range
  • Short Range
  • Long Range

Array Geometry:

  • Linear
  • Planar
  • Frequency Scanning

Components:

  • Transmit Receive Module (TRM)
  • Beam Forming Network (BFN)
  • Phase Shifters
  • Signal Processing
  • Radar Data Processor
  • Power Supply Module
  • Cooling System

Region:

  • North America
    • USA
    • Canada
    • Mexico
  • Latin America
    • Brazil
    • Chile
    • Rest of Latin America
  • Western Europe
    • Germany
    • UK
    • Italy
    • Spain
    • France
    • Nordic
    • BENELUX
    • Rest of Western Europe
  • Eastern Europe
    • Russia
    • Poland
    • Hungary
    • Balkan & Baltic
    • Rest of Eastern Europe
  • East Asia
    • China
    • Japan
    • South Korea
  • South Asia and Pacific
    • India
    • ASEAN
    • Australia & New Zealand
    • Rest of South Asia and Pacific
  • Middle East & Africa
    • Kingdom of Saudi Arabia
    • Other GCC Countries
    • Turkiye
    • South Africa
    • Other African Union
    • Rest of Middle East & Africa

Table of Content

  1. Executive Summary
    • Global Market Outlook
    • Demand-side Trends
    • Supply-side Trends
    • Technology Roadmap Analysis
    • Analysis and Recommendations
  2. Market Overview
    • Market Coverage / Taxonomy
    • Market Definition / Scope / Limitations
  3. Market Background
    • Market Dynamics
      • Drivers
      • Restraints
      • Opportunity
      • Trends
    • Scenario Forecast
      • Demand in Optimistic Scenario
      • Demand in Likely Scenario
      • Demand in Conservative Scenario
    • Opportunity Map Analysis
    • Product Life Cycle Analysis
    • Supply Chain Analysis
    • Investment Feasibility Matrix
    • Value Chain Analysis
    • PESTLE and Porter’s Analysis
    • Regulatory Landscape
    • Regional Parent Market Outlook
    • Production and Consumption Statistics
    • Import and Export Statistics
  4. Global Market Analysis 2020 to 2024 and Forecast, 2025 to 2035
    • Historical Market Size Value (USD Million) Analysis, 2020 to 2024
    • Current and Future Market Size Value (USD Million) Projections, 2025 to 2035
      • Y-o-Y Growth Trend Analysis
      • Absolute $ Opportunity Analysis
  5. Global Market Pricing Analysis 2020 to 2024 and Forecast 2025 to 2035
  6. Global Market Analysis 2020 to 2024 and Forecast 2025 to 2035, By Product Type
    • Introduction / Key Findings
    • Historical Market Size Value (USD Million) Analysis By Product Type , 2020 to 2024
    • Current and Future Market Size Value (USD Million) Analysis and Forecast By Product Type , 2025 to 2035
      • Active
      • Passive
    • Y-o-Y Growth Trend Analysis By Product Type , 2020 to 2024
    • Absolute $ Opportunity Analysis By Product Type , 2025 to 2035
  7. Global Market Analysis 2020 to 2024 and Forecast 2025 to 2035, By Application Platform
    • Introduction / Key Findings
    • Historical Market Size Value (USD Million) Analysis By Application Platform, 2020 to 2024
    • Current and Future Market Size Value (USD Million) Analysis and Forecast By Application Platform, 2025 to 2035
      • Land
      • Naval
      • Airborne
    • Y-o-Y Growth Trend Analysis By Application Platform, 2020 to 2024
    • Absolute $ Opportunity Analysis By Application Platform, 2025 to 2035
  8. Global Market Analysis 2020 to 2024 and Forecast 2025 to 2035, By Range
    • Introduction / Key Findings
    • Historical Market Size Value (USD Million) Analysis By Range, 2020 to 2024
    • Current and Future Market Size Value (USD Million) Analysis and Forecast By Range, 2025 to 2035
      • Medium Range
      • Short Range
      • Long Range
    • Y-o-Y Growth Trend Analysis By Range, 2020 to 2024
    • Absolute $ Opportunity Analysis By Range, 2025 to 2035
  9. Global Market Analysis 2020 to 2024 and Forecast 2025 to 2035, By Array Geometry
    • Introduction / Key Findings
    • Historical Market Size Value (USD Million) Analysis By Array Geometry, 2020 to 2024
    • Current and Future Market Size Value (USD Million) Analysis and Forecast By Array Geometry, 2025 to 2035
      • Linear
      • Planar
      • Frequency Scanning
    • Y-o-Y Growth Trend Analysis By Array Geometry, 2020 to 2024
    • Absolute $ Opportunity Analysis By Array Geometry, 2025 to 2035
  10. Global Market Analysis 2020 to 2024 and Forecast 2025 to 2035, By Components
    • Introduction / Key Findings
    • Historical Market Size Value (USD Million) Analysis By Components, 2020 to 2024
    • Current and Future Market Size Value (USD Million) Analysis and Forecast By Components, 2025 to 2035
      • Transmit Receive Module (TRM)
      • Beam Forming Network (BFN)
      • Phase Shifters
      • Signal Processing
      • Radar Data Processor
      • Power Supply Module
      • Cooling System
    • Y-o-Y Growth Trend Analysis By Components, 2020 to 2024
    • Absolute $ Opportunity Analysis By Components, 2025 to 2035
  11. Global Market Analysis 2020 to 2024 and Forecast 2025 to 2035, By Region
    • Introduction
    • Historical Market Size Value (USD Million) Analysis By Region, 2020 to 2024
    • Current Market Size Value (USD Million) Analysis and Forecast By Region, 2025 to 2035
      • North America
      • Latin America
      • Western Europe
      • Eastern Europe
      • East Asia
      • South Asia and Pacific
      • Middle East & Africa
    • Market Attractiveness Analysis By Region
  12. North America Market Analysis 2020 to 2024 and Forecast 2025 to 2035, By Country
    • Historical Market Size Value (USD Million) Trend Analysis By Market Taxonomy, 2020 to 2024
    • Market Size Value (USD Million) Forecast By Market Taxonomy, 2025 to 2035
      • By Country
        • USA
        • Canada
        • Mexico
      • By Product Type
      • By Application Platform
      • By Range
      • By Array Geometry
      • By Components
    • Market Attractiveness Analysis
      • By Country
      • By Product Type
      • By Application Platform
      • By Range
      • By Array Geometry
      • By Components
    • Key Takeaways
  13. Latin America Market Analysis 2020 to 2024 and Forecast 2025 to 2035, By Country
    • Historical Market Size Value (USD Million) Trend Analysis By Market Taxonomy, 2020 to 2024
    • Market Size Value (USD Million) Forecast By Market Taxonomy, 2025 to 2035
      • By Country
        • Brazil
        • Chile
        • Rest of Latin America
      • By Product Type
      • By Application Platform
      • By Range
      • By Array Geometry
      • By Components
    • Market Attractiveness Analysis
      • By Country
      • By Product Type
      • By Application Platform
      • By Range
      • By Array Geometry
      • By Components
    • Key Takeaways
  14. Western Europe Market Analysis 2020 to 2024 and Forecast 2025 to 2035, By Country
    • Historical Market Size Value (USD Million) Trend Analysis By Market Taxonomy, 2020 to 2024
    • Market Size Value (USD Million) Forecast By Market Taxonomy, 2025 to 2035
      • By Country
        • Germany
        • UK
        • Italy
        • Spain
        • France
        • Nordic
        • BENELUX
        • Rest of Western Europe
      • By Product Type
      • By Application Platform
      • By Range
      • By Array Geometry
      • By Components
    • Market Attractiveness Analysis
      • By Country
      • By Product Type
      • By Application Platform
      • By Range
      • By Array Geometry
      • By Components
    • Key Takeaways
  15. Eastern Europe Market Analysis 2020 to 2024 and Forecast 2025 to 2035, By Country
    • Historical Market Size Value (USD Million) Trend Analysis By Market Taxonomy, 2020 to 2024
    • Market Size Value (USD Million) Forecast By Market Taxonomy, 2025 to 2035
      • By Country
        • Russia
        • Poland
        • Hungary
        • Balkan & Baltic
        • Rest of Eastern Europe
      • By Product Type
      • By Application Platform
      • By Range
      • By Array Geometry
      • By Components
    • Market Attractiveness Analysis
      • By Country
      • By Product Type
      • By Application Platform
      • By Range
      • By Array Geometry
      • By Components
    • Key Takeaways
  16. East Asia Market Analysis 2020 to 2024 and Forecast 2025 to 2035, By Country
    • Historical Market Size Value (USD Million) Trend Analysis By Market Taxonomy, 2020 to 2024
    • Market Size Value (USD Million) Forecast By Market Taxonomy, 2025 to 2035
      • By Country
        • China
        • Japan
        • South Korea
      • By Product Type
      • By Application Platform
      • By Range
      • By Array Geometry
      • By Components
    • Market Attractiveness Analysis
      • By Country
      • By Product Type
      • By Application Platform
      • By Range
      • By Array Geometry
      • By Components
    • Key Takeaways
  17. South Asia and Pacific Market Analysis 2020 to 2024 and Forecast 2025 to 2035, By Country
    • Historical Market Size Value (USD Million) Trend Analysis By Market Taxonomy, 2020 to 2024
    • Market Size Value (USD Million) Forecast By Market Taxonomy, 2025 to 2035
      • By Country
        • India
        • ASEAN
        • Australia & New Zealand
        • Rest of South Asia and Pacific
      • By Product Type
      • By Application Platform
      • By Range
      • By Array Geometry
      • By Components
    • Market Attractiveness Analysis
      • By Country
      • By Product Type
      • By Application Platform
      • By Range
      • By Array Geometry
      • By Components
    • Key Takeaways
  18. Middle East & Africa Market Analysis 2020 to 2024 and Forecast 2025 to 2035, By Country
    • Historical Market Size Value (USD Million) Trend Analysis By Market Taxonomy, 2020 to 2024
    • Market Size Value (USD Million) Forecast By Market Taxonomy, 2025 to 2035
      • By Country
        • Kingdom of Saudi Arabia
        • Other GCC Countries
        • Turkiye
        • South Africa
        • Other African Union
        • Rest of Middle East & Africa
      • By Product Type
      • By Application Platform
      • By Range
      • By Array Geometry
      • By Components
    • Market Attractiveness Analysis
      • By Country
      • By Product Type
      • By Application Platform
      • By Range
      • By Array Geometry
      • By Components
    • Key Takeaways
  19. Key Countries Market Analysis
    • USA
      • Pricing Analysis
      • Market Share Analysis, 2024
        • By Product Type
        • By Application Platform
        • By Range
        • By Array Geometry
        • By Components
    • Canada
      • Pricing Analysis
      • Market Share Analysis, 2024
        • By Product Type
        • By Application Platform
        • By Range
        • By Array Geometry
        • By Components
    • Mexico
      • Pricing Analysis
      • Market Share Analysis, 2024
        • By Product Type
        • By Application Platform
        • By Range
        • By Array Geometry
        • By Components
    • Brazil
      • Pricing Analysis
      • Market Share Analysis, 2024
        • By Product Type
        • By Application Platform
        • By Range
        • By Array Geometry
        • By Components
    • Chile
      • Pricing Analysis
      • Market Share Analysis, 2024
        • By Product Type
        • By Application Platform
        • By Range
        • By Array Geometry
        • By Components
    • Germany
      • Pricing Analysis
      • Market Share Analysis, 2024
        • By Product Type
        • By Application Platform
        • By Range
        • By Array Geometry
        • By Components
    • UK
      • Pricing Analysis
      • Market Share Analysis, 2024
        • By Product Type
        • By Application Platform
        • By Range
        • By Array Geometry
        • By Components
    • Italy
      • Pricing Analysis
      • Market Share Analysis, 2024
        • By Product Type
        • By Application Platform
        • By Range
        • By Array Geometry
        • By Components
    • Spain
      • Pricing Analysis
      • Market Share Analysis, 2024
        • By Product Type
        • By Application Platform
        • By Range
        • By Array Geometry
        • By Components
    • France
      • Pricing Analysis
      • Market Share Analysis, 2024
        • By Product Type
        • By Application Platform
        • By Range
        • By Array Geometry
        • By Components
    • India
      • Pricing Analysis
      • Market Share Analysis, 2024
        • By Product Type
        • By Application Platform
        • By Range
        • By Array Geometry
        • By Components
    • ASEAN
      • Pricing Analysis
      • Market Share Analysis, 2024
        • By Product Type
        • By Application Platform
        • By Range
        • By Array Geometry
        • By Components
    • Australia & New Zealand
      • Pricing Analysis
      • Market Share Analysis, 2024
        • By Product Type
        • By Application Platform
        • By Range
        • By Array Geometry
        • By Components
    • China
      • Pricing Analysis
      • Market Share Analysis, 2024
        • By Product Type
        • By Application Platform
        • By Range
        • By Array Geometry
        • By Components
    • Japan
      • Pricing Analysis
      • Market Share Analysis, 2024
        • By Product Type
        • By Application Platform
        • By Range
        • By Array Geometry
        • By Components
    • South Korea
      • Pricing Analysis
      • Market Share Analysis, 2024
        • By Product Type
        • By Application Platform
        • By Range
        • By Array Geometry
        • By Components
    • Russia
      • Pricing Analysis
      • Market Share Analysis, 2024
        • By Product Type
        • By Application Platform
        • By Range
        • By Array Geometry
        • By Components
    • Poland
      • Pricing Analysis
      • Market Share Analysis, 2024
        • By Product Type
        • By Application Platform
        • By Range
        • By Array Geometry
        • By Components
    • Hungary
      • Pricing Analysis
      • Market Share Analysis, 2024
        • By Product Type
        • By Application Platform
        • By Range
        • By Array Geometry
        • By Components
    • Kingdom of Saudi Arabia
      • Pricing Analysis
      • Market Share Analysis, 2024
        • By Product Type
        • By Application Platform
        • By Range
        • By Array Geometry
        • By Components
    • Turkiye
      • Pricing Analysis
      • Market Share Analysis, 2024
        • By Product Type
        • By Application Platform
        • By Range
        • By Array Geometry
        • By Components
    • South Africa
      • Pricing Analysis
      • Market Share Analysis, 2024
        • By Product Type
        • By Application Platform
        • By Range
        • By Array Geometry
        • By Components
  20. Market Structure Analysis
    • Competition Dashboard
    • Competition Benchmarking
    • Market Share Analysis of Top Players
      • By Regional
      • By Product Type
      • By Application Platform
      • By Range
      • By Array Geometry
      • By Components
  21. Competition Analysis
    • Competition Deep Dive
      • Raytheon Technologies Corporation
        • Overview
        • Product Portfolio
        • Profitability by Market Segments (Product/Age /Sales Channel/Region)
        • Sales Footprint
        • Strategy Overview
          • Marketing Strategy
          • Product Strategy
          • Channel Strategy
      • Lockheed Martin Corporation
      • Northrop Grumman
      • Saab AB
      • Aselsan A.S.
      • Hanwha Systems
      • BAE Systems
  22. Assumptions & Acronyms Used
  23. Research Methodology

List of Tables

  • Table 1: Global Market Value (USD Million) Forecast by Region, 2020-2035
  • Table 2: Global Market Value (USD Million) Forecast by Product Type , 2020-2035
  • Table 3: Global Market Value (USD Million) Forecast by Application Platform, 2020-2035
  • Table 4: Global Market Value (USD Million) Forecast by Range, 2020-2035
  • Table 5: Global Market Value (USD Million) Forecast by Array Geometry, 2020-2035
  • Table 6: Global Market Value (USD Million) Forecast by Components, 2020-2035
  • Table 7: North America Market Value (USD Million) Forecast by Country, 2020-2035
  • Table 8: North America Market Value (USD Million) Forecast by Product Type , 2020-2035
  • Table 9: North America Market Value (USD Million) Forecast by Application Platform, 2020-2035
  • Table 10: North America Market Value (USD Million) Forecast by Range, 2020-2035
  • Table 11: North America Market Value (USD Million) Forecast by Array Geometry, 2020-2035
  • Table 12: North America Market Value (USD Million) Forecast by Components, 2020-2035
  • Table 13: Latin America Market Value (USD Million) Forecast by Country, 2020-2035
  • Table 14: Latin America Market Value (USD Million) Forecast by Product Type , 2020-2035
  • Table 15: Latin America Market Value (USD Million) Forecast by Application Platform, 2020-2035
  • Table 16: Latin America Market Value (USD Million) Forecast by Range, 2020-2035
  • Table 17: Latin America Market Value (USD Million) Forecast by Array Geometry, 2020-2035
  • Table 18: Latin America Market Value (USD Million) Forecast by Components, 2020-2035
  • Table 19: Western Europe Market Value (USD Million) Forecast by Country, 2020-2035
  • Table 20: Western Europe Market Value (USD Million) Forecast by Product Type , 2020-2035
  • Table 21: Western Europe Market Value (USD Million) Forecast by Application Platform, 2020-2035
  • Table 22: Western Europe Market Value (USD Million) Forecast by Range, 2020-2035
  • Table 23: Western Europe Market Value (USD Million) Forecast by Array Geometry, 2020-2035
  • Table 24: Western Europe Market Value (USD Million) Forecast by Components, 2020-2035
  • Table 25: Eastern Europe Market Value (USD Million) Forecast by Country, 2020-2035
  • Table 26: Eastern Europe Market Value (USD Million) Forecast by Product Type , 2020-2035
  • Table 27: Eastern Europe Market Value (USD Million) Forecast by Application Platform, 2020-2035
  • Table 28: Eastern Europe Market Value (USD Million) Forecast by Range, 2020-2035
  • Table 29: Eastern Europe Market Value (USD Million) Forecast by Array Geometry, 2020-2035
  • Table 30: Eastern Europe Market Value (USD Million) Forecast by Components, 2020-2035
  • Table 31: East Asia Market Value (USD Million) Forecast by Country, 2020-2035
  • Table 32: East Asia Market Value (USD Million) Forecast by Product Type , 2020-2035
  • Table 33: East Asia Market Value (USD Million) Forecast by Application Platform, 2020-2035
  • Table 34: East Asia Market Value (USD Million) Forecast by Range, 2020-2035
  • Table 35: East Asia Market Value (USD Million) Forecast by Array Geometry, 2020-2035
  • Table 36: East Asia Market Value (USD Million) Forecast by Components, 2020-2035
  • Table 37: South Asia and Pacific Market Value (USD Million) Forecast by Country, 2020-2035
  • Table 38: South Asia and Pacific Market Value (USD Million) Forecast by Product Type , 2020-2035
  • Table 39: South Asia and Pacific Market Value (USD Million) Forecast by Application Platform, 2020-2035
  • Table 40: South Asia and Pacific Market Value (USD Million) Forecast by Range, 2020-2035
  • Table 41: South Asia and Pacific Market Value (USD Million) Forecast by Array Geometry, 2020-2035
  • Table 42: South Asia and Pacific Market Value (USD Million) Forecast by Components, 2020-2035
  • Table 43: Middle East & Africa Market Value (USD Million) Forecast by Country, 2020-2035
  • Table 44: Middle East & Africa Market Value (USD Million) Forecast by Product Type , 2020-2035
  • Table 45: Middle East & Africa Market Value (USD Million) Forecast by Application Platform, 2020-2035
  • Table 46: Middle East & Africa Market Value (USD Million) Forecast by Range, 2020-2035
  • Table 47: Middle East & Africa Market Value (USD Million) Forecast by Array Geometry, 2020-2035
  • Table 48: Middle East & Africa Market Value (USD Million) Forecast by Components, 2020-2035

List of Figures

  • Figure 1: Global Market Pricing Analysis
  • Figure 2: Global Market Value (USD Million) Forecast 2020-2035
  • Figure 3: Global Market Value Share and BPS Analysis by Product Type , 2025 and 2035
  • Figure 4: Global Market Y-o-Y Growth Comparison by Product Type , 2025-2035
  • Figure 5: Global Market Attractiveness Analysis by Product Type
  • Figure 6: Global Market Value Share and BPS Analysis by Application Platform, 2025 and 2035
  • Figure 7: Global Market Y-o-Y Growth Comparison by Application Platform, 2025-2035
  • Figure 8: Global Market Attractiveness Analysis by Application Platform
  • Figure 9: Global Market Value Share and BPS Analysis by Range, 2025 and 2035
  • Figure 10: Global Market Y-o-Y Growth Comparison by Range, 2025-2035
  • Figure 11: Global Market Attractiveness Analysis by Range
  • Figure 12: Global Market Value Share and BPS Analysis by Array Geometry, 2025 and 2035
  • Figure 13: Global Market Y-o-Y Growth Comparison by Array Geometry, 2025-2035
  • Figure 14: Global Market Attractiveness Analysis by Array Geometry
  • Figure 15: Global Market Value Share and BPS Analysis by Components, 2025 and 2035
  • Figure 16: Global Market Y-o-Y Growth Comparison by Components, 2025-2035
  • Figure 17: Global Market Attractiveness Analysis by Components
  • Figure 18: Global Market Value (USD Million) Share and BPS Analysis by Region, 2025 and 2035
  • Figure 19: Global Market Y-o-Y Growth Comparison by Region, 2025-2035
  • Figure 20: Global Market Attractiveness Analysis by Region
  • Figure 21: North America Market Incremental Dollar Opportunity, 2025-2035
  • Figure 22: Latin America Market Incremental Dollar Opportunity, 2025-2035
  • Figure 23: Western Europe Market Incremental Dollar Opportunity, 2025-2035
  • Figure 24: Eastern Europe Market Incremental Dollar Opportunity, 2025-2035
  • Figure 25: East Asia Market Incremental Dollar Opportunity, 2025-2035
  • Figure 26: South Asia and Pacific Market Incremental Dollar Opportunity, 2025-2035
  • Figure 27: Middle East & Africa Market Incremental Dollar Opportunity, 2025-2035
  • Figure 28: North America Market Value Share and BPS Analysis by Country, 2025 and 2035
  • Figure 29: North America Market Value Share and BPS Analysis by Product Type , 2025 and 2035
  • Figure 30: North America Market Y-o-Y Growth Comparison by Product Type , 2025-2035
  • Figure 31: North America Market Attractiveness Analysis by Product Type
  • Figure 32: North America Market Value Share and BPS Analysis by Application Platform, 2025 and 2035
  • Figure 33: North America Market Y-o-Y Growth Comparison by Application Platform, 2025-2035
  • Figure 34: North America Market Attractiveness Analysis by Application Platform
  • Figure 35: North America Market Value Share and BPS Analysis by Range, 2025 and 2035
  • Figure 36: North America Market Y-o-Y Growth Comparison by Range, 2025-2035
  • Figure 37: North America Market Attractiveness Analysis by Range
  • Figure 38: North America Market Value Share and BPS Analysis by Array Geometry, 2025 and 2035
  • Figure 39: North America Market Y-o-Y Growth Comparison by Array Geometry, 2025-2035
  • Figure 40: North America Market Attractiveness Analysis by Array Geometry
  • Figure 41: North America Market Value Share and BPS Analysis by Components, 2025 and 2035
  • Figure 42: North America Market Y-o-Y Growth Comparison by Components, 2025-2035
  • Figure 43: North America Market Attractiveness Analysis by Components
  • Figure 44: Latin America Market Value Share and BPS Analysis by Country, 2025 and 2035
  • Figure 45: Latin America Market Value Share and BPS Analysis by Product Type , 2025 and 2035
  • Figure 46: Latin America Market Y-o-Y Growth Comparison by Product Type , 2025-2035
  • Figure 47: Latin America Market Attractiveness Analysis by Product Type
  • Figure 48: Latin America Market Value Share and BPS Analysis by Application Platform, 2025 and 2035
  • Figure 49: Latin America Market Y-o-Y Growth Comparison by Application Platform, 2025-2035
  • Figure 50: Latin America Market Attractiveness Analysis by Application Platform
  • Figure 51: Latin America Market Value Share and BPS Analysis by Range, 2025 and 2035
  • Figure 52: Latin America Market Y-o-Y Growth Comparison by Range, 2025-2035
  • Figure 53: Latin America Market Attractiveness Analysis by Range
  • Figure 54: Latin America Market Value Share and BPS Analysis by Array Geometry, 2025 and 2035
  • Figure 55: Latin America Market Y-o-Y Growth Comparison by Array Geometry, 2025-2035
  • Figure 56: Latin America Market Attractiveness Analysis by Array Geometry
  • Figure 57: Latin America Market Value Share and BPS Analysis by Components, 2025 and 2035
  • Figure 58: Latin America Market Y-o-Y Growth Comparison by Components, 2025-2035
  • Figure 59: Latin America Market Attractiveness Analysis by Components
  • Figure 60: Western Europe Market Value Share and BPS Analysis by Country, 2025 and 2035
  • Figure 61: Western Europe Market Value Share and BPS Analysis by Product Type , 2025 and 2035
  • Figure 62: Western Europe Market Y-o-Y Growth Comparison by Product Type , 2025-2035
  • Figure 63: Western Europe Market Attractiveness Analysis by Product Type
  • Figure 64: Western Europe Market Value Share and BPS Analysis by Application Platform, 2025 and 2035
  • Figure 65: Western Europe Market Y-o-Y Growth Comparison by Application Platform, 2025-2035
  • Figure 66: Western Europe Market Attractiveness Analysis by Application Platform
  • Figure 67: Western Europe Market Value Share and BPS Analysis by Range, 2025 and 2035
  • Figure 68: Western Europe Market Y-o-Y Growth Comparison by Range, 2025-2035
  • Figure 69: Western Europe Market Attractiveness Analysis by Range
  • Figure 70: Western Europe Market Value Share and BPS Analysis by Array Geometry, 2025 and 2035
  • Figure 71: Western Europe Market Y-o-Y Growth Comparison by Array Geometry, 2025-2035
  • Figure 72: Western Europe Market Attractiveness Analysis by Array Geometry
  • Figure 73: Western Europe Market Value Share and BPS Analysis by Components, 2025 and 2035
  • Figure 74: Western Europe Market Y-o-Y Growth Comparison by Components, 2025-2035
  • Figure 75: Western Europe Market Attractiveness Analysis by Components
  • Figure 76: Eastern Europe Market Value Share and BPS Analysis by Country, 2025 and 2035
  • Figure 77: Eastern Europe Market Value Share and BPS Analysis by Product Type , 2025 and 2035
  • Figure 78: Eastern Europe Market Y-o-Y Growth Comparison by Product Type , 2025-2035
  • Figure 79: Eastern Europe Market Attractiveness Analysis by Product Type
  • Figure 80: Eastern Europe Market Value Share and BPS Analysis by Application Platform, 2025 and 2035
  • Figure 81: Eastern Europe Market Y-o-Y Growth Comparison by Application Platform, 2025-2035
  • Figure 82: Eastern Europe Market Attractiveness Analysis by Application Platform
  • Figure 83: Eastern Europe Market Value Share and BPS Analysis by Range, 2025 and 2035
  • Figure 84: Eastern Europe Market Y-o-Y Growth Comparison by Range, 2025-2035
  • Figure 85: Eastern Europe Market Attractiveness Analysis by Range
  • Figure 86: Eastern Europe Market Value Share and BPS Analysis by Array Geometry, 2025 and 2035
  • Figure 87: Eastern Europe Market Y-o-Y Growth Comparison by Array Geometry, 2025-2035
  • Figure 88: Eastern Europe Market Attractiveness Analysis by Array Geometry
  • Figure 89: Eastern Europe Market Value Share and BPS Analysis by Components, 2025 and 2035
  • Figure 90: Eastern Europe Market Y-o-Y Growth Comparison by Components, 2025-2035
  • Figure 91: Eastern Europe Market Attractiveness Analysis by Components
  • Figure 92: East Asia Market Value Share and BPS Analysis by Country, 2025 and 2035
  • Figure 93: East Asia Market Value Share and BPS Analysis by Product Type , 2025 and 2035
  • Figure 94: East Asia Market Y-o-Y Growth Comparison by Product Type , 2025-2035
  • Figure 95: East Asia Market Attractiveness Analysis by Product Type
  • Figure 96: East Asia Market Value Share and BPS Analysis by Application Platform, 2025 and 2035
  • Figure 97: East Asia Market Y-o-Y Growth Comparison by Application Platform, 2025-2035
  • Figure 98: East Asia Market Attractiveness Analysis by Application Platform
  • Figure 99: East Asia Market Value Share and BPS Analysis by Range, 2025 and 2035
  • Figure 100: East Asia Market Y-o-Y Growth Comparison by Range, 2025-2035
  • Figure 101: East Asia Market Attractiveness Analysis by Range
  • Figure 102: East Asia Market Value Share and BPS Analysis by Array Geometry, 2025 and 2035
  • Figure 103: East Asia Market Y-o-Y Growth Comparison by Array Geometry, 2025-2035
  • Figure 104: East Asia Market Attractiveness Analysis by Array Geometry
  • Figure 105: East Asia Market Value Share and BPS Analysis by Components, 2025 and 2035
  • Figure 106: East Asia Market Y-o-Y Growth Comparison by Components, 2025-2035
  • Figure 107: East Asia Market Attractiveness Analysis by Components
  • Figure 108: South Asia and Pacific Market Value Share and BPS Analysis by Country, 2025 and 2035
  • Figure 109: South Asia and Pacific Market Value Share and BPS Analysis by Product Type , 2025 and 2035
  • Figure 110: South Asia and Pacific Market Y-o-Y Growth Comparison by Product Type , 2025-2035
  • Figure 111: South Asia and Pacific Market Attractiveness Analysis by Product Type
  • Figure 112: South Asia and Pacific Market Value Share and BPS Analysis by Application Platform, 2025 and 2035
  • Figure 113: South Asia and Pacific Market Y-o-Y Growth Comparison by Application Platform, 2025-2035
  • Figure 114: South Asia and Pacific Market Attractiveness Analysis by Application Platform
  • Figure 115: South Asia and Pacific Market Value Share and BPS Analysis by Range, 2025 and 2035
  • Figure 116: South Asia and Pacific Market Y-o-Y Growth Comparison by Range, 2025-2035
  • Figure 117: South Asia and Pacific Market Attractiveness Analysis by Range
  • Figure 118: South Asia and Pacific Market Value Share and BPS Analysis by Array Geometry, 2025 and 2035
  • Figure 119: South Asia and Pacific Market Y-o-Y Growth Comparison by Array Geometry, 2025-2035
  • Figure 120: South Asia and Pacific Market Attractiveness Analysis by Array Geometry
  • Figure 121: South Asia and Pacific Market Value Share and BPS Analysis by Components, 2025 and 2035
  • Figure 122: South Asia and Pacific Market Y-o-Y Growth Comparison by Components, 2025-2035
  • Figure 123: South Asia and Pacific Market Attractiveness Analysis by Components
  • Figure 124: Middle East & Africa Market Value Share and BPS Analysis by Country, 2025 and 2035
  • Figure 125: Middle East & Africa Market Value Share and BPS Analysis by Product Type , 2025 and 2035
  • Figure 126: Middle East & Africa Market Y-o-Y Growth Comparison by Product Type , 2025-2035
  • Figure 127: Middle East & Africa Market Attractiveness Analysis by Product Type
  • Figure 128: Middle East & Africa Market Value Share and BPS Analysis by Application Platform, 2025 and 2035
  • Figure 129: Middle East & Africa Market Y-o-Y Growth Comparison by Application Platform, 2025-2035
  • Figure 130: Middle East & Africa Market Attractiveness Analysis by Application Platform
  • Figure 131: Middle East & Africa Market Value Share and BPS Analysis by Range, 2025 and 2035
  • Figure 132: Middle East & Africa Market Y-o-Y Growth Comparison by Range, 2025-2035
  • Figure 133: Middle East & Africa Market Attractiveness Analysis by Range
  • Figure 134: Middle East & Africa Market Value Share and BPS Analysis by Array Geometry, 2025 and 2035
  • Figure 135: Middle East & Africa Market Y-o-Y Growth Comparison by Array Geometry, 2025-2035
  • Figure 136: Middle East & Africa Market Attractiveness Analysis by Array Geometry
  • Figure 137: Middle East & Africa Market Value Share and BPS Analysis by Components, 2025 and 2035
  • Figure 138: Middle East & Africa Market Y-o-Y Growth Comparison by Components, 2025-2035
  • Figure 139: Middle East & Africa Market Attractiveness Analysis by Components
  • Figure 140: Global Market - Tier Structure Analysis
  • Figure 141: Global Market - Company Share Analysis

Frequently Asked Questions

How big is the electronically scanned arrays system market in 2025?

The global electronically scanned arrays system market is estimated to be valued at USD 10.2 billion in 2025.

What will be the size of electronically scanned arrays system market in 2035?

The market size for the electronically scanned arrays system market is projected to reach USD 18.8 billion by 2035.

How much will be the electronically scanned arrays system market growth between 2025 and 2035?

The electronically scanned arrays system market is expected to grow at a 6.3% CAGR between 2025 and 2035.

What are the key product types in the electronically scanned arrays system market?

The key product types in electronically scanned arrays system market are active and passive.

Which application platform segment to contribute significant share in the electronically scanned arrays system market in 2025?

In terms of application platform, land segment to command 41.7% share in the electronically scanned arrays system market in 2025.

Explore Similar Insights

Future Market Insights

Electronically Scanned Arrays System Market

Chat With

MaRIA

Hi There, I am MaRIA, Your Market Research Intelligence Assistant. How may I help you?