The global electronic sealants market is projected to grow from USD 1.2 billion in 2025 to USD 3 billion by 2035, advancing at a CAGR of 9.3%. The first half of the decade (2025-2030) will see the market increase from USD 1.2 billion to approximately USD 1.88 billion, adding USD 0.64 billion in value, which constitutes 34% of the total forecasted growth period. This phase will be characterized by the rapid adoption of thermally conductive gap fillers, driven by increasing power density in electronics and the growing need for efficient heat dissipation in EV battery systems worldwide. Based on FMI’s verified global materials database, covering industrial resins, coatings, and additives, advanced low-VOC silicone chemistries and automated dispensing compatibility will become standard expectations rather than premium options.
The latter half (2030-2035) will witness growth from USD 1.88 billion to USD 3 billion, representing an addition of USD 1.14 billion or 66% of the decade's expansion. This period will be defined by mass market penetration of semiconductor packaging materials, integration with comprehensive autonomous vehicle electronics, and seamless compatibility with miniaturized device architectures. The market trajectory signals fundamental shifts in how electronics manufacturers approach reliability enhancement and thermal management optimization, with participants positioned to benefit from demand across multiple chemistry types and application segments.
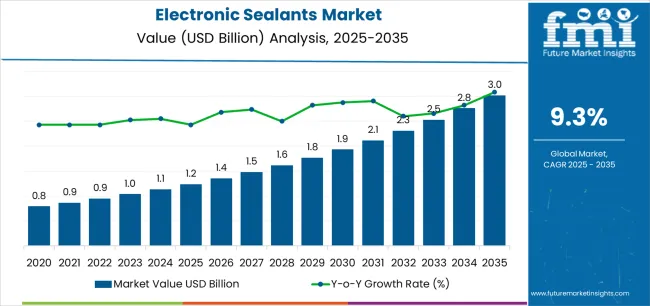
FMI’s verified research on advanced composites and performance materials indicates that the electronic sealants market exhibits distinct growth phases, characterized by varying market characteristics and competitive dynamics. Between 2025 and 2030, the market progresses through its phase of accelerated electrification, expanding from USD 1.2 billion to USD 1.88 billion with steady annual increments, averaging 9.3% growth. This period marks the transition from traditional epoxy formulations to advanced silicone systems, featuring enhanced thermal conductivity and integrated reliability features, which have become mainstream in various applications.
The 2025-2030 phase adds USD 0.64 billion to market value, representing 34% of total decade expansion. Market maturation factors include standardization of thermal interface material specifications, declining unit costs for high-performance silicone gap fillers, and increasing OEM awareness of thermal management benefits achieving 3-8 W/m·K thermal conductivity in power electronics applications. Competitive landscape evolution during this period features established materials suppliers like Dow and Henkel expanding their electronic-grade portfolios while specialty chemical companies focus on advanced formulation development and enhanced processing capabilities.
From 2030 to 2035, market dynamics shift toward semiconductor packaging integration and global 5G infrastructure deployment, with growth continuing from USD 1.88 billion to USD 3 billion, adding USD 1.14 billion or 66% of total expansion. This phase transition centers on advanced underfill materials, integration with chiplet architectures, and deployment across diverse electronics miniaturization scenarios, becoming standard rather than specialized applications. The competitive environment matures with focus shifting from basic protection to comprehensive reliability optimization systems and integration with automated manufacturing platforms.
| Metric | Value |
|---|---|
| Market Value (2025) | USD 1.2 billion |
| Market Forecast (2035) | USD 3 billion |
| Growth Rate | 9.3% CAGR |
| Leading Chemistry | Silicone-based formulations |
| Primary End Use | Automotive & EV Segment |
The market demonstrates strong fundamentals with silicone-based sealants capturing a dominant share through superior thermal stability and comprehensive application versatility. Automotive and EV applications drive primary demand, supported by increasing electrification and advanced driver assistance system proliferation. Geographic expansion remains concentrated in Asia-Pacific electronics manufacturing hubs with established semiconductor and automotive production infrastructure, while developed markets show accelerating adoption rates driven by 5G deployment and aerospace electronics sophistication.
Market expansion rests on three fundamental shifts driving adoption across the electronics and automotive sectors. First, electric vehicle electrification creates compelling thermal management demand through electronic sealants that enable battery pack heat dissipation without performance degradation, supporting automakers' range optimization missions while maintaining safety standards and extending battery lifespan. Second, semiconductor packaging advancement accelerates as chip manufacturers worldwide seek advanced underfill and encapsulation materials enabling higher I/O density, supporting Moore's Law continuation that aligns with computing performance requirements and miniaturization trends.
Third, 5G infrastructure deployment drives adoption from telecommunications equipment manufacturers requiring environmental protection and thermal management for base station electronics operating in outdoor conditions during network densification. The growth faces headwinds from raw material price volatility that varies across silicone monomer markets, which may limit formulation economics in cost-sensitive consumer electronics. Application complexity challenges also persist regarding automated dispensing compatibility and cure time optimization that may reduce manufacturing throughput in high-volume assembly operations, affecting production efficiency.
The electronic sealants market represents a critical electronics reliability opportunity driven by expanding electric vehicle production, semiconductor packaging evolution, and the need for environmental protection in telecommunications infrastructure. As automotive engineers worldwide seek to manage heat fluxes in battery packs and power electronics, semiconductor manufacturers pursue advanced packaging enabling chiplet integration, and telecom operators require weatherproof base station equipment, electronic sealants are evolving from basic protective coatings to sophisticated materials ensuring performance, reliability and thermal optimization.
The convergence of automotive electrification acceleration, semiconductor heterogeneous integration trends, and 5G network expansion creates demand drivers across multiple technology segments. The market's growth trajectory from USD 1.2 billion in 2025 to USD 3 billion by 2035 at a 9.3% CAGR reflects fundamental shifts in electronics protection requirements and thermal management optimization.
Geographic expansion opportunities are particularly pronounced in Asia-Pacific markets, where China (10.0% CAGR) and India (9.5% CAGR) lead through EV manufacturing scaling and electronics production localization. The dominance of silicone-based chemistries (68.2% market share) and automotive & EV applications (34.0% share) provides clear strategic focus areas, while emerging semiconductor packaging materials and 5G infrastructure protection open new revenue streams.
Strengthening the dominant silicone-based segment (68.2% market share) through enhanced RTV formulations, advanced thermal conductivity optimization, low-volatile silicone gels, and seamless compatibility with automated dispensing equipment. This pathway focuses on improving thermal conductivity to 5-10 W/m·K, extending operational temperature ranges to -55°C to +200°C, reducing outgassing for vacuum applications, and developing REACH-compliant low-VOC chemistries. Market leadership consolidation through materials science innovation and comprehensive OEM qualification enables premium positioning. Expected revenue pool: USD 0.65-1.05 billion
Expansion within automotive & EV segment (34.0% market share) through battery pack gap fillers, power electronics thermal interface materials, ADAS sensor encapsulation, and comprehensive vehicle electronics protection addressing electrification requirements. This pathway encompasses high-dielectric-strength formulations, flame-retardant compliance, vibration dampening characteristics, and long-term reliability for 10-15 year vehicle lifecycles. Premium positioning reflects automotive qualification, supply chain integration, and comprehensive testing validation. Expected revenue pool: USD 0.35-0.55 billion
Development within thermal management application (28.0% market share) addressing high-power computing, EV inverters, 5G base stations, and LED lighting requiring effective heat transfer from semiconductor dies and power modules to heat sinks. This pathway encompasses phase-change materials, silicone-free alternatives for sensitive applications, and conformable gap fillers for uneven surfaces. Technology differentiation through thermal performance optimization and comprehensive reliability testing enables premium positioning. Expected revenue pool: USD 0.30-0.50 billion
Rapid electronics production and EV manufacturing growth across China (10.0% CAGR) and India (9.5% CAGR) creates substantial opportunities through local materials supply, semiconductor packaging partnerships, and comprehensive technical service infrastructure. Growing EV battery production, 5G base station deployment, and consumer electronics manufacturing drive demand for electronic protection materials. Localization strategies reduce import dependency, enable faster technical support, and position companies advantageously for domestic content requirements. Expected revenue pool: USD 0.40-0.65 billion
Strategic expansion within potting & encapsulation applications (24.0% market share) requires deep-pour epoxy systems, flame-retardant polyurethane formulations, and comprehensive environmental protection for power supplies, motor controllers, and sensor modules. This pathway addresses moisture barrier properties, thermal shock resistance, chemical compatibility, and comprehensive UL/IEC certification for safety-critical electronics. Premium pricing reflects reliability assurance, regulatory compliance, and comprehensive application engineering support. Expected revenue pool: USD 0.25-0.40 billion
Integration with semiconductor packaging evolution including underfill materials (9.0% share) for flip-chip assemblies, capillary underfill for fine-pitch applications, and molded underfill for high-volume production supporting chiplet architectures and heterogeneous integration. This pathway encompasses low-temperature cure formulations, coefficient of thermal expansion matching, and comprehensive reliability for solder joint protection. Premium positioning through semiconductor industry qualification and advanced packaging expertise creates technology leadership. Expected revenue pool: USD 0.20-0.35 billion
Development within telecommunications segment (12.0% market share) addressing 5G base station electronics, fiber optic components, and edge computing equipment requiring environmental protection, thermal management, and long-term reliability for outdoor installations. This pathway encompasses UV-resistant formulations, salt-fog corrosion protection, and comprehensive weatherability for telecom infrastructure. Technology differentiation through proven field reliability and telecom carrier approvals enables market positioning. Expected revenue pool: USD 0.15-0.25 billion
Primary Classification: The market segments by type into Silicone-based (incl. RTV & gels), Epoxy, Polyurethane, and Acrylic & others categories, representing the evolution from traditional protective coatings to advanced thermal interface materials for comprehensive electronics reliability.
Secondary Classification: Application segmentation divides the market into Thermal management & gap fillers, Potting & encapsulation, Conformal coating, Underfill, and Surface mounting & other protection sectors, reflecting distinct requirements for heat dissipation, environmental protection, and mechanical stress relief.
Tertiary Classification: End-use segmentation encompasses Automotive & EV, Electrical & electronics, Aerospace & defense, Telecommunication, and Others, representing diverse industry applications.
Regional Classification: Geographic distribution covers Asia Pacific, North America, Europe, Latin America, and Middle East & Africa, with major electronics manufacturing regions leading consumption while developed markets drive premium application adoption.
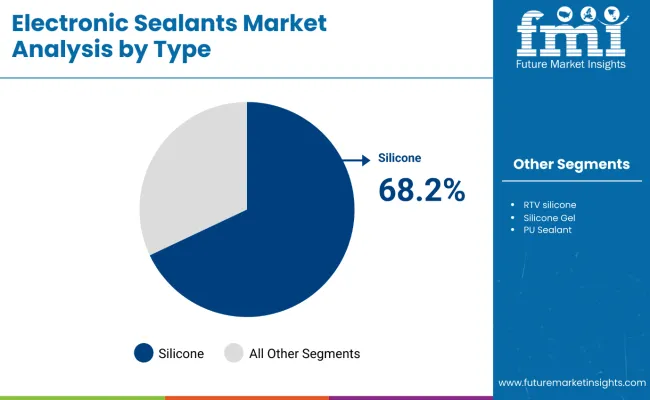
Market Position: Silicone-based formulations command the leading position in the Electronic Sealants market with approximately 68.2% market share through superior thermal stability, flexibility retention, and comprehensive application coverage enabling electronics manufacturers to achieve optimal protection and thermal management across diverse operating conditions from cryogenic to elevated temperatures.
Value Drivers: The segment benefits from electronics manufacturer preference for versatile chemistries providing consistent performance across wide temperature ranges (-55°C to +200°C), excellent electrical insulation properties, and resistance to moisture, chemicals, and UV exposure enabling automotive, aerospace, and telecommunications applications. Advanced silicone formulations enable thermal conductivity enhancement through ceramic filler loading, automated dispensing compatibility, and integration with high-volume assembly processes, where material reliability and processing efficiency represent critical manufacturing requirements.
Competitive Advantages: Silicone-based sealants differentiate through proven long-term stability, low-temperature flexibility retention, and compatibility with sensitive electronics that enhance system reliability while maintaining optimal protection suitable for mission-critical applications from automotive safety systems to aerospace avionics.
Key market characteristics:
Epoxy formulations maintain 12.8% market share through superior adhesion to diverse substrates, excellent chemical resistance, and high-temperature capability for potting, encapsulation, and structural bonding applications. These materials appeal to power electronics and industrial equipment manufacturers requiring permanent environmental protection and mechanical reinforcement for circuit assemblies and sensor modules. Market growth is driven by power module packaging emphasizing robust encapsulation for IGBTs, SiC devices, and high-voltage electronics requiring dielectric strength and thermal cycling durability.
Polyurethane materials hold approximately 8.4% market share, focusing on flexible potting compounds, vibration dampening applications, and low-temperature cure formulations for temperature-sensitive components requiring environmental protection without thermal stress during curing processes.
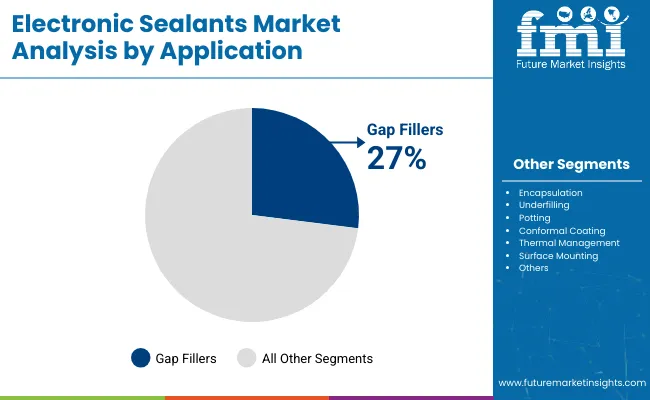
Market Context: Thermal management and gap filler applications command approximately 28% market share due to escalating power density trends in electronics and increasing focus on heat dissipation optimization enabling reliable operation of high-performance processors, power electronics, and LED lighting systems that generate substantial heat requiring effective thermal interface materials.
Appeal Factors: Electronics designers prioritize thermal conductivity performance, interface compliance filling air gaps between heat sources and heat sinks, and long-term thermal stability enabling consistent heat transfer throughout product lifecycles. The segment benefits from substantial computing infrastructure investment and automotive electrification programs emphasizing thermal management for processors, battery modules, and power conversion electronics.
Growth Drivers: AI accelerator deployment incorporates thermally conductive gap fillers as standard thermal solutions for GPU and ASIC cooling exceeding 500W power dissipation, while EV adoption increases demand for battery thermal management materials maintaining optimal operating temperatures for safety and performance.
Market Challenges: Varying surface roughness and gap tolerances may limit standardization across different electronic assemblies requiring customized viscosity and filler loading optimization.
Application dynamics include:
Potting and encapsulation captures approximately 24.0% market share through comprehensive environmental protection for power supplies, motor drives, and outdoor electronics requiring moisture barrier, mechanical shock absorption, and electrical insulation for harsh operating environments including automotive underhood, industrial, and outdoor telecommunications installations.
Conformal coating accounts for approximately 18.5% market share, including acrylic, silicone, and urethane chemistries protecting printed circuit boards from moisture, dust, and chemical exposure in consumer electronics, automotive electronics, and industrial control systems requiring reliable operation across diverse environmental conditions.
Growth Accelerators: Electric vehicle production acceleration drives primary adoption as electronic sealants enable battery thermal management and power electronics cooling supporting automotive OEM electrification missions through materials providing 3-8 W/m·K thermal conductivity enabling optimal operating temperatures for safety, performance, and longevity across diverse climate conditions. Semiconductor packaging evolution intensifies market expansion as advanced node processes and chiplet architectures require sophisticated underfill materials, encapsulants, and thermal interface solutions enabling higher interconnect densities and improved thermal dissipation supporting computing performance advancement and Moore's Law continuation. Telecommunications infrastructure deployment increases worldwide through 5G base station installations, fiber network expansion, and edge computing facilities creating demand for environmental protection and thermal management materials supporting reliable outdoor electronics operation across diverse environmental conditions including temperature extremes, humidity, and UV exposure.
Growth Inhibitors: Raw material cost volatility varies across silicone feedstock markets regarding dimethyldichlorosilane pricing dynamics and supply availability, which may compress formulator margins and limit price competitiveness in cost-sensitive consumer electronics applications where material costs represent significant portion of electronics value affecting adoption rates. Application complexity challenges persist regarding automated dispensing equipment compatibility, cure time optimization for high-volume manufacturing, and voiding control in thermal interface applications that may reduce production throughput and quality yield affecting manufacturing economics and material specification decisions. Market fragmentation across diverse electronics end-uses and custom specification requirements creates standardization difficulties between material suppliers and OEMs, requiring extensive qualification testing and application development that increase commercialization costs and extend time-to-market for new formulations.
Market Evolution Patterns: Adoption accelerates in automotive electrification and high-performance computing segments where thermal management and reliability requirements justify premium electronic sealant investments, with geographic concentration in Asia-Pacific electronics manufacturing transitioning toward broader adoption in industrial and telecommunications applications driven by proven performance benefits and declining material costs. Technology development focuses on enhanced thermal conductivity through advanced filler systems, improved sustainability including bio-based silicones and recycled content integration, and compatibility with automated Industry 4.0 manufacturing optimizing material placement precision and process monitoring. The market could face disruption if alternative thermal management technologies including vapor chambers, heat pipes, or solid-state cooling significantly reduce thermal interface material requirements, or if electronics architecture changes toward chiplet disaggregation fundamentally alter packaging material needs and application methods.
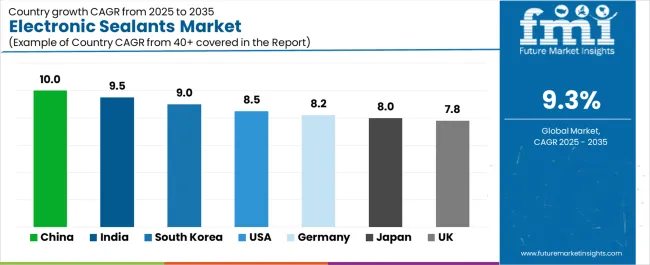
The Electronic Sealants market demonstrates varied regional dynamics with Growth Leaders including China (10.0% CAGR) and India (9.5% CAGR) driving expansion through EV production scaling and electronics manufacturing growth. Steady Performers encompass South Korea (9.0% CAGR), United States (8.5% CAGR), and Germany (8.2% CAGR), benefiting from established semiconductor and automotive industries. Mature Markets feature Japan (8.0% CAGR) and United Kingdom (7.8% CAGR), where precision electronics and 5G infrastructure support consistent growth.
| Country | CAGR (2025-2035) |
|---|---|
| China | 10.0% |
| India | 9.5% |
| South Korea | 9.0% |
| United States | 8.5% |
| Germany | 8.2% |
| Japan | 8.0% |
| United Kingdom | 7.8% |
Regional synthesis reveals Asia-Pacific markets leading adoption through electronics manufacturing concentration and EV production scaling, while developed markets show strong growth supported by semiconductor packaging innovation and advanced automotive electronics proliferation.
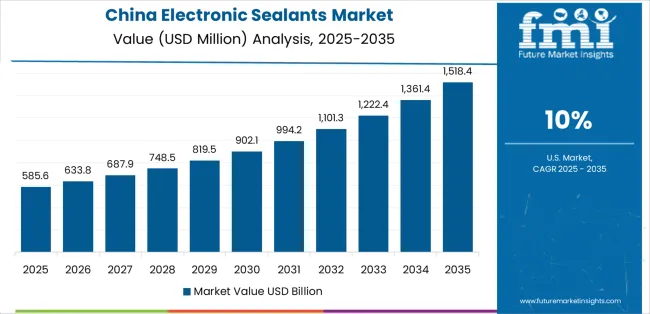
China establishes exceptional growth leadership through aggressive electric vehicle and battery production scaling requiring thermal management materials for battery packs, inverters, and charging systems, localization initiatives in semiconductor packaging materials supporting domestic chip production and advanced packaging capabilities, and comprehensive 5G base station deployment across urban and rural regions requiring environmental protection for outdoor telecommunications equipment, integrating electronic sealants as critical enabling materials for technology infrastructure development. The country's 10.0% CAGR reflects national industrial policies supporting EV adoption, semiconductor self-sufficiency, and digital infrastructure advancement requiring sophisticated electronics protection and thermal management solutions.
Growth concentrates in major manufacturing clusters including Pearl River Delta, Yangtze River Delta, and Beijing-Tianjin-Hebei regions, where electronic sealant consumption showcases integrated demand from automotive OEMs, contract electronics manufacturers, and telecommunications equipment producers. Chinese electronics manufacturers are implementing advanced materials including domestically-produced silicone sealants and imported specialty formulations combining cost competitiveness with improving performance characteristics meeting automotive and telecommunications specifications.
Strategic Market Indicators:
Indian electronic sealants market demonstrates robust growth through "Make in India" electronics manufacturing services expansion supporting smartphone, consumer electronics, and automotive electronics assembly, data center construction programs requiring server cooling and infrastructure protection materials, and telecommunications network densification supporting 4G expansion and 5G pilot deployments requiring base station and fiber equipment protection. The market holds 9.5% CAGR, supported by government production-linked incentive schemes promoting domestic electronics manufacturing and digital infrastructure investment programs driving telecommunications equipment demand.
Market expansion benefits from multinational electronics contract manufacturers establishing India operations requiring materials supply chains and technical support infrastructure. Technology adoption follows established electronics manufacturing patterns where proven formulations and supplier relationships from other markets transfer to India operations with localization of distribution and technical service capabilities.
Market Intelligence Brief:
The advanced electronics market in South Korea demonstrates sophisticated electronic sealant applications through leading-edge memory and display manufacturing requiring advanced packaging materials and process integration, global EV battery supply chain participation including LG Energy Solution and Samsung SDI requiring thermal management expertise, and comprehensive adoption of low-VOC silicone formulations supporting environmental leadership and worker safety objectives. The country maintains 9.0% CAGR driven by semiconductor technology leadership, battery export dominance, and stringent environmental standards advancing eco-friendly materials adoption.
Korean electronics manufacturers prioritize materials performance, process reliability, and comprehensive technical support creating demand for premium electronic sealants with proven qualification in demanding applications. Market dynamics emphasize close supplier-customer collaboration, rapid new product introduction cycles, and continuous materials optimization supporting technology advancement.
Market Intelligence Brief:
USA market expansion benefits from CHIPS and Science Act driving domestic semiconductor manufacturing capacity including advanced packaging facilities requiring materials supply infrastructure, rapid EV platform launches from established OEMs and startups requiring battery thermal management and power electronics protection, and aerospace and defense electronics programs requiring high-reliability sealants for harsh environment applications including avionics, satellites, and military systems. The country maintains 8.5% CAGR driven by semiconductor reshoring, automotive electrification, and defense modernization programs requiring sophisticated electronics protection materials.
American market emphasizes performance validation, comprehensive qualification testing, and long-term reliability assurance supporting aerospace, defense, and automotive applications where material failure consequences drive rigorous supplier evaluation and ongoing quality monitoring. Growing domestic semiconductor capacity creates demand for packaging materials supply chains and technical service infrastructure supporting USA-based manufacturing operations.
Strategic Market Considerations:
The advanced automotive market in Germany showcases sophisticated electronic sealant applications driven by comprehensive vehicle electrification, including battery electric, plug-in hybrid, and fuel cell platforms that demand thermal management and environmental protection. The market also benefits from the proliferation of ADAS technologies, with camera, radar, and lidar sensors requiring encapsulation and sealing solutions. Industry 4.0 automation adoption boosts demand for industrial electronics protection and thermal management. Germany's adherence to REACH-aligned halogen-free chemistries further supports the country's commitment to stringent European environmental regulations and automotive OEM eco-conscious goals. With a 8.2% CAGR, the market is propelled by automotive industry transformation, industrial automation leadership, and a robust environmental compliance framework driving the adoption of eco-friendly materials.
German automotive tier suppliers prioritize comprehensive materials qualification, long-term reliability validation, and supplier partnership models creating stable relationships with electronic sealant manufacturers. Market dynamics emphasize technical excellence, environmental compliance, and continuous improvement supporting automotive quality standards and regulatory requirements.
Market Intelligence Brief:
The advanced electronics market in Unite Kingdom demonstrates sophisticated electronic sealant applications through comprehensive 5G network deployment including macro cell sites, small cell installations, and distributed antenna systems requiring outdoor environmental protection and thermal management, edge computing infrastructure supporting data center distribution and low-latency processing requiring electronics cooling and moisture protection, electrified drivetrain adoption in premium automotive brands including Jaguar Land Rover battery electric platforms, luxury German imports, and performance vehicle electrification requiring sophisticated thermal interface materials and battery pack sealing, and UKCA regulatory alignment driving materials qualification updates, testing documentation, and supplier certification supporting post-Brexit regulatory framework compliance and market access requirements. The country maintains 7.8% CAGR driven by telecommunications infrastructure investment, premium automotive transformation, and regulatory framework establishment supporting domestic manufacturing capability and supply chain development.
British automotive tier suppliers and telecommunications equipment manufacturers prioritize comprehensive materials testing, environmental performance validation, and technical partnership models creating collaborative relationships with electronic sealant suppliers.
Strategic Market Indicators:
Japan shows steady market development with 8.0% CAGR, distinguished by miniaturized robotics and electronics applications requiring precision dispensing and ultra-thin bond lines, high-reliability sealants for harsh environment applications including automotive, industrial, and infrastructure electronics requiring proven long-term performance, and Green Growth Strategy compliance supporting government initiatives and corporate environmental commitments through low-VOC and recyclable formulations. The market prioritizes proven performance, extensive qualification testing, and comprehensive technical documentation reflecting Japanese manufacturing quality standards and reliability engineering practices.
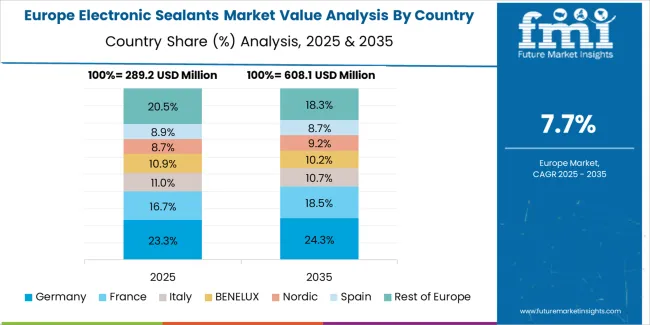
Western and Eastern Europe together represented USD 0.34 billion of electronic sealants demand in 2025. Germany leads European consumption with approximately 22% (USD 0.07 billion) driven by automotive electrification, ADAS electronics proliferation, and smart factory automation requiring comprehensive electronics protection and thermal management. France follows with approximately 16% (USD 0.05 billion) supported by aerospace and defense avionics programs and telecommunications infrastructure investments. United Kingdom holds approximately 14% (USD 0.05 billion) reflecting 5G network roll-outs, data center construction, and premium automotive applications. Italy commands approximately 12% (USD 0.04 billion) with white goods electronics, consumer devices, and e-powertrain assembly operations. Spain accounts for approximately 9% (USD 0.03 billion) driven by automotive component manufacturing and renewable energy inverter production. Netherlands captures approximately 7% (USD 0.02 billion) serving as logistics-driven electronics manufacturing services hub and semiconductor equipment manufacturing. Nordics and Rest of Europe represent approximately 20% (USD 0.07 billion) adding steady demand from offshore wind power electronics, industrial control systems, and high-reliability electronics applications. The regional market structure reflects comprehensive environmental compliance driving low-VOC formulation adoption, automotive industry sophistication requiring advanced thermal management solutions, and telecommunications infrastructure supporting 5G and fiber network deployment across commercial, industrial, and residential applications.
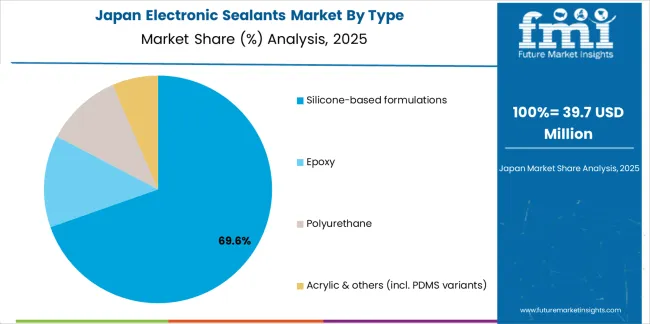
In Japan, the Electronic Sealants market prioritizes advanced silicone-based thermally conductive gap filler formulations, which capture the dominant automotive and industrial segment share through proven reliability for EV battery modules, power electronics cooling, and precision equipment thermal management. Japanese manufacturers emphasize consistent thermal performance, low thermal resistance interfaces, and comprehensive environmental durability testing, creating demand for premium silicone materials providing optimal heat transfer characteristics and long-term stability based on demanding automotive qualification requirements and industrial equipment specifications for mission-critical thermal management applications supporting electrification and automation initiatives.
Market Characteristics:
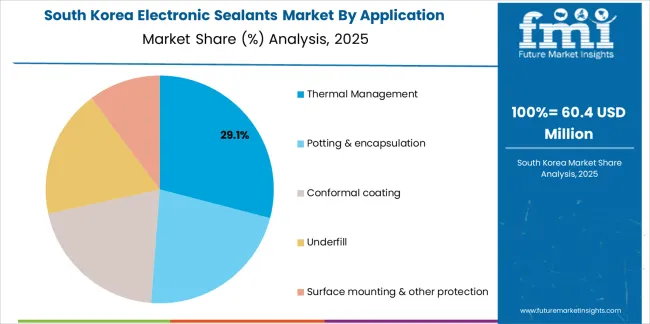
In South Korea, the market structure favors international electronic materials suppliers including Dow, Shin-Etsu, Henkel, and Wacker, which maintain dominant positions through comprehensive product portfolios spanning thermal management, potting, and packaging materials and established relationships with Samsung, SK Hynix, LG, and tier-1 electronics manufacturers supporting memory fabrication, display production, and battery manufacturing installations. These providers offer integrated solutions combining advanced formulation technology with professional application engineering services and ongoing technical support appealing to Korean manufacturers seeking reliable materials supply and process optimization expertise. Domestic materials companies capture moderate market share through cost-competitive formulations and localized service for consumer electronics and industrial applications.
Channel Insights:
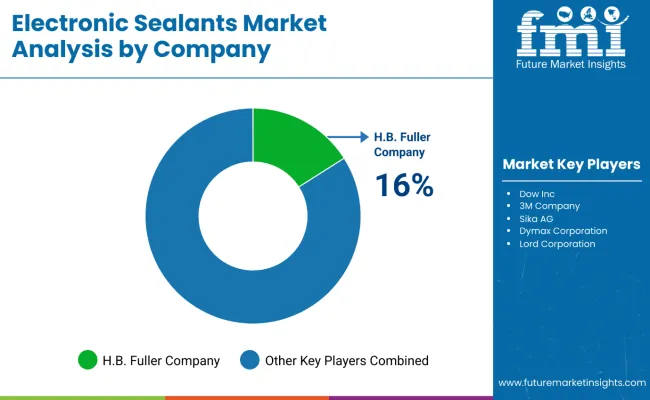
The electronic sealants market operates with moderate concentration, featuring approximately 15-25 meaningful participants, where leading companies control roughly 50-55% of the global market share through established electronics OEM relationships and comprehensive formulation portfolios. Dow Inc. maintains the leading position with approximately 16.0% market share through extensive DOWSIL silicone technology platform and global application engineering infrastructure. Competition emphasizes thermal performance, reliability validation, and technical service capability rather than price-based rivalry.
Market Leaders encompass Dow Inc., Henkel AG & Co. KGaA, and 3M Company, which maintain competitive advantages through extensive materials science expertise, global manufacturing and distribution networks, and comprehensive automotive and electronics industry relationships creating supply chain integration and supporting premium positioning. These companies leverage decades of silicone chemistry experience and ongoing R&D investments to develop advanced formulations with enhanced thermal conductivity, improved processing characteristics, and proven long-term reliability supporting mission-critical electronics applications.
Technology Innovators include Shin-Etsu Chemical Co. Ltd., Wacker Chemie AG, and Momentive Performance Materials Inc., which compete through specialized silicone technology focus and innovative thermal interface materials that appeal to automotive and semiconductor customers seeking advanced performance characteristics and comprehensive qualification support. These companies differentiate through rapid custom formulation development and specialized application expertise.
Regional Specialists feature companies like H.B. Fuller Company, Sika AG, and Dymax Corporation, which focus on specific application segments including potting compounds, conformal coatings, and UV-cure adhesives. Market dynamics favor participants that combine reliable material performance with comprehensive technical services including thermal modeling, application engineering, and automated dispensing integration support. Competitive pressure intensifies as automotive OEMs consolidate electronic materials suppliers while specialty chemical companies challenge established players through innovative bio-based formulations and green chemistry platforms targeting environmentally-conscious automotive and electronics manufacturers.
| Item | Value |
|---|---|
| Quantitative Units | USD 1.2 billion |
| Type | Silicone-based (incl. RTV & gels), Epoxy, Polyurethane, Acrylic & others |
| Application | Thermal management & gap fillers, Potting & encapsulation, Conformal coating, Underfill, Surface mounting & other protection |
| End Use | Automotive & EV, Electrical & electronics, Aerospace & defense, Telecommunication, Others |
| Regions Covered | North America, Europe, Asia Pacific, Latin America, Middle East & Africa |
| Countries Covered | China, India, South Korea, United States, Germany, Japan, United Kingdom, and 25+ additional countries |
| Key Companies Profiled | Dow Inc., Henkel AG & Co. KGaA, 3M Company, Shin-Etsu Chemical Co. Ltd., Wacker Chemie AG, Momentive Performance Materials Inc. |
| Additional Attributes | Dollar sales by chemistry type and application categories, regional adoption trends across Asia-Pacific, North America, and Europe, competitive landscape with specialty chemical manufacturers and electronics materials suppliers, customer preferences for thermal conductivity performance and reliability characteristics, integration with automotive OEM platforms and semiconductor packaging processes, innovations in thermally conductive formulations and low-VOC chemistries, and development of eco-friendly materials with enhanced bio-based content and circular economy participation capabilities. |
The global electronic sealants market is estimated to be valued at USD 1.2 billion in 2025.
The market size for the electronic sealants market is projected to reach USD 3.0 billion by 2035.
The electronic sealants market is expected to grow at a 9.3% CAGR between 2025 and 2035.
The key product types in electronic sealants market are silicone-based formulations , epoxy, polyurethane and acrylic & others (incl. pdms variants).
In terms of application, thermal management segment to command 28.0% share in the electronic sealants market in 2025.


Full Research Suite comprises of:
Market outlook & trends analysis
Interviews & case studies
Strategic recommendations
Vendor profiles & capabilities analysis
5-year forecasts
8 regions and 60+ country-level data splits
Market segment data splits
12 months of continuous data updates
DELIVERED AS:
PDF EXCEL ONLINE
Electronic Circulation Pump Market Size and Share Forecast Outlook 2025 to 2035
Electronic Lab Notebook (ELN) Market Size and Share Forecast Outlook 2025 to 2035
Electronic Control Unit in Automotive Systems Market Size and Share Forecast Outlook 2025 to 2035
Electronic Film Market Size and Share Forecast Outlook 2025 to 2035
Electronic Weighing Scale Market Size and Share Forecast Outlook 2025 to 2035
Electronic Packaging Adhesives Market Forecast and Outlook 2025 to 2035
Electronic Nasal Spray Devices Market Size and Share Forecast Outlook 2025 to 2035
Electronic Expansion Valves Market Size and Share Forecast Outlook 2025 to 2035
Electronics Adhesives Market Size and Share Forecast Outlook 2025 to 2035
Electronic Tactile Tester Market Size and Share Forecast Outlook 2025 to 2035
Electronic Trial Master File (eTMF) System Market Size and Share Forecast Outlook 2025 to 2035
Electronic Wipes Market Size and Share Forecast Outlook 2025 to 2035
Electronic Grade Trisilylamine Market Size and Share Forecast Outlook 2025 to 2035
Electronically Scanned Arrays System Market Size and Share Forecast Outlook 2025 to 2035
Electronics Retailing Market Size and Share Forecast Outlook 2025 to 2035
Electronic Dictionary Market Size and Share Forecast Outlook 2025 to 2035
Electronic Shelf Label Market Analysis - Size, Share, and Forecast Outlook 2025 to 2035
Electronics Films Market Size and Share Forecast Outlook 2025 to 2035
Electronic Payment System For Transportation Market Size and Share Forecast Outlook 2025 to 2035
Electronic Skin Market Analysis - Size, Share, and Forecast Outlook 2025 to 2035

Thank you!
You will receive an email from our Business Development Manager. Please be sure to check your SPAM/JUNK folder too.
Chat With
MaRIA