Reports

- Global Locations -

Headquarters

Future Market Insights, Inc.

Christiana Corporate, 200
Continental Drive, Suite 401,
Newark, Delaware - 19713,
United States

T: +1-845-579-5705

Americas

Future Market Insights, Inc.

616 Corporate Way, Suite 2-9018,
Valley Cottage, NY 10989, United States

T: +1-347-918-3531

MEA

Future Market Insights

1602-6 Jumeirah Bay X2 Tower, Plot No: JLT-PH2-X2A,
Jumeirah Lakes Towers, Dubai,
United Arab Emirates

Europe

Future Market Insights

3rd Floor, 207 Regent Street,
W1B 3HH London
United Kingdom

T: + 44 (0) 20 8123 9659
D: +44 (0) 20 3287 4268

Asia Pacific

Future Market Insights

IndiaLand Global Tech Park, Unit UG-1, Behind Grand HighStreet, Phase 1, Hinjawadi, MH, Pune – 411057, India

Electronic Film Market Overview from 2024 to 2034

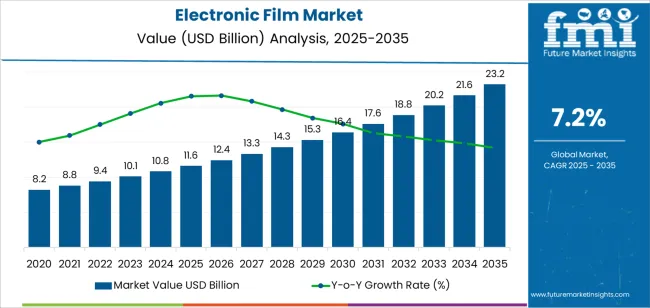
The electronic film market is expected to hit US$ 10.8 billion in 2024. From 2024 to 2034, sales of electronic films are predicted to evolve at a CAGR of 7.2%. The demand for electronic films is projected to reach a value of US$ 21.6 billion by 2034.

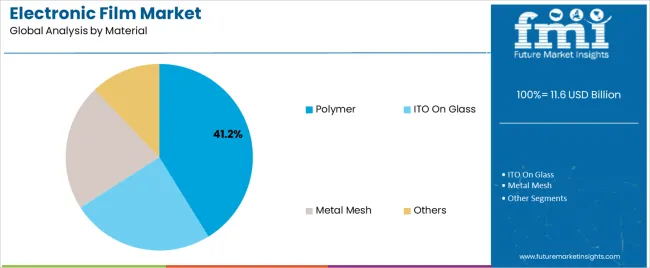
The adoption of electronic films, made of a specially formulated polymer or ITO, improves electrical equipment performance and endurance. The growing digitization of industrial and consumer electronics sectors propels electronic film market growth opportunities.

The market is constrained by higher research and development costs associated with producing electronic films.

Attributes Details
Electronic Film Market Value for 2024 US$ 10.8 billion
Projected Market Value by 2034 US$ 21.6 billion
CAGR from 2024 to 2034 7.2%

Don't pay for what you don't need

Customize your report by selecting specific countries or regions and save 30%!

Determinants of Electronic Film Market Growth

  • The demand for electronic films that improve functionality, performance, and durability is fueled by advancements in electronics, notably in displays and sensors.
  • The robust and flexible electronics market that tolerates bending and stretching without losing functionality is stimulated by the growing popularity of wearable technology, such as fitness trackers and smartwatches.
  • Manufacturers of electronic packaging films are responding to consumer demand for environmentally friendly electronics by creating electronic films using eco-friendly materials and production techniques. This is a result of the growing environmental consciousness.
  • The rapid adoption of electronic films into new applications and developing markets, such as flexible displays, electronic skin, and Internet of Things (IoT) devices, creates additional revenue opportunities for electronic film suppliers.
Attributes Details
Electronic Film Market Value in 2019 US$ 7.2 billion
Historical Market Value for 2023 US$ 10 billion
CAGR from 2019 to 2023 8.6%

Deterrents to Electronic Film Industry Progression

  • Adhering to numerous laws and guidelines regarding product labeling, environmental effects, and safety is difficult and expensive for producers of printed electronic films.
  • Variations in labor, energy, and raw materials costs are likely to impact pricing strategies and the profitability of producing electronic films.
  • Technological progress is anticipated to surpass the capacities of existing electronic film goods, resulting in their obsolescence and necessitating continuous innovation.
  • Electronic film producers must switch to more environmentally friendly production methods and materials in response to growing environmental sustainability awareness and regulatory pressure to cut waste and emissions.
Sudip Saha
Sudip Saha

Principal Consultant

Talk to Analyst

Find your sweet spots for generating winning opportunities in this market.

Comparative View of the Adjacent Electronic Film Market

The flexible barrier films for electronics market and the plastic dielectric film market have been discussed in conjunction with the electronic film market. The key attributes discussed in the tables below demonstrate the wide range of opportunities in these markets.

Electronic Film Market:

Attributes Electronic Film Market
Value-based CAGR (2024 to 2034) 7.2%
Growth Factor The growing adoption of self-healing electronic films extends electronic devices' lifespans.
Market Trend Innovations in transparent conductive films for touchscreens and sensors promote functional film market growth.
Market Restraint Slow adoption of electronic films because manufacturing software and equipment are expensive initially.

Flexible Barrier Films for Electronics Market:

Attributes Barrier Films for Flexible Electronics Market
Value-based CAGR (2024 to 2034) 18.7%
Growth Factor An increasing desire for lighter and thinner electrical gadgets compels flexible barrier film demand.
Market Trend High-performance barrier films are required to defend against environmental variables when adopting flexible OLED and AMOLED displays.
Market Restraint The absence of industry-wide guidelines for flexible barrier films makes collaborating difficult and impedes market expansion.

Plastic Dielectric Films Market:

Attributes Plastic Dielectric Films Market
Value-based CAGR (2024 to 2034) 4.1%
Growth Factor The demand for plastic dielectric films is stimulated by rising consumer electronics demand for capacitors.
Market Trend The growing emphasis on small, light electronics boosts the plastic dielectric films market.
Market Restraint The expansion of the plastic dielectric films market is impeded by environmental issues related to recycling and disposal.

Category-wise Outlook

Conductive Film Market Takes the Sales of Functional Films to Spotlight

Attributes Details
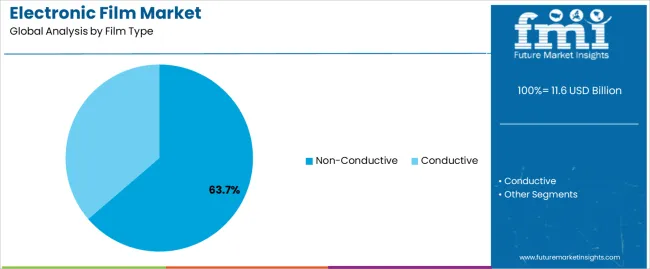
Top Film Type Conductive
CAGR (2019 to 2023) 8.5%
CAGR (2024 to 2034) 7.1%
  • The widespread adoption of conductive films emphasizes the value of dependable conductivity in various electronic applications, which aligns with changing industry standards.
  • Conductive films enable the trend toward downsizing electronic devices while preserving electrical functionality as they get smaller.
  • Since conductive film effectively dissipates heat, it is a favored option that guarantees the best possible performance from electrical components.
  • As it plays a vital role in ensuring dependable and robust communication for electronic devices across various applications, the conductive film segment is contributing to the market’s growth.

Thick Electronic Films Steer Sales of Functional Films

Attributes Details
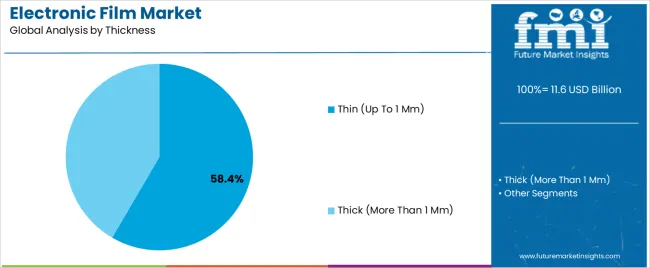
Top Thickness Thick (More than 1 mm)
CAGR (2019 to 2023) 8.3%
CAGR (2024 to 2034) 7.0%
  • Sales of thick electronic films are leading due to their adaptability and dependability in various industries looking for long-lasting and sturdy electronic solutions.
  • Increased material thickness enables greater load-bearing capacities, satisfying the needs of applications that necessitate significant mechanical strength.
  • In high-use settings, thick electrical films are preferred because they are more resilient to abrasion, resulting in longer product life.
  • The thicker segment serves industries with critical stability and dependability by offering better insulation and structural support.

Get the data you need at a Fraction of the cost

Personalize your report by choosing insights you need
and save 40%!

Country-wise Analysis

The table below provides an in-depth analysis of the growth potential of the market in major economies such as the United States, the United Kingdom, China, Japan, and South Korea. After careful examination, it is clear that the United Kingdom stands out in this industry, offering lucrative growth opportunities.

Countries CAGR (2024 to 2034)
United Kingdom 8.3%
South Korea 8.2%
Japan 7.9%
China 7.6%
United States 7.2%

Insights into the Electronic Film Market in the United Kingdom

  • The growing emphasis on energy-efficient solutions and smart building technologies propels the expansion of the market in the United Kingdom.
  • In the United Kingdom, the adoption of electronic films in the aerospace industry is becoming prevalent, emphasizing improving communication and entertainment systems aboard aircraft.
  • With increased solar energy applications and sustainable power generation, the United Kingdom's dedication to renewable energy sources impacts the electronic display film market.
  • Brexit uncertainty has affected the supply chain dynamics of the United Kingdom's electronic film coating market, forcing vendors to reevaluate their alliances and business plans.

Trends in the South Korean Electronic Film Market

  • South Korea's electronic protection film market is defined by its strong presence in the worldwide display sector and emphasis on producing high-quality films for TVs, smartphones, and other electronic gadgets.
  • A prominent trend in South Korea is using electronic films in wearable technology, focusing on robust and flexible films intended for fitness trackers and smartwatches.
  • The Korean government's encouragement of the electric vehicle sector influences the thin film electronics market, as film use in EV batteries and charging infrastructure is increasing.
  • The demand for electronic films in the telecommunications industry is compelled by South Korea's concentration on 5G technology, specifically developing improved antennas and communication devices.

Exploring Japan's Electronic Film Market

  • The aging population in Japan impacts the electronic film industry, increasing the demand for functional films used in the medical packaging industry and senior-friendly products.
  • The Japanese automobile industry is a noteworthy catalyst for the electronic film market, focusing increasingly on in-car displays, smart windows, and other electronic components.
  • Partnerships between Japanese electronic film producers and multinational tech behemoths are promoting the use of films in cutting-edge technologies like electronic skin applications and foldable displays.

Initiatives Propel Growth in China's Electronic Film Industry

  • Research and development expenditures are surging in the Chinese thin film electronics market, resulting in advances in nanotechnology and the creation of high-performance films for electronic devices.
  • Government programs that encourage innovation and the adoption of new technologies stimulate the expansion of China's electronic packaging film market, fostering a favorable environment for domestic and foreign businesses.
  • The adoption of electronic films in construction is speeding up in China due to the country's rapid urbanization and infrastructure development, with a focus on energy-efficient building solutions and smart glass in particular.

Driving Forces Shaping the United States’ Electronic Film Market

  • The United States' thin film electronics market is booming due to the rising usage of smart devices and strong demand for cutting-edge display technologies.
  • The demand for environmentally friendly films is rising due to the growing emphasis on sustainability and environmental issues in the United States.
  • The development of smart glass applications, in particular, is supporting technological developments in the automobile industry, fueling market growth.

Competitive Analysis

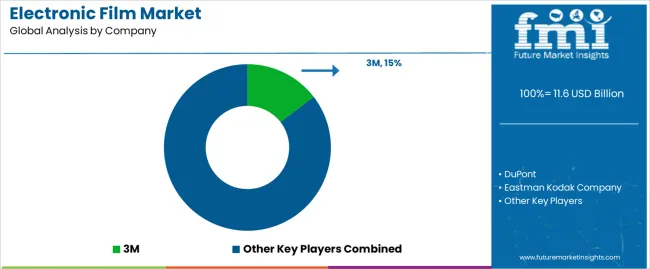
Leading manufacturers are 3M, DuPont, Eastman Kodak Company, Gunze Ltd., and Nitto Denko Co., which control the flexible substrate and electronic device film market. These electronic film providers have become industry leaders by staying at the forefront of innovation and maintaining a strong focus on quality.

3M is a global leader in performance and dependability due to its wide range of products and strong global footprint. With its knowledge of materials science, DuPont offers innovative solutions customized to match its clients' demand for functional films.

With its extensive experience in the image sector, Eastman Kodak Company uses its technological know-how to stay on the cutting edge. While Nitto Denko Co. is a leader in adhesive solutions for electronic applications, Gunze Ltd. is well-known for its expertise in touch panel technology.

By fostering innovation and expanding the realm of what is feasible in producing electronic devices, these electronic film vendors collectively influence the competitive environment of the thin film electronics market.

Latest Advancements

Company Details
DuPont As of May 31, 2022, DuPont announced in June 2022 that it had successfully closed the previously disclosed sale of its Biomaterials business unit to the Huafon Group for an estimated USD 240 million.
DuPont Leland Weaver, leader of DuPont's Water & Protection segment, conducted a virtual teach-in on the Shelter Solutions business line in June 2022.
KEMET The three series of PP capacitor films, C44U-M, C44P-R, and R75H, were introduced in July 2020 by KEMET, a well-known supplier of electrical components. These devices were designed with high-power conversion software systems in mind to accommodate industrial, renewable energy, and power storage applications.
DuPont DuPont's US$ 220 million investment in a new manufacturing unit at the Circleville, Ohio, factory was announced in March 2019. To address the rapidly increasing market demand in consumer electronics, automotive telecom, and defense, these new assets extend the manufacturing of DuPont Kapton Polyimide Film & Pyralux flexible circuit materials.
SKC, Inc. SKC, Inc. and a top electronics manufacturer collaborated to create cutting-edge plastic dielectric films for electrical applications.

Key Electronic Film Providers

  • 3M
  • DuPont
  • Eastman Kodak Company
  • Gunze Ltd.
  • Nitto Denko Co.

Key Market Segmentation

By Film Type:

  • Conductive
  • Non-conductive

By Thickness:

  • Thick (More than 1 mm)
  • Thin (Up to 1 mm)

By Material:

  • Polymer
  • ITO on Glass
  • Metal Mesh
  • Others

By Application:

  • Electronic Display
  • PCB
  • Wire & Cable
  • Smart Buildings
  • Others

By Region:

  • North America
  • Europe
  • Asia Pacific
  • Middle East and Africa
  • Latin America

Frequently Asked Questions

What is the Electronic Film Market Valuation in 2024?

The electronic film market is expected to secure a valuation of US$ 10.8 billion in 2024.

How Big will the Electronic Film Market Be by 2034?

The electronic film market is estimated to reach US$ 21.6 billion by 2034.

What is the Growth Potential of the Electronic Film Market?

The demand for electronic films is anticipated to surge at a 7.2% CAGR through 2034.

What was the Historical Outlook of the Electronic Film Market?

From 2019 to 2023, the electronic film industry grew at an 8.6% HCAGR.

Which Product Type Category is Expected to Lead in the Electronic Film Market?

The conductive film segment is expected to grow at a CAGR of 7.1% from 2024 to 2034.

Which Thickness Category is Set to Dominate the Electronic Film Market?

The thick (more than 1 mm) segment is estimated to accelerate at a CAGR of 7.0% through 2034.

Table of Content

1. Executive Summary

    1.1. Global Market Outlook

    1.2. Demand-side Trends

    1.3. Supply-side Trends

    1.4. Technology Roadmap Analysis

    1.5. Analysis and Recommendations

2. Market Overview

    2.1. Market Coverage / Taxonomy

    2.2. Market Definition / Scope / Limitations

3. Market Background

    3.1. Market Dynamics

        3.1.1. Drivers

        3.1.2. Restraints

        3.1.3. Opportunity

        3.1.4. Trends

    3.2. Scenario Forecast

        3.2.1. Demand in Optimistic Scenario

        3.2.2. Demand in Likely Scenario

        3.2.3. Demand in Conservative Scenario

    3.3. Opportunity Map Analysis

    3.4. Product Life Cycle Analysis

    3.5. Supply Chain Analysis

        3.5.1. Supply Side Participants and their Roles

            3.5.1.1. Producers

            3.5.1.2. Mid-Level Participants (Traders/ Agents/ Brokers)

            3.5.1.3. Wholesalers and Distributors

        3.5.2. Value Added and Value Created at Node in the Supply Chain

        3.5.3. List of Raw Material Suppliers

        3.5.4. List of Existing and Potential Buyer’s

    3.6. Investment Feasibility Matrix

    3.7. Value Chain Analysis

        3.7.1. Profit Margin Analysis

        3.7.2. Wholesalers and Distributors

        3.7.3. Retailers

    3.8. PESTLE and Porter’s Analysis

    3.9. Regulatory Landscape

        3.9.1. By Key Regions

        3.9.2. By Key Countries

    3.10. Regional Parent Market Outlook

    3.11. Production and Consumption Statistics

    3.12. Import and Export Statistics

4. Global Market Analysis 2019 to 2023 and Forecast, 2024 to 2034

    4.1. Historical Market Size Value (US$ Million) & Volume (Square Meter) Analysis, 2019 to 2023

    4.2. Current and Future Market Size Value (US$ Million) & Volume (Square Meter) Projections, 2024 to 2034

        4.2.1. Y-o-Y Growth Trend Analysis

        4.2.2. Absolute $ Opportunity Analysis

5. Global Market Analysis 2019 to 2023 and Forecast 2024 to 2034, By Film Type

    5.1. Introduction / Key Findings

    5.2. Historical Market Size Value (US$ Million) & Volume (Square Meter) Analysis By Film Type, 2019 to 2023

    5.3. Current and Future Market Size Value (US$ Million) & Volume (Square Meter) Analysis and Forecast By Film Type, 2024 to 2034

        5.3.1. Conductive

        5.3.2. Non-conductive

    5.4. Y-o-Y Growth Trend Analysis By Film Type, 2019 to 2023

    5.5. Absolute $ Opportunity Analysis By Film Type, 2024 to 2034

6. Global Market Analysis 2019 to 2023 and Forecast 2024 to 2034, By Thickness

    6.1. Introduction / Key Findings

    6.2. Historical Market Size Value (US$ Million) & Volume (Square Meter) Analysis By Thickness, 2019 to 2023

    6.3. Current and Future Market Size Value (US$ Million) & Volume (Square Meter) Analysis and Forecast By Thickness, 2024 to 2034

        6.3.1. Thick (More than 1 mm)

        6.3.2. Thin (Up to 1 mm)

    6.4. Y-o-Y Growth Trend Analysis By Thickness, 2019 to 2023

    6.5. Absolute $ Opportunity Analysis By Thickness, 2024 to 2034

7. Global Market Analysis 2019 to 2023 and Forecast 2024 to 2034, By Material

    7.1. Introduction / Key Findings

    7.2. Historical Market Size Value (US$ Million) & Volume (Square Meter) Analysis By Material, 2019 to 2023

    7.3. Current and Future Market Size Value (US$ Million) & Volume (Square Meter) Analysis and Forecast By Material, 2024 to 2034

        7.3.1. Polymer

        7.3.2. ITO on Glass

        7.3.3. Metal Mesh

        7.3.4. Others

    7.4. Y-o-Y Growth Trend Analysis By Material, 2019 to 2023

    7.5. Absolute $ Opportunity Analysis By Material, 2024 to 2034

8. Global Market Analysis 2019 to 2023 and Forecast 2024 to 2034, By Application

    8.1. Introduction / Key Findings

    8.2. Historical Market Size Value (US$ Million) & Volume (Square Meter) Analysis By Application, 2019 to 2023

    8.3. Current and Future Market Size Value (US$ Million) & Volume (Square Meter) Analysis and Forecast By Application, 2024 to 2034

        8.3.1. Electronic Display

        8.3.2. PCB

        8.3.3. Wire & Cable

        8.3.4. Smart Buildings

        8.3.5. Others

    8.4. Y-o-Y Growth Trend Analysis By Application, 2019 to 2023

    8.5. Absolute $ Opportunity Analysis By Application, 2024 to 2034

9. Global Market Analysis 2019 to 2023 and Forecast 2024 to 2034, By Region

    9.1. Introduction

    9.2. Historical Market Size Value (US$ Million) & Volume (Square Meter) Analysis By Region, 2019 to 2023

    9.3. Current Market Size Value (US$ Million) & Volume (Square Meter) Analysis and Forecast By Region, 2024 to 2034

        9.3.1. North America

        9.3.2. Latin America

        9.3.3. Western Europe

        9.3.4. Eastern Europe

        9.3.5. South Asia and Pacific

        9.3.6. East Asia

        9.3.7. Middle East and Africa

    9.4. Market Attractiveness Analysis By Region

10. North America Market Analysis 2019 to 2023 and Forecast 2024 to 2034, By Country

    10.1. Historical Market Size Value (US$ Million) & Volume (Square Meter) Trend Analysis By Market Taxonomy, 2019 to 2023

    10.2. Market Size Value (US$ Million) & Volume (Square Meter) Forecast By Market Taxonomy, 2024 to 2034

        10.2.1. By Country

            10.2.1.1. USA

            10.2.1.2. Canada

        10.2.2. By Film Type

        10.2.3. By Thickness

        10.2.4. By Material

        10.2.5. By Application

    10.3. Market Attractiveness Analysis

        10.3.1. By Country

        10.3.2. By Film Type

        10.3.3. By Thickness

        10.3.4. By Material

        10.3.5. By Application

    10.4. Key Takeaways

11. Latin America Market Analysis 2019 to 2023 and Forecast 2024 to 2034, By Country

    11.1. Historical Market Size Value (US$ Million) & Volume (Square Meter) Trend Analysis By Market Taxonomy, 2019 to 2023

    11.2. Market Size Value (US$ Million) & Volume (Square Meter) Forecast By Market Taxonomy, 2024 to 2034

        11.2.1. By Country

            11.2.1.1. Brazil

            11.2.1.2. Mexico

            11.2.1.3. Rest of Latin America

        11.2.2. By Film Type

        11.2.3. By Thickness

        11.2.4. By Material

        11.2.5. By Application

    11.3. Market Attractiveness Analysis

        11.3.1. By Country

        11.3.2. By Film Type

        11.3.3. By Thickness

        11.3.4. By Material

        11.3.5. By Application

    11.4. Key Takeaways

12. Western Europe Market Analysis 2019 to 2023 and Forecast 2024 to 2034, By Country

    12.1. Historical Market Size Value (US$ Million) & Volume (Square Meter) Trend Analysis By Market Taxonomy, 2019 to 2023

    12.2. Market Size Value (US$ Million) & Volume (Square Meter) Forecast By Market Taxonomy, 2024 to 2034

        12.2.1. By Country

            12.2.1.1. Germany

            12.2.1.2. UK

            12.2.1.3. France

            12.2.1.4. Spain

            12.2.1.5. Italy

            12.2.1.6. Rest of Western Europe

        12.2.2. By Film Type

        12.2.3. By Thickness

        12.2.4. By Material

        12.2.5. By Application

    12.3. Market Attractiveness Analysis

        12.3.1. By Country

        12.3.2. By Film Type

        12.3.3. By Thickness

        12.3.4. By Material

        12.3.5. By Application

    12.4. Key Takeaways

13. Eastern Europe Market Analysis 2019 to 2023 and Forecast 2024 to 2034, By Country

    13.1. Historical Market Size Value (US$ Million) & Volume (Square Meter) Trend Analysis By Market Taxonomy, 2019 to 2023

    13.2. Market Size Value (US$ Million) & Volume (Square Meter) Forecast By Market Taxonomy, 2024 to 2034

        13.2.1. By Country

            13.2.1.1. Poland

            13.2.1.2. Russia

            13.2.1.3. Czech Republic

            13.2.1.4. Romania

            13.2.1.5. Rest of Eastern Europe

        13.2.2. By Film Type

        13.2.3. By Thickness

        13.2.4. By Material

        13.2.5. By Application

    13.3. Market Attractiveness Analysis

        13.3.1. By Country

        13.3.2. By Film Type

        13.3.3. By Thickness

        13.3.4. By Material

        13.3.5. By Application

    13.4. Key Takeaways

14. South Asia and Pacific Market Analysis 2019 to 2023 and Forecast 2024 to 2034, By Country

    14.1. Historical Market Size Value (US$ Million) & Volume (Square Meter) Trend Analysis By Market Taxonomy, 2019 to 2023

    14.2. Market Size Value (US$ Million) & Volume (Square Meter) Forecast By Market Taxonomy, 2024 to 2034

        14.2.1. By Country

            14.2.1.1. India

            14.2.1.2. Bangladesh

            14.2.1.3. Australia

            14.2.1.4. New Zealand

            14.2.1.5. Rest of South Asia and Pacific

        14.2.2. By Film Type

        14.2.3. By Thickness

        14.2.4. By Material

        14.2.5. By Application

    14.3. Market Attractiveness Analysis

        14.3.1. By Country

        14.3.2. By Film Type

        14.3.3. By Thickness

        14.3.4. By Material

        14.3.5. By Application

    14.4. Key Takeaways

15. East Asia Market Analysis 2019 to 2023 and Forecast 2024 to 2034, By Country

    15.1. Historical Market Size Value (US$ Million) & Volume (Square Meter) Trend Analysis By Market Taxonomy, 2019 to 2023

    15.2. Market Size Value (US$ Million) & Volume (Square Meter) Forecast By Market Taxonomy, 2024 to 2034

        15.2.1. By Country

            15.2.1.1. China

            15.2.1.2. Japan

            15.2.1.3. South Korea

        15.2.2. By Film Type

        15.2.3. By Thickness

        15.2.4. By Material

        15.2.5. By Application

    15.3. Market Attractiveness Analysis

        15.3.1. By Country

        15.3.2. By Film Type

        15.3.3. By Thickness

        15.3.4. By Material

        15.3.5. By Application

    15.4. Key Takeaways

16. Middle East and Africa Market Analysis 2019 to 2023 and Forecast 2024 to 2034, By Country

    16.1. Historical Market Size Value (US$ Million) & Volume (Square Meter) Trend Analysis By Market Taxonomy, 2019 to 2023

    16.2. Market Size Value (US$ Million) & Volume (Square Meter) Forecast By Market Taxonomy, 2024 to 2034

        16.2.1. By Country

            16.2.1.1. GCC Countries

            16.2.1.2. South Africa

            16.2.1.3. Israel

            16.2.1.4. Rest of MEA

        16.2.2. By Film Type

        16.2.3. By Thickness

        16.2.4. By Material

        16.2.5. By Application

    16.3. Market Attractiveness Analysis

        16.3.1. By Country

        16.3.2. By Film Type

        16.3.3. By Thickness

        16.3.4. By Material

        16.3.5. By Application

    16.4. Key Takeaways

17. Key Countries Market Analysis

    17.1. USA

        17.1.1. Pricing Analysis

        17.1.2. Market Share Analysis, 2023

            17.1.2.1. By Film Type

            17.1.2.2. By Thickness

            17.1.2.3. By Material

            17.1.2.4. By Application

    17.2. Canada

        17.2.1. Pricing Analysis

        17.2.2. Market Share Analysis, 2023

            17.2.2.1. By Film Type

            17.2.2.2. By Thickness

            17.2.2.3. By Material

            17.2.2.4. By Application

    17.3. Brazil

        17.3.1. Pricing Analysis

        17.3.2. Market Share Analysis, 2023

            17.3.2.1. By Film Type

            17.3.2.2. By Thickness

            17.3.2.3. By Material

            17.3.2.4. By Application

    17.4. Mexico

        17.4.1. Pricing Analysis

        17.4.2. Market Share Analysis, 2023

            17.4.2.1. By Film Type

            17.4.2.2. By Thickness

            17.4.2.3. By Material

            17.4.2.4. By Application

    17.5. Germany

        17.5.1. Pricing Analysis

        17.5.2. Market Share Analysis, 2023

            17.5.2.1. By Film Type

            17.5.2.2. By Thickness

            17.5.2.3. By Material

            17.5.2.4. By Application

    17.6. UK

        17.6.1. Pricing Analysis

        17.6.2. Market Share Analysis, 2023

            17.6.2.1. By Film Type

            17.6.2.2. By Thickness

            17.6.2.3. By Material

            17.6.2.4. By Application

    17.7. France

        17.7.1. Pricing Analysis

        17.7.2. Market Share Analysis, 2023

            17.7.2.1. By Film Type

            17.7.2.2. By Thickness

            17.7.2.3. By Material

            17.7.2.4. By Application

    17.8. Spain

        17.8.1. Pricing Analysis

        17.8.2. Market Share Analysis, 2023

            17.8.2.1. By Film Type

            17.8.2.2. By Thickness

            17.8.2.3. By Material

            17.8.2.4. By Application

    17.9. Italy

        17.9.1. Pricing Analysis

        17.9.2. Market Share Analysis, 2023

            17.9.2.1. By Film Type

            17.9.2.2. By Thickness

            17.9.2.3. By Material

            17.9.2.4. By Application

    17.10. Poland

        17.10.1. Pricing Analysis

        17.10.2. Market Share Analysis, 2023

            17.10.2.1. By Film Type

            17.10.2.2. By Thickness

            17.10.2.3. By Material

            17.10.2.4. By Application

    17.11. Russia

        17.11.1. Pricing Analysis

        17.11.2. Market Share Analysis, 2023

            17.11.2.1. By Film Type

            17.11.2.2. By Thickness

            17.11.2.3. By Material

            17.11.2.4. By Application

    17.12. Czech Republic

        17.12.1. Pricing Analysis

        17.12.2. Market Share Analysis, 2023

            17.12.2.1. By Film Type

            17.12.2.2. By Thickness

            17.12.2.3. By Material

            17.12.2.4. By Application

    17.13. Romania

        17.13.1. Pricing Analysis

        17.13.2. Market Share Analysis, 2023

            17.13.2.1. By Film Type

            17.13.2.2. By Thickness

            17.13.2.3. By Material

            17.13.2.4. By Application

    17.14. India

        17.14.1. Pricing Analysis

        17.14.2. Market Share Analysis, 2023

            17.14.2.1. By Film Type

            17.14.2.2. By Thickness

            17.14.2.3. By Material

            17.14.2.4. By Application

    17.15. Bangladesh

        17.15.1. Pricing Analysis

        17.15.2. Market Share Analysis, 2023

            17.15.2.1. By Film Type

            17.15.2.2. By Thickness

            17.15.2.3. By Material

            17.15.2.4. By Application

    17.16. Australia

        17.16.1. Pricing Analysis

        17.16.2. Market Share Analysis, 2023

            17.16.2.1. By Film Type

            17.16.2.2. By Thickness

            17.16.2.3. By Material

            17.16.2.4. By Application

    17.17. New Zealand

        17.17.1. Pricing Analysis

        17.17.2. Market Share Analysis, 2023

            17.17.2.1. By Film Type

            17.17.2.2. By Thickness

            17.17.2.3. By Material

            17.17.2.4. By Application

    17.18. China

        17.18.1. Pricing Analysis

        17.18.2. Market Share Analysis, 2023

            17.18.2.1. By Film Type

            17.18.2.2. By Thickness

            17.18.2.3. By Material

            17.18.2.4. By Application

    17.19. Japan

        17.19.1. Pricing Analysis

        17.19.2. Market Share Analysis, 2023

            17.19.2.1. By Film Type

            17.19.2.2. By Thickness

            17.19.2.3. By Material

            17.19.2.4. By Application

    17.20. South Korea

        17.20.1. Pricing Analysis

        17.20.2. Market Share Analysis, 2023

            17.20.2.1. By Film Type

            17.20.2.2. By Thickness

            17.20.2.3. By Material

            17.20.2.4. By Application

    17.21. GCC Countries

        17.21.1. Pricing Analysis

        17.21.2. Market Share Analysis, 2023

            17.21.2.1. By Film Type

            17.21.2.2. By Thickness

            17.21.2.3. By Material

            17.21.2.4. By Application

    17.22. South Africa

        17.22.1. Pricing Analysis

        17.22.2. Market Share Analysis, 2023

            17.22.2.1. By Film Type

            17.22.2.2. By Thickness

            17.22.2.3. By Material

            17.22.2.4. By Application

    17.23. Israel

        17.23.1. Pricing Analysis

        17.23.2. Market Share Analysis, 2023

            17.23.2.1. By Film Type

            17.23.2.2. By Thickness

            17.23.2.3. By Material

            17.23.2.4. By Application

18. Market Structure Analysis

    18.1. Competition Dashboard

    18.2. Competition Benchmarking

    18.3. Market Share Analysis of Top Players

        18.3.1. By Regional

        18.3.2. By Film Type

        18.3.3. By Thickness

        18.3.4. By Material

        18.3.5. By Application

19. Competition Analysis

    19.1. Competition Deep Dive

        19.1.1. 3M

            19.1.1.1. Overview

            19.1.1.2. Product Portfolio

            19.1.1.3. Profitability by Market Segments

            19.1.1.4. Sales Footprint

            19.1.1.5. Strategy Overview

                19.1.1.5.1. Marketing Strategy

                19.1.1.5.2. Product Strategy

                19.1.1.5.3. Channel Strategy

        19.1.2. DuPont

            19.1.2.1. Overview

            19.1.2.2. Product Portfolio

            19.1.2.3. Profitability by Market Segments

            19.1.2.4. Sales Footprint

            19.1.2.5. Strategy Overview

                19.1.2.5.1. Marketing Strategy

                19.1.2.5.2. Product Strategy

                19.1.2.5.3. Channel Strategy

        19.1.3. Eastman Kodak Company

            19.1.3.1. Overview

            19.1.3.2. Product Portfolio

            19.1.3.3. Profitability by Market Segments

            19.1.3.4. Sales Footprint

            19.1.3.5. Strategy Overview

                19.1.3.5.1. Marketing Strategy

                19.1.3.5.2. Product Strategy

                19.1.3.5.3. Channel Strategy

        19.1.4. Gunze Ltd.

            19.1.4.1. Overview

            19.1.4.2. Product Portfolio

            19.1.4.3. Profitability by Market Segments

            19.1.4.4. Sales Footprint

            19.1.4.5. Strategy Overview

                19.1.4.5.1. Marketing Strategy

                19.1.4.5.2. Product Strategy

                19.1.4.5.3. Channel Strategy

        19.1.5. Nitto Denko Co.

            19.1.5.1. Overview

            19.1.5.2. Product Portfolio

            19.1.5.3. Profitability by Market Segments

            19.1.5.4. Sales Footprint

            19.1.5.5. Strategy Overview

                19.1.5.5.1. Marketing Strategy

                19.1.5.5.2. Product Strategy

                19.1.5.5.3. Channel Strategy

        19.1.6. Panasonic Co.

            19.1.6.1. Overview

            19.1.6.2. Product Portfolio

            19.1.6.3. Profitability by Market Segments

            19.1.6.4. Sales Footprint

            19.1.6.5. Strategy Overview

                19.1.6.5.1. Marketing Strategy

                19.1.6.5.2. Product Strategy

                19.1.6.5.3. Channel Strategy

        19.1.7. Saint-Gobain S.A.

            19.1.7.1. Overview

            19.1.7.2. Product Portfolio

            19.1.7.3. Profitability by Market Segments

            19.1.7.4. Sales Footprint

            19.1.7.5. Strategy Overview

                19.1.7.5.1. Marketing Strategy

                19.1.7.5.2. Product Strategy

                19.1.7.5.3. Channel Strategy

        19.1.8. TDK Co.

            19.1.8.1. Overview

            19.1.8.2. Product Portfolio

            19.1.8.3. Profitability by Market Segments

            19.1.8.4. Sales Footprint

            19.1.8.5. Strategy Overview

                19.1.8.5.1. Marketing Strategy

                19.1.8.5.2. Product Strategy

                19.1.8.5.3. Channel Strategy

        19.1.9. Teijin Ltd.

            19.1.9.1. Overview

            19.1.9.2. Product Portfolio

            19.1.9.3. Profitability by Market Segments

            19.1.9.4. Sales Footprint

            19.1.9.5. Strategy Overview

                19.1.9.5.1. Marketing Strategy

                19.1.9.5.2. Product Strategy

                19.1.9.5.3. Channel Strategy

        19.1.10. TOYOBO Co. Ltd.

            19.1.10.1. Overview

            19.1.10.2. Product Portfolio

            19.1.10.3. Profitability by Market Segments

            19.1.10.4. Sales Footprint

            19.1.10.5. Strategy Overview

                19.1.10.5.1. Marketing Strategy

                19.1.10.5.2. Product Strategy

                19.1.10.5.3. Channel Strategy

20. Assumptions & Acronyms Used

21. Research Methodology

List of Tables

Table 1: Global Market Value (US$ Million) Forecast by Region, 2019 to 2034

Table 2: Global Market Volume (Square Meter) Forecast by Region, 2019 to 2034

Table 3: Global Market Value (US$ Million) Forecast by Film Type, 2019 to 2034

Table 4: Global Market Volume (Square Meter) Forecast by Film Type, 2019 to 2034

Table 5: Global Market Value (US$ Million) Forecast by Thickness, 2019 to 2034

Table 6: Global Market Volume (Square Meter) Forecast by Thickness, 2019 to 2034

Table 7: Global Market Value (US$ Million) Forecast by Material, 2019 to 2034

Table 8: Global Market Volume (Square Meter) Forecast by Material, 2019 to 2034

Table 9: Global Market Value (US$ Million) Forecast by Application, 2019 to 2034

Table 10: Global Market Volume (Square Meter) Forecast by Application, 2019 to 2034

Table 11: North America Market Value (US$ Million) Forecast by Country, 2019 to 2034

Table 12: North America Market Volume (Square Meter) Forecast by Country, 2019 to 2034

Table 13: North America Market Value (US$ Million) Forecast by Film Type, 2019 to 2034

Table 14: North America Market Volume (Square Meter) Forecast by Film Type, 2019 to 2034

Table 15: North America Market Value (US$ Million) Forecast by Thickness, 2019 to 2034

Table 16: North America Market Volume (Square Meter) Forecast by Thickness, 2019 to 2034

Table 17: North America Market Value (US$ Million) Forecast by Material, 2019 to 2034

Table 18: North America Market Volume (Square Meter) Forecast by Material, 2019 to 2034

Table 19: North America Market Value (US$ Million) Forecast by Application, 2019 to 2034

Table 20: North America Market Volume (Square Meter) Forecast by Application, 2019 to 2034

Table 21: Latin America Market Value (US$ Million) Forecast by Country, 2019 to 2034

Table 22: Latin America Market Volume (Square Meter) Forecast by Country, 2019 to 2034

Table 23: Latin America Market Value (US$ Million) Forecast by Film Type, 2019 to 2034

Table 24: Latin America Market Volume (Square Meter) Forecast by Film Type, 2019 to 2034

Table 25: Latin America Market Value (US$ Million) Forecast by Thickness, 2019 to 2034

Table 26: Latin America Market Volume (Square Meter) Forecast by Thickness, 2019 to 2034

Table 27: Latin America Market Value (US$ Million) Forecast by Material, 2019 to 2034

Table 28: Latin America Market Volume (Square Meter) Forecast by Material, 2019 to 2034

Table 29: Latin America Market Value (US$ Million) Forecast by Application, 2019 to 2034

Table 30: Latin America Market Volume (Square Meter) Forecast by Application, 2019 to 2034

Table 31: Western Europe Market Value (US$ Million) Forecast by Country, 2019 to 2034

Table 32: Western Europe Market Volume (Square Meter) Forecast by Country, 2019 to 2034

Table 33: Western Europe Market Value (US$ Million) Forecast by Film Type, 2019 to 2034

Table 34: Western Europe Market Volume (Square Meter) Forecast by Film Type, 2019 to 2034

Table 35: Western Europe Market Value (US$ Million) Forecast by Thickness, 2019 to 2034

Table 36: Western Europe Market Volume (Square Meter) Forecast by Thickness, 2019 to 2034

Table 37: Western Europe Market Value (US$ Million) Forecast by Material, 2019 to 2034

Table 38: Western Europe Market Volume (Square Meter) Forecast by Material, 2019 to 2034

Table 39: Western Europe Market Value (US$ Million) Forecast by Application, 2019 to 2034

Table 40: Western Europe Market Volume (Square Meter) Forecast by Application, 2019 to 2034

Table 41: Eastern Europe Market Value (US$ Million) Forecast by Country, 2019 to 2034

Table 42: Eastern Europe Market Volume (Square Meter) Forecast by Country, 2019 to 2034

Table 43: Eastern Europe Market Value (US$ Million) Forecast by Film Type, 2019 to 2034

Table 44: Eastern Europe Market Volume (Square Meter) Forecast by Film Type, 2019 to 2034

Table 45: Eastern Europe Market Value (US$ Million) Forecast by Thickness, 2019 to 2034

Table 46: Eastern Europe Market Volume (Square Meter) Forecast by Thickness, 2019 to 2034

Table 47: Eastern Europe Market Value (US$ Million) Forecast by Material, 2019 to 2034

Table 48: Eastern Europe Market Volume (Square Meter) Forecast by Material, 2019 to 2034

Table 49: Eastern Europe Market Value (US$ Million) Forecast by Application, 2019 to 2034

Table 50: Eastern Europe Market Volume (Square Meter) Forecast by Application, 2019 to 2034

Table 51: South Asia and Pacific Market Value (US$ Million) Forecast by Country, 2019 to 2034

Table 52: South Asia and Pacific Market Volume (Square Meter) Forecast by Country, 2019 to 2034

Table 53: South Asia and Pacific Market Value (US$ Million) Forecast by Film Type, 2019 to 2034

Table 54: South Asia and Pacific Market Volume (Square Meter) Forecast by Film Type, 2019 to 2034

Table 55: South Asia and Pacific Market Value (US$ Million) Forecast by Thickness, 2019 to 2034

Table 56: South Asia and Pacific Market Volume (Square Meter) Forecast by Thickness, 2019 to 2034

Table 57: South Asia and Pacific Market Value (US$ Million) Forecast by Material, 2019 to 2034

Table 58: South Asia and Pacific Market Volume (Square Meter) Forecast by Material, 2019 to 2034

Table 59: South Asia and Pacific Market Value (US$ Million) Forecast by Application, 2019 to 2034

Table 60: South Asia and Pacific Market Volume (Square Meter) Forecast by Application, 2019 to 2034

Table 61: East Asia Market Value (US$ Million) Forecast by Country, 2019 to 2034

Table 62: East Asia Market Volume (Square Meter) Forecast by Country, 2019 to 2034

Table 63: East Asia Market Value (US$ Million) Forecast by Film Type, 2019 to 2034

Table 64: East Asia Market Volume (Square Meter) Forecast by Film Type, 2019 to 2034

Table 65: East Asia Market Value (US$ Million) Forecast by Thickness, 2019 to 2034

Table 66: East Asia Market Volume (Square Meter) Forecast by Thickness, 2019 to 2034

Table 67: East Asia Market Value (US$ Million) Forecast by Material, 2019 to 2034

Table 68: East Asia Market Volume (Square Meter) Forecast by Material, 2019 to 2034

Table 69: East Asia Market Value (US$ Million) Forecast by Application, 2019 to 2034

Table 70: East Asia Market Volume (Square Meter) Forecast by Application, 2019 to 2034

Table 71: Middle East and Africa Market Value (US$ Million) Forecast by Country, 2019 to 2034

Table 72: Middle East and Africa Market Volume (Square Meter) Forecast by Country, 2019 to 2034

Table 73: Middle East and Africa Market Value (US$ Million) Forecast by Film Type, 2019 to 2034

Table 74: Middle East and Africa Market Volume (Square Meter) Forecast by Film Type, 2019 to 2034

Table 75: Middle East and Africa Market Value (US$ Million) Forecast by Thickness, 2019 to 2034

Table 76: Middle East and Africa Market Volume (Square Meter) Forecast by Thickness, 2019 to 2034

Table 77: Middle East and Africa Market Value (US$ Million) Forecast by Material, 2019 to 2034

Table 78: Middle East and Africa Market Volume (Square Meter) Forecast by Material, 2019 to 2034

Table 79: Middle East and Africa Market Value (US$ Million) Forecast by Application, 2019 to 2034

Table 80: Middle East and Africa Market Volume (Square Meter) Forecast by Application, 2019 to 2034

List of Charts

Figure 1: Global Market Value (US$ Million) by Film Type, 2024 to 2034

Figure 2: Global Market Value (US$ Million) by Thickness, 2024 to 2034

Figure 3: Global Market Value (US$ Million) by Material, 2024 to 2034

Figure 4: Global Market Value (US$ Million) by Application, 2024 to 2034

Figure 5: Global Market Value (US$ Million) by Region, 2024 to 2034

Figure 6: Global Market Value (US$ Million) Analysis by Region, 2019 to 2034

Figure 7: Global Market Volume (Square Meter) Analysis by Region, 2019 to 2034

Figure 8: Global Market Value Share (%) and BPS Analysis by Region, 2024 to 2034

Figure 9: Global Market Y-o-Y Growth (%) Projections by Region, 2024 to 2034

Figure 10: Global Market Value (US$ Million) Analysis by Film Type, 2019 to 2034

Figure 11: Global Market Volume (Square Meter) Analysis by Film Type, 2019 to 2034

Figure 12: Global Market Value Share (%) and BPS Analysis by Film Type, 2024 to 2034

Figure 13: Global Market Y-o-Y Growth (%) Projections by Film Type, 2024 to 2034

Figure 14: Global Market Value (US$ Million) Analysis by Thickness, 2019 to 2034

Figure 15: Global Market Volume (Square Meter) Analysis by Thickness, 2019 to 2034

Figure 16: Global Market Value Share (%) and BPS Analysis by Thickness, 2024 to 2034

Figure 17: Global Market Y-o-Y Growth (%) Projections by Thickness, 2024 to 2034

Figure 18: Global Market Value (US$ Million) Analysis by Material, 2019 to 2034

Figure 19: Global Market Volume (Square Meter) Analysis by Material, 2019 to 2034

Figure 20: Global Market Value Share (%) and BPS Analysis by Material, 2024 to 2034

Figure 21: Global Market Y-o-Y Growth (%) Projections by Material, 2024 to 2034

Figure 22: Global Market Value (US$ Million) Analysis by Application, 2019 to 2034

Figure 23: Global Market Volume (Square Meter) Analysis by Application, 2019 to 2034

Figure 24: Global Market Value Share (%) and BPS Analysis by Application, 2024 to 2034

Figure 25: Global Market Y-o-Y Growth (%) Projections by Application, 2024 to 2034

Figure 26: Global Market Attractiveness by Film Type, 2024 to 2034

Figure 27: Global Market Attractiveness by Thickness, 2024 to 2034

Figure 28: Global Market Attractiveness by Material, 2024 to 2034

Figure 29: Global Market Attractiveness by Application, 2024 to 2034

Figure 30: Global Market Attractiveness by Region, 2024 to 2034

Figure 31: North America Market Value (US$ Million) by Film Type, 2024 to 2034

Figure 32: North America Market Value (US$ Million) by Thickness, 2024 to 2034

Figure 33: North America Market Value (US$ Million) by Material, 2024 to 2034

Figure 34: North America Market Value (US$ Million) by Application, 2024 to 2034

Figure 35: North America Market Value (US$ Million) by Country, 2024 to 2034

Figure 36: North America Market Value (US$ Million) Analysis by Country, 2019 to 2034

Figure 37: North America Market Volume (Square Meter) Analysis by Country, 2019 to 2034

Figure 38: North America Market Value Share (%) and BPS Analysis by Country, 2024 to 2034

Figure 39: North America Market Y-o-Y Growth (%) Projections by Country, 2024 to 2034

Figure 40: North America Market Value (US$ Million) Analysis by Film Type, 2019 to 2034

Figure 41: North America Market Volume (Square Meter) Analysis by Film Type, 2019 to 2034

Figure 42: North America Market Value Share (%) and BPS Analysis by Film Type, 2024 to 2034

Figure 43: North America Market Y-o-Y Growth (%) Projections by Film Type, 2024 to 2034

Figure 44: North America Market Value (US$ Million) Analysis by Thickness, 2019 to 2034

Figure 45: North America Market Volume (Square Meter) Analysis by Thickness, 2019 to 2034

Figure 46: North America Market Value Share (%) and BPS Analysis by Thickness, 2024 to 2034

Figure 47: North America Market Y-o-Y Growth (%) Projections by Thickness, 2024 to 2034

Figure 48: North America Market Value (US$ Million) Analysis by Material, 2019 to 2034

Figure 49: North America Market Volume (Square Meter) Analysis by Material, 2019 to 2034

Figure 50: North America Market Value Share (%) and BPS Analysis by Material, 2024 to 2034

Figure 51: North America Market Y-o-Y Growth (%) Projections by Material, 2024 to 2034

Figure 52: North America Market Value (US$ Million) Analysis by Application, 2019 to 2034

Figure 53: North America Market Volume (Square Meter) Analysis by Application, 2019 to 2034

Figure 54: North America Market Value Share (%) and BPS Analysis by Application, 2024 to 2034

Figure 55: North America Market Y-o-Y Growth (%) Projections by Application, 2024 to 2034

Figure 56: North America Market Attractiveness by Film Type, 2024 to 2034

Figure 57: North America Market Attractiveness by Thickness, 2024 to 2034

Figure 58: North America Market Attractiveness by Material, 2024 to 2034

Figure 59: North America Market Attractiveness by Application, 2024 to 2034

Figure 60: North America Market Attractiveness by Country, 2024 to 2034

Figure 61: Latin America Market Value (US$ Million) by Film Type, 2024 to 2034

Figure 62: Latin America Market Value (US$ Million) by Thickness, 2024 to 2034

Figure 63: Latin America Market Value (US$ Million) by Material, 2024 to 2034

Figure 64: Latin America Market Value (US$ Million) by Application, 2024 to 2034

Figure 65: Latin America Market Value (US$ Million) by Country, 2024 to 2034

Figure 66: Latin America Market Value (US$ Million) Analysis by Country, 2019 to 2034

Figure 67: Latin America Market Volume (Square Meter) Analysis by Country, 2019 to 2034

Figure 68: Latin America Market Value Share (%) and BPS Analysis by Country, 2024 to 2034

Figure 69: Latin America Market Y-o-Y Growth (%) Projections by Country, 2024 to 2034

Figure 70: Latin America Market Value (US$ Million) Analysis by Film Type, 2019 to 2034

Figure 71: Latin America Market Volume (Square Meter) Analysis by Film Type, 2019 to 2034

Figure 72: Latin America Market Value Share (%) and BPS Analysis by Film Type, 2024 to 2034

Figure 73: Latin America Market Y-o-Y Growth (%) Projections by Film Type, 2024 to 2034

Figure 74: Latin America Market Value (US$ Million) Analysis by Thickness, 2019 to 2034

Figure 75: Latin America Market Volume (Square Meter) Analysis by Thickness, 2019 to 2034

Figure 76: Latin America Market Value Share (%) and BPS Analysis by Thickness, 2024 to 2034

Figure 77: Latin America Market Y-o-Y Growth (%) Projections by Thickness, 2024 to 2034

Figure 78: Latin America Market Value (US$ Million) Analysis by Material, 2019 to 2034

Figure 79: Latin America Market Volume (Square Meter) Analysis by Material, 2019 to 2034

Figure 80: Latin America Market Value Share (%) and BPS Analysis by Material, 2024 to 2034

Figure 81: Latin America Market Y-o-Y Growth (%) Projections by Material, 2024 to 2034

Figure 82: Latin America Market Value (US$ Million) Analysis by Application, 2019 to 2034

Figure 83: Latin America Market Volume (Square Meter) Analysis by Application, 2019 to 2034

Figure 84: Latin America Market Value Share (%) and BPS Analysis by Application, 2024 to 2034

Figure 85: Latin America Market Y-o-Y Growth (%) Projections by Application, 2024 to 2034

Figure 86: Latin America Market Attractiveness by Film Type, 2024 to 2034

Figure 87: Latin America Market Attractiveness by Thickness, 2024 to 2034

Figure 88: Latin America Market Attractiveness by Material, 2024 to 2034

Figure 89: Latin America Market Attractiveness by Application, 2024 to 2034

Figure 90: Latin America Market Attractiveness by Country, 2024 to 2034

Figure 91: Western Europe Market Value (US$ Million) by Film Type, 2024 to 2034

Figure 92: Western Europe Market Value (US$ Million) by Thickness, 2024 to 2034

Figure 93: Western Europe Market Value (US$ Million) by Material, 2024 to 2034

Figure 94: Western Europe Market Value (US$ Million) by Application, 2024 to 2034

Figure 95: Western Europe Market Value (US$ Million) by Country, 2024 to 2034

Figure 96: Western Europe Market Value (US$ Million) Analysis by Country, 2019 to 2034

Figure 97: Western Europe Market Volume (Square Meter) Analysis by Country, 2019 to 2034

Figure 98: Western Europe Market Value Share (%) and BPS Analysis by Country, 2024 to 2034

Figure 99: Western Europe Market Y-o-Y Growth (%) Projections by Country, 2024 to 2034

Figure 100: Western Europe Market Value (US$ Million) Analysis by Film Type, 2019 to 2034

Figure 101: Western Europe Market Volume (Square Meter) Analysis by Film Type, 2019 to 2034

Figure 102: Western Europe Market Value Share (%) and BPS Analysis by Film Type, 2024 to 2034

Figure 103: Western Europe Market Y-o-Y Growth (%) Projections by Film Type, 2024 to 2034

Figure 104: Western Europe Market Value (US$ Million) Analysis by Thickness, 2019 to 2034

Figure 105: Western Europe Market Volume (Square Meter) Analysis by Thickness, 2019 to 2034

Figure 106: Western Europe Market Value Share (%) and BPS Analysis by Thickness, 2024 to 2034

Figure 107: Western Europe Market Y-o-Y Growth (%) Projections by Thickness, 2024 to 2034

Figure 108: Western Europe Market Value (US$ Million) Analysis by Material, 2019 to 2034

Figure 109: Western Europe Market Volume (Square Meter) Analysis by Material, 2019 to 2034

Figure 110: Western Europe Market Value Share (%) and BPS Analysis by Material, 2024 to 2034

Figure 111: Western Europe Market Y-o-Y Growth (%) Projections by Material, 2024 to 2034

Figure 112: Western Europe Market Value (US$ Million) Analysis by Application, 2019 to 2034

Figure 113: Western Europe Market Volume (Square Meter) Analysis by Application, 2019 to 2034

Figure 114: Western Europe Market Value Share (%) and BPS Analysis by Application, 2024 to 2034

Figure 115: Western Europe Market Y-o-Y Growth (%) Projections by Application, 2024 to 2034

Figure 116: Western Europe Market Attractiveness by Film Type, 2024 to 2034

Figure 117: Western Europe Market Attractiveness by Thickness, 2024 to 2034

Figure 118: Western Europe Market Attractiveness by Material, 2024 to 2034

Figure 119: Western Europe Market Attractiveness by Application, 2024 to 2034

Figure 120: Western Europe Market Attractiveness by Country, 2024 to 2034

Figure 121: Eastern Europe Market Value (US$ Million) by Film Type, 2024 to 2034

Figure 122: Eastern Europe Market Value (US$ Million) by Thickness, 2024 to 2034

Figure 123: Eastern Europe Market Value (US$ Million) by Material, 2024 to 2034

Figure 124: Eastern Europe Market Value (US$ Million) by Application, 2024 to 2034

Figure 125: Eastern Europe Market Value (US$ Million) by Country, 2024 to 2034

Figure 126: Eastern Europe Market Value (US$ Million) Analysis by Country, 2019 to 2034

Figure 127: Eastern Europe Market Volume (Square Meter) Analysis by Country, 2019 to 2034

Figure 128: Eastern Europe Market Value Share (%) and BPS Analysis by Country, 2024 to 2034

Figure 129: Eastern Europe Market Y-o-Y Growth (%) Projections by Country, 2024 to 2034

Figure 130: Eastern Europe Market Value (US$ Million) Analysis by Film Type, 2019 to 2034

Figure 131: Eastern Europe Market Volume (Square Meter) Analysis by Film Type, 2019 to 2034

Figure 132: Eastern Europe Market Value Share (%) and BPS Analysis by Film Type, 2024 to 2034

Figure 133: Eastern Europe Market Y-o-Y Growth (%) Projections by Film Type, 2024 to 2034

Figure 134: Eastern Europe Market Value (US$ Million) Analysis by Thickness, 2019 to 2034

Figure 135: Eastern Europe Market Volume (Square Meter) Analysis by Thickness, 2019 to 2034

Figure 136: Eastern Europe Market Value Share (%) and BPS Analysis by Thickness, 2024 to 2034

Figure 137: Eastern Europe Market Y-o-Y Growth (%) Projections by Thickness, 2024 to 2034

Figure 138: Eastern Europe Market Value (US$ Million) Analysis by Material, 2019 to 2034

Figure 139: Eastern Europe Market Volume (Square Meter) Analysis by Material, 2019 to 2034

Figure 140: Eastern Europe Market Value Share (%) and BPS Analysis by Material, 2024 to 2034

Figure 141: Eastern Europe Market Y-o-Y Growth (%) Projections by Material, 2024 to 2034

Figure 142: Eastern Europe Market Value (US$ Million) Analysis by Application, 2019 to 2034

Figure 143: Eastern Europe Market Volume (Square Meter) Analysis by Application, 2019 to 2034

Figure 144: Eastern Europe Market Value Share (%) and BPS Analysis by Application, 2024 to 2034

Figure 145: Eastern Europe Market Y-o-Y Growth (%) Projections by Application, 2024 to 2034

Figure 146: Eastern Europe Market Attractiveness by Film Type, 2024 to 2034

Figure 147: Eastern Europe Market Attractiveness by Thickness, 2024 to 2034

Figure 148: Eastern Europe Market Attractiveness by Material, 2024 to 2034

Figure 149: Eastern Europe Market Attractiveness by Application, 2024 to 2034

Figure 150: Eastern Europe Market Attractiveness by Country, 2024 to 2034

Figure 151: South Asia and Pacific Market Value (US$ Million) by Film Type, 2024 to 2034

Figure 152: South Asia and Pacific Market Value (US$ Million) by Thickness, 2024 to 2034

Figure 153: South Asia and Pacific Market Value (US$ Million) by Material, 2024 to 2034

Figure 154: South Asia and Pacific Market Value (US$ Million) by Application, 2024 to 2034

Figure 155: South Asia and Pacific Market Value (US$ Million) by Country, 2024 to 2034

Figure 156: South Asia and Pacific Market Value (US$ Million) Analysis by Country, 2019 to 2034

Figure 157: South Asia and Pacific Market Volume (Square Meter) Analysis by Country, 2019 to 2034

Figure 158: South Asia and Pacific Market Value Share (%) and BPS Analysis by Country, 2024 to 2034

Figure 159: South Asia and Pacific Market Y-o-Y Growth (%) Projections by Country, 2024 to 2034

Figure 160: South Asia and Pacific Market Value (US$ Million) Analysis by Film Type, 2019 to 2034

Figure 161: South Asia and Pacific Market Volume (Square Meter) Analysis by Film Type, 2019 to 2034

Figure 162: South Asia and Pacific Market Value Share (%) and BPS Analysis by Film Type, 2024 to 2034

Figure 163: South Asia and Pacific Market Y-o-Y Growth (%) Projections by Film Type, 2024 to 2034

Figure 164: South Asia and Pacific Market Value (US$ Million) Analysis by Thickness, 2019 to 2034

Figure 165: South Asia and Pacific Market Volume (Square Meter) Analysis by Thickness, 2019 to 2034

Figure 166: South Asia and Pacific Market Value Share (%) and BPS Analysis by Thickness, 2024 to 2034

Figure 167: South Asia and Pacific Market Y-o-Y Growth (%) Projections by Thickness, 2024 to 2034

Figure 168: South Asia and Pacific Market Value (US$ Million) Analysis by Material, 2019 to 2034

Figure 169: South Asia and Pacific Market Volume (Square Meter) Analysis by Material, 2019 to 2034

Figure 170: South Asia and Pacific Market Value Share (%) and BPS Analysis by Material, 2024 to 2034

Figure 171: South Asia and Pacific Market Y-o-Y Growth (%) Projections by Material, 2024 to 2034

Figure 172: South Asia and Pacific Market Value (US$ Million) Analysis by Application, 2019 to 2034

Figure 173: South Asia and Pacific Market Volume (Square Meter) Analysis by Application, 2019 to 2034

Figure 174: South Asia and Pacific Market Value Share (%) and BPS Analysis by Application, 2024 to 2034

Figure 175: South Asia and Pacific Market Y-o-Y Growth (%) Projections by Application, 2024 to 2034

Figure 176: South Asia and Pacific Market Attractiveness by Film Type, 2024 to 2034

Figure 177: South Asia and Pacific Market Attractiveness by Thickness, 2024 to 2034

Figure 178: South Asia and Pacific Market Attractiveness by Material, 2024 to 2034

Figure 179: South Asia and Pacific Market Attractiveness by Application, 2024 to 2034

Figure 180: South Asia and Pacific Market Attractiveness by Country, 2024 to 2034

Figure 181: East Asia Market Value (US$ Million) by Film Type, 2024 to 2034

Figure 182: East Asia Market Value (US$ Million) by Thickness, 2024 to 2034

Figure 183: East Asia Market Value (US$ Million) by Material, 2024 to 2034

Figure 184: East Asia Market Value (US$ Million) by Application, 2024 to 2034

Figure 185: East Asia Market Value (US$ Million) by Country, 2024 to 2034

Figure 186: East Asia Market Value (US$ Million) Analysis by Country, 2019 to 2034

Figure 187: East Asia Market Volume (Square Meter) Analysis by Country, 2019 to 2034

Figure 188: East Asia Market Value Share (%) and BPS Analysis by Country, 2024 to 2034

Figure 189: East Asia Market Y-o-Y Growth (%) Projections by Country, 2024 to 2034

Figure 190: East Asia Market Value (US$ Million) Analysis by Film Type, 2019 to 2034

Figure 191: East Asia Market Volume (Square Meter) Analysis by Film Type, 2019 to 2034

Figure 192: East Asia Market Value Share (%) and BPS Analysis by Film Type, 2024 to 2034

Figure 193: East Asia Market Y-o-Y Growth (%) Projections by Film Type, 2024 to 2034

Figure 194: East Asia Market Value (US$ Million) Analysis by Thickness, 2019 to 2034

Figure 195: East Asia Market Volume (Square Meter) Analysis by Thickness, 2019 to 2034

Figure 196: East Asia Market Value Share (%) and BPS Analysis by Thickness, 2024 to 2034

Figure 197: East Asia Market Y-o-Y Growth (%) Projections by Thickness, 2024 to 2034

Figure 198: East Asia Market Value (US$ Million) Analysis by Material, 2019 to 2034

Figure 199: East Asia Market Volume (Square Meter) Analysis by Material, 2019 to 2034

Figure 200: East Asia Market Value Share (%) and BPS Analysis by Material, 2024 to 2034

Figure 201: East Asia Market Y-o-Y Growth (%) Projections by Material, 2024 to 2034

Figure 202: East Asia Market Value (US$ Million) Analysis by Application, 2019 to 2034

Figure 203: East Asia Market Volume (Square Meter) Analysis by Application, 2019 to 2034

Figure 204: East Asia Market Value Share (%) and BPS Analysis by Application, 2024 to 2034

Figure 205: East Asia Market Y-o-Y Growth (%) Projections by Application, 2024 to 2034

Figure 206: East Asia Market Attractiveness by Film Type, 2024 to 2034

Figure 207: East Asia Market Attractiveness by Thickness, 2024 to 2034

Figure 208: East Asia Market Attractiveness by Material, 2024 to 2034

Figure 209: East Asia Market Attractiveness by Application, 2024 to 2034

Figure 210: East Asia Market Attractiveness by Country, 2024 to 2034

Figure 211: Middle East and Africa Market Value (US$ Million) by Film Type, 2024 to 2034

Figure 212: Middle East and Africa Market Value (US$ Million) by Thickness, 2024 to 2034

Figure 213: Middle East and Africa Market Value (US$ Million) by Material, 2024 to 2034

Figure 214: Middle East and Africa Market Value (US$ Million) by Application, 2024 to 2034

Figure 215: Middle East and Africa Market Value (US$ Million) by Country, 2024 to 2034

Figure 216: Middle East and Africa Market Value (US$ Million) Analysis by Country, 2019 to 2034

Figure 217: Middle East and Africa Market Volume (Square Meter) Analysis by Country, 2019 to 2034

Figure 218: Middle East and Africa Market Value Share (%) and BPS Analysis by Country, 2024 to 2034

Figure 219: Middle East and Africa Market Y-o-Y Growth (%) Projections by Country, 2024 to 2034

Figure 220: Middle East and Africa Market Value (US$ Million) Analysis by Film Type, 2019 to 2034

Figure 221: Middle East and Africa Market Volume (Square Meter) Analysis by Film Type, 2019 to 2034

Figure 222: Middle East and Africa Market Value Share (%) and BPS Analysis by Film Type, 2024 to 2034

Figure 223: Middle East and Africa Market Y-o-Y Growth (%) Projections by Film Type, 2024 to 2034

Figure 224: Middle East and Africa Market Value (US$ Million) Analysis by Thickness, 2019 to 2034

Figure 225: Middle East and Africa Market Volume (Square Meter) Analysis by Thickness, 2019 to 2034

Figure 226: Middle East and Africa Market Value Share (%) and BPS Analysis by Thickness, 2024 to 2034

Figure 227: Middle East and Africa Market Y-o-Y Growth (%) Projections by Thickness, 2024 to 2034

Figure 228: Middle East and Africa Market Value (US$ Million) Analysis by Material, 2019 to 2034

Figure 229: Middle East and Africa Market Volume (Square Meter) Analysis by Material, 2019 to 2034

Figure 230: Middle East and Africa Market Value Share (%) and BPS Analysis by Material, 2024 to 2034

Figure 231: Middle East and Africa Market Y-o-Y Growth (%) Projections by Material, 2024 to 2034

Figure 232: Middle East and Africa Market Value (US$ Million) Analysis by Application, 2019 to 2034

Figure 233: Middle East and Africa Market Volume (Square Meter) Analysis by Application, 2019 to 2034

Figure 234: Middle East and Africa Market Value Share (%) and BPS Analysis by Application, 2024 to 2034

Figure 235: Middle East and Africa Market Y-o-Y Growth (%) Projections by Application, 2024 to 2034

Figure 236: Middle East and Africa Market Attractiveness by Film Type, 2024 to 2034

Figure 237: Middle East and Africa Market Attractiveness by Thickness, 2024 to 2034

Figure 238: Middle East and Africa Market Attractiveness by Material, 2024 to 2034

Figure 239: Middle East and Africa Market Attractiveness by Application, 2024 to 2034

Figure 240: Middle East and Africa Market Attractiveness by Country, 2024 to 2034

Recommendations

Packaging

Plastic Dielectric Films Market

Published : March 2023

Technology

Flexible Barrier Films for Electronics Market

Published : November 2022

Explore Technology Insights

View Reports