The electronic tactile tester market is valued at USD 85.9 million in 2025 and is expected to grow to USD 145.4 million by 2035, reflecting a CAGR of 5.4%. From 2021 to 2025, the market is projected to progress from USD 66.1 million to USD 85.9 million, with annual increments of USD 69.6 million, USD 73.4 million, USD 77.3 million, and USD 81.5 million. This early-stage growth is driven by increasing demand for tactile testing equipment across industries such as electronics, automotive, and consumer goods, where precision in haptic feedback and tactile response is critical. As industries seek to improve product testing and ensure high-quality user interfaces, the adoption of electronic tactile testers is gaining momentum.
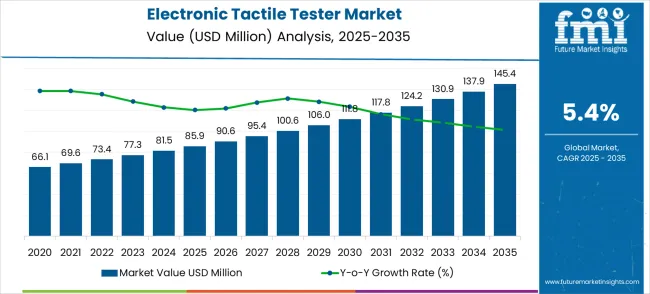
Between 2026 and 2030, the market continues to expand from USD 85.9 million to USD 111.8 million, passing through USD 90.6 million, 95.4 million, and 100.6 million along the way. Rising applications in product development, quality control, and research and development activities fuel this growth. Companies increasingly rely on tactile testers to simulate real-world user experiences, ensuring products meet performance standards and user expectations. By 2030, the market is expected to reach USD 111.8 million, driven by continued advancements in tactile sensing technology. From 2031 to 2035, the market is expected to further strengthen to USD 145.4 million, with intermediate values of USD 117.8 million, USD 124.2 million, USD 130.9 million, and USD 137.9 million, driven by the expanding use of these devices in various industries and the ongoing focus on improving tactile interaction in digital products.
| Metric | Value |
|---|---|
| Market Value (2025) | USD 85.9 million |
| Market Forecast Value (2035) | USD 145.4 million |
| Forecast CAGR (2025-2035) | 5.4% |
The electronics testing and measurement market contributes about 30-35%, driven by the increasing need for accurate tactile testing of touch panels, capacitive touch screens, and haptic devices. Electronic tactile testers are essential in ensuring the performance, durability, and quality of tactile feedback systems used in consumer electronics, automotive controls, and industrial machines. The consumer electronics market adds roughly 20-25%, as tactile testing is critical for the development and quality control of devices like smartphones, wearables, and gaming controllers, where user interaction is highly reliant on haptic feedback.
The automotive electronics market contributes around 15-18%, with increasing adoption of touch-sensitive interfaces and haptic controls in vehicles, making tactile testing crucial for in-vehicle infotainment systems, steering wheel controls, and other user interfaces. The medical device market accounts for approximately 12-15%, as electronic tactile testers are used to evaluate the functionality of touch-sensitive medical devices, such as diagnostic equipment, wearables, and medical controls, where tactile precision is vital. The industrial automation market contributes about 8-10%, as tactile testing ensures the reliability of touch-based control panels, robotics, and other automated systems used in manufacturing and production environments.
Market expansion is being supported by the rapid advancement of neuroscience research across developing economies and the corresponding need for reliable measurement systems for tactile sensitivity assessment in research facilities. Modern research operations require precise force measurement and sensitivity analysis to ensure optimal experimental conditions and data accuracy. The superior precision and performance characteristics of electronic tactile testers make them essential instruments in demanding research environments where measurement accuracy is critical.
The growing focus on research quality and experimental precision is driving demand for advanced tactile testing technologies from certified manufacturers with proven track records of reliability and accuracy. Research operators are increasingly investing in high-quality measurement systems that offer enhanced precision and reduced variability over extended research periods. Scientific standards and research protocols are establishing performance benchmarks that favor precision-engineered electronic tactile testing solutions with advanced measurement capabilities.
The market is segmented by force range, application, and region. By force range, the market is divided into low force (90g range), medium force (800g range), high force (1000g range), and other configurations. Based on application, the market is categorized into behavioral research, neuroscience research, and drug development. Regionally, the market is divided into North America, Europe, East Asia, South Asia & Pacific, Latin America, and Middle East & Africa.
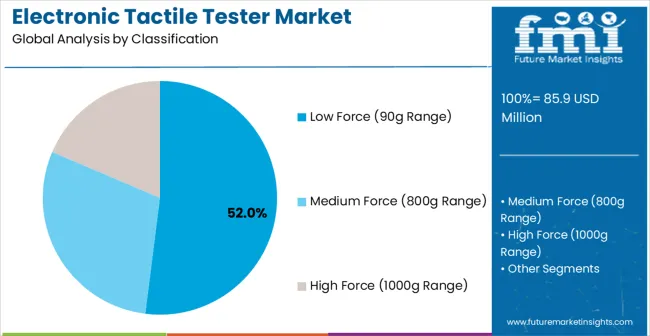
Low force (90g range) configurations are projected to account for 52% of the electronic tactile tester market in 2025. This leading position is supported by the increasing demand for sensitive tactile measurements in behavioral research applications and growing requirements for precise low-force testing protocols. Low force testers provide superior sensitivity and measurement accuracy for delicate tactile assessments, making them the preferred choice for behavioral studies, sensory research, and pain threshold investigations. The segment benefits from technological advancements that have improved the precision and reliability of low force measurement systems while reducing operational complexity.
Modern low force electronic tactile testers incorporate advanced force transducers, precision positioning systems, and sophisticated calibration technologies that enable accurate measurements at minimal force levels. These innovations have significantly improved research quality while reducing measurement variability through enhanced sensitivity and elimination of measurement drift. The neuroscience and behavioral research sectors particularly drive demand for low force solutions, as these fields require absolute measurement precision to maintain experimental validity and comply with stringent research protocols.
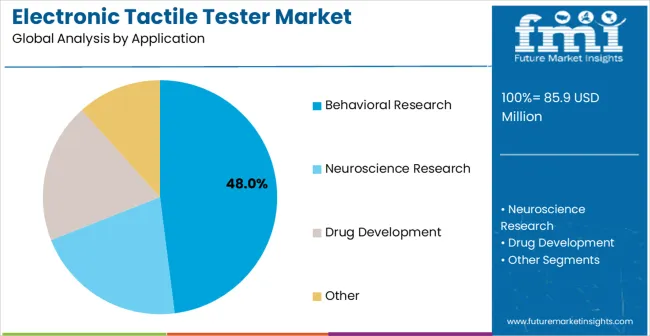
Behavioral research applications are expected to represent 48% of electronic tactile tester demand in 2025. This substantial share reflects the critical role of tactile measurement in behavioral studies and the need for reliable testing equipment capable of precise sensitivity assessment in diverse research conditions. Behavioral research facilities require effective and accurate tactile testing systems for sensory evaluation, pain assessment, and behavioral response measurement. The segment benefits from ongoing expansion of behavioral research programs in developing countries and increasing research funding requiring enhanced measurement systems in academic research facilities.
Advanced behavioral research demands exceptional tactile testing performance to ensure experimental accuracy and research reproducibility. These applications require testers capable of handling various force ranges, environmental conditions, and extended testing protocols. The growing focus on behavioral research standards, particularly in psychological studies and neurological research applications, drives consistent demand for high-performance measurement solutions. Emerging research markets in Asia-Pacific, Latin America, and European regions contribute significantly to market growth as research institutions invest in modern testing technologies to improve experimental quality and research competitiveness.
The electronic tactile tester market is advancing steadily due to increasing research investments and growing recognition of precision measurement technology importance. The market faces challenges including high equipment costs, need for specialized technical expertise, and varying measurement requirements across different research applications. Standardization efforts and calibration programs continue to influence equipment quality and market development patterns.
The growing deployment of computerized data collection systems and digital analysis interfaces is enabling real-time measurement recording and advanced statistical analysis capabilities in electronic tactile testing installations. Smart sensors and automated data processing systems provide continuous measurement monitoring while optimizing data quality and extending research productivity. These technologies are particularly valuable for large research institutions that require reliable measurement performance and comprehensive data management capabilities.
Modern tactile tester manufacturers are incorporating advanced measurement technologies and modular designs that improve testing versatility while enabling multiple force range capabilities through integrated measurement systems. Integration of variable force settings and advanced probe designs enables comprehensive tactile assessment and significant research flexibility compared to traditional single-range systems. Advanced materials and manufacturing techniques also support development of more durable and precise tactile testing components for demanding research environments.
| Country | CAGR (2025-2035) |
|---|---|
| China | 7.3% |
| India | 6.8% |
| Germany | 6.2% |
| Brazil | 5.7% |
| United States | 5.1% |
| United Kingdom | 4.6% |
| Japan | 4.1% |
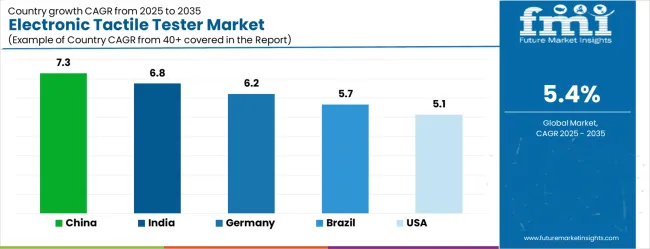
The electronic tactile tester market is growing rapidly, with China leading at a 7.3% CAGR through 2035, driven by massive research infrastructure expansion, neuroscience program development, and academic sector growth. India follows at 6.8%, supported by rising research investments and increasing funding for behavioural studies and neuroscience research facilities. Germany records strong growth at 6.2%, emphasizing precision engineering, research excellence, and advanced scientific capabilities. Brazil grows steadily at 5.7%, integrating tactile testing systems into expanding research operations and academic research facilities. The United States shows moderate growth at 5.1%, focusing on research innovation and measurement technology advancement improvements. The United Kingdom maintains steady expansion at 4.6%, supported by research modernization programs. Japan demonstrates stable growth at 4.1%, emphasizing technological innovation and research excellence.
The report covers an in-depth analysis of 40+ countries, with top-performing countries are highlighted below.
The electronic tactile tester system market in China is projected to exhibit the highest growth rate with a CAGR of 7.3% through 2035, driven by rapid research infrastructure expansion and massive neuroscience research program development across academic sectors. The country's growing research institutions and expanding behavioural studies facilities are creating significant demand for high-performance tactile testing systems. Major universities are establishing comprehensive measurement installations to support large-scale research operations and meet stringent scientific standards.
The research sector continues to expand rapidly, with major investments in neuroscience laboratories, behavioural research centers, and drug development facilities. The country's position as a growing research hub drives substantial demand for reliable tactile testing solutions that ensure measurement accuracy and research quality across diverse scientific applications.
Revenue from electronic tactile tester systems in India is expanding at a CAGR of 6.8%, supported by increasing research investments across academic sectors and growing funding for neuroscience and behavioral studies infrastructure. The country's expanding research institutions are driving demand for specialized tactile testing systems capable of handling diverse research environments. Academic facilities are investing in advanced measurement technologies to improve research quality and comply with international research standards.
The research development initiatives and academic program expansion create significant opportunities for electronic tactile tester applications. The country's growing research community drives demand for behavioral studies and neuroscience research equipment, requiring reliable measurement solutions to maintain research quality and experimental accuracy.
Demand for electronic tactile tester systems in Germany is projected to grow at a CAGR of 6.2%, supported by the country's focus on research excellence and advanced scientific capabilities. German research institutions are implementing high-performance tactile testing systems that meet stringent quality standards and research reliability requirements. The market is characterized by focus on precision measurement, advanced technologies, and compliance with comprehensive research protocols.
The advanced research sector and scientific excellence capabilities drive demand for high-quality tactile testing solutions. The country's focus on research quality, technological innovation, and measurement precision creates opportunities for advanced testing technologies that meet demanding scientific specifications.
The electronic tactile tester system market in Brazil is growing at a CAGR of 5.7%, driven by expanding research operations and increasing academic research development across scientific sectors. The country's growing university system is investing in advanced tactile testing systems to improve research capabilities and performance in expanding research environments. Academic facilities are adopting modern measurement technologies to support growing research requirements and quality standards.
The expanding research infrastructure and academic program development create substantial opportunities for electronic tactile tester applications. The country's growing research community and academic expansion drive investments in behavioral research and neuroscience equipment that enhance research competitiveness and scientific output.
The sale of electronic tactile tester systems in the United States is expanding at a CAGR of 5.1%, driven by ongoing research innovation and increasing focus on advanced measurement solutions. Research institutions are upgrading existing testing systems with advanced technologies that provide improved performance and enhanced research capabilities. The market benefits from replacement demand and facility modernization programs across multiple research sectors.
The United States market emphasizes research innovation, technology advancement, and measurement improvement in tactile testing applications. Advanced research and development activities drive the adoption of next-generation testing technologies that offer superior performance and scientific reliability.
Demand for electronic tactile tester systems in the United Kingdom is anticipated to grow at a CAGR of 4.6%, supported by ongoing research modernization programs and academic facility upgrades. Research operators are investing in reliable tactile testing systems that provide consistent performance and meet research compliance requirements. The market is characterized by focus on equipment reliability, research efficiency, and scientific compliance across diverse academic applications.
The United Kingdom's focus on research modernization and academic excellence drives demand for high-performance tactile testing solutions. The country's focus on research quality, scientific efficiency, and measurement compliance creates opportunities for advanced testing technologies.
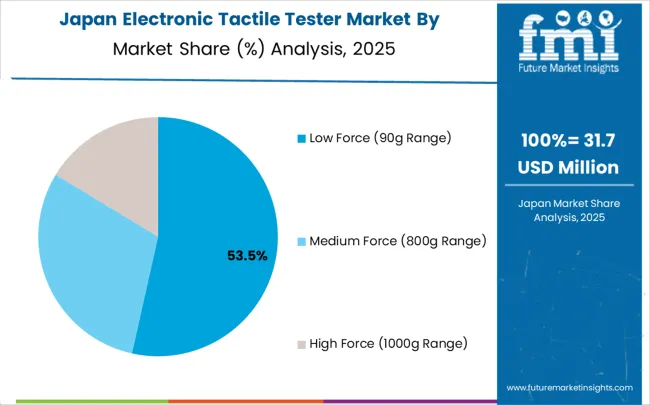
Revenue for electronic tactile tester systems in Japan is expanding at a CAGR of 4.1%, driven by the country's focus on technological innovation and research excellence in scientific applications. Japanese researchers are developing advanced tactile testing technologies that incorporate precision engineering and measurement-efficient design principles. The market benefits from focus on quality, reliability, and continuous improvement in research equipment performance.
The technological leadership and research expertise drive the development of advanced tactile testing solutions. The country's focus on innovation, quality control, and measurement optimization creates opportunities for cutting-edge testing technologies that set scientific standards.
The electronic tactile tester market is defined by competition among established scientific instrument manufacturers, specialized testing equipment companies, and regional technology firms. Companies are investing in advanced measurement technologies, product innovation, standardized quality systems, and technical support capabilities to deliver reliable, precise, and cost-effective tactile testing solutions. Strategic partnerships, technological advancement, and geographic expansion are central to strengthening product portfolios and market presence.
IITC, operating globally, offers comprehensive tactile testing solutions with focus on precision measurement, reliability, and technical support services. Ugo Basile, multinational, provides advanced testing systems with focus on research efficiency and measurement integration capabilities. SelinsBio, specialized manufacturer, delivers innovative tactile testing solutions for research applications with focus on accuracy and durability. Vitalab offers comprehensive testing technologies with standardized procedures and technical service support.
Pinnacle provides research tactile testing systems with focus on custom solutions and technical expertise. Harvard Starr Life delivers specialized testing equipment with focus on high-performance research applications. Stoelting offers comprehensive tactile testing technologies for demanding research environments with established manufacturing and service capabilities. The competitive landscape includes established manufacturers focusing on research and development, product innovation, and market expansion strategies. Companies are investing in advanced measurement technologies, precision manufacturing methods, and comprehensive technical support to maintain competitive positioning and market leadership.
The electronic tactile tester market underpins neuroscience research advancement, behavioral studies excellence, drug development precision, and scientific measurement reliability. With research funding mandates, stricter accuracy requirements, and demand for versatile measurement systems, the sector must balance cost competitiveness, measurement reliability, and technological innovation. Coordinated contributions from governments, industry bodies, OEMs/technology integrators, suppliers, and investors will accelerate the transition toward precision-optimized, technologically advanced, and research-focused tactile testing systems.
| Item | Value |
|---|---|
| Quantitative Units | USD 85.9 million |
| Force Range Type | Low Force (90g Range), Medium Force (800g Range), High Force (1000g Range), Other |
| Application | Behavioral Research, Neuroscience Research, Drug Development, and Other |
| Regions Covered | North America, Europe, East Asia, South Asia & Pacific, Latin America, Middle East & Africa |
| Country Covered | United States, Germany, India, China, United Kingdom, Japan, Brazil, and other 40+ countries |
| Key Companies Profiled | IITC, Ugo Basile, SelinsBio, Vitalab, Pinnacle, Harvard Starr Life, Stoelting |
| Additional Attributes | Dollar sales by force range type and application, regional demand trends across North America, Europe, and Asia-Pacific, competitive landscape with established manufacturers and emerging suppliers, buyer preferences for high-precision versus standard measurement systems, integration with digital data acquisition and analysis technologies, innovations in sensor technology and measurement processes for enhanced accuracy and reliability, and adoption of smart testing solutions with embedded calibration and remote monitoring capabilities for improved research efficiency. |
The global electronic tactile tester market is estimated to be valued at USD 85.9 million in 2025.
The market size for the electronic tactile tester market is projected to reach USD 145.4 million by 2035.
The electronic tactile tester market is expected to grow at a 5.4% CAGR between 2025 and 2035.
The key product types in electronic tactile tester market are low force (90g range), medium force (800g range) and high force (1000g range).
In terms of application, behavioral research segment to command 48.0% share in the electronic tactile tester market in 2025.


Our Research Products

The "Full Research Suite" delivers actionable market intel, deep dives on markets or technologies, so clients act faster, cut risk, and unlock growth.

The Leaderboard benchmarks and ranks top vendors, classifying them as Established Leaders, Leading Challengers, or Disruptors & Challengers.

Locates where complements amplify value and substitutes erode it, forecasting net impact by horizon

We deliver granular, decision-grade intel: market sizing, 5-year forecasts, pricing, adoption, usage, revenue, and operational KPIs—plus competitor tracking, regulation, and value chains—across 60 countries broadly.

Spot the shifts before they hit your P&L. We track inflection points, adoption curves, pricing moves, and ecosystem plays to show where demand is heading, why it is changing, and what to do next across high-growth markets and disruptive tech

Real-time reads of user behavior. We track shifting priorities, perceptions of today’s and next-gen services, and provider experience, then pace how fast tech moves from trial to adoption, blending buyer, consumer, and channel inputs with social signals (#WhySwitch, #UX).

Partner with our analyst team to build a custom report designed around your business priorities. From analysing market trends to assessing competitors or crafting bespoke datasets, we tailor insights to your needs.
Supplier Intelligence
Discovery & Profiling
Capacity & Footprint
Performance & Risk
Compliance & Governance
Commercial Readiness
Who Supplies Whom
Scorecards & Shortlists
Playbooks & Docs
Category Intelligence
Definition & Scope
Demand & Use Cases
Cost Drivers
Market Structure
Supply Chain Map
Trade & Policy
Operating Norms
Deliverables
Buyer Intelligence
Account Basics
Spend & Scope
Procurement Model
Vendor Requirements
Terms & Policies
Entry Strategy
Pain Points & Triggers
Outputs
Pricing Analysis
Benchmarks
Trends
Should-Cost
Indexation
Landed Cost
Commercial Terms
Deliverables
Brand Analysis
Positioning & Value Prop
Share & Presence
Customer Evidence
Go-to-Market
Digital & Reputation
Compliance & Trust
KPIs & Gaps
Outputs
Full Research Suite comprises of:
Market outlook & trends analysis
Interviews & case studies
Strategic recommendations
Vendor profiles & capabilities analysis
5-year forecasts
8 regions and 60+ country-level data splits
Market segment data splits
12 months of continuous data updates
DELIVERED AS:
PDF EXCEL ONLINE
Marine Electronics Tester Market Size and Share Forecast Outlook 2025 to 2035
Electronic Speed Controller (ESC) for Drones and UAVs Market Size and Share Forecast Outlook 2025 to 2035
Electronic Circulation Pump Market Size and Share Forecast Outlook 2025 to 2035
Electronic Lab Notebook (ELN) Market Size and Share Forecast Outlook 2025 to 2035
Electronic Control Unit in Automotive Systems Market Size and Share Forecast Outlook 2025 to 2035
Electronic Film Market Size and Share Forecast Outlook 2025 to 2035
Electronic Weighing Scale Market Size and Share Forecast Outlook 2025 to 2035
Electronic Packaging Adhesives Market Forecast and Outlook 2025 to 2035
Electronic Sealants Market Size and Share Forecast Outlook 2025 to 2035
Electronic Nasal Spray Devices Market Size and Share Forecast Outlook 2025 to 2035
Electronic Expansion Valves Market Size and Share Forecast Outlook 2025 to 2035
Electronics Adhesives Market Size and Share Forecast Outlook 2025 to 2035
Electronic Trial Master File (eTMF) System Market Size and Share Forecast Outlook 2025 to 2035
Electronic Wipes Market Size and Share Forecast Outlook 2025 to 2035
Electronic Grade Trisilylamine Market Size and Share Forecast Outlook 2025 to 2035
Electronically Scanned Arrays System Market Size and Share Forecast Outlook 2025 to 2035
Electronics Retailing Market Size and Share Forecast Outlook 2025 to 2035
Electronic Dictionary Market Size and Share Forecast Outlook 2025 to 2035
Electronic Shelf Label Market Analysis - Size, Share, and Forecast Outlook 2025 to 2035
Electronics Films Market Size and Share Forecast Outlook 2025 to 2035

Thank you!
You will receive an email from our Business Development Manager. Please be sure to check your SPAM/JUNK folder too.
Chat With
MaRIA