Reports

- Global Locations -

Headquarters

Future Market Insights, Inc.

Christiana Corporate, 200
Continental Drive, Suite 401,
Newark, Delaware - 19713,
United States

T: +1-845-579-5705

Americas

Future Market Insights, Inc.

616 Corporate Way, Suite 2-9018,
Valley Cottage, NY 10989, United States

T: +1-347-918-3531

MEA

Future Market Insights

1602-6 Jumeirah Bay X2 Tower, Plot No: JLT-PH2-X2A,
Jumeirah Lakes Towers, Dubai,
United Arab Emirates

Europe

Future Market Insights

3rd Floor, 207 Regent Street,
W1B 3HH London
United Kingdom

T: + 44 (0) 20 8123 9659
D: +44 (0) 20 3287 4268

Asia Pacific

Future Market Insights

IndiaLand Global Tech Park, Unit UG-1, Behind Grand HighStreet, Phase 1, Hinjawadi, MH, Pune – 411057, India

Electronic Weighing Scale Market Outlook 2024 to 2034

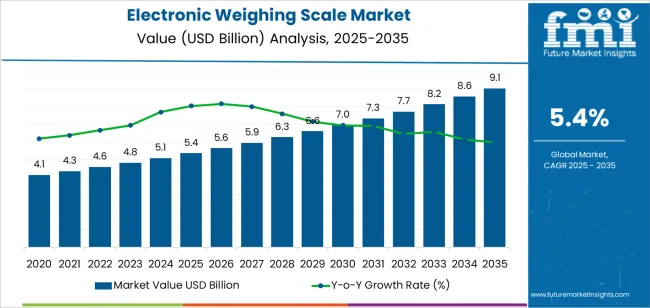
The electronic weighing scale market share is estimated to expand at a CAGR of 5.4% over the assessment period. The market valuation is assessed to improve from US$ 5,079.20 million in 2024 to US$ 8,569.30 million by 2034.

Key Trends Impacting the Electronic Weighing Scale Market

  • Various product innovations like the development of Internet of Things (IoT)-integrated weighing scales as well as water-resistant electronic weighing machines, which come with titanium platforms and backlit LCD.
  • Rising commercial activities are contributing to the sales of electronic weighing scales.
  • Companies are obtaining certificates from established agencies like the National Institute of Standards & Technology (NIST) for their products. This is because consumers rely on products that are backed by authoritative bodies during the purchasing process.
  • Tabletop variants of electronic weighing scales are increasingly being adopted for veterinary applications.
  • Various industries are undergoing automation for the measurement and testing of materials. This is fueling demand for electronic weighing scales for their precision in processes.
  • Players are also developing machines that help convert the reading on the LCD screen into any measurement unit that the customer requests. Additionally, players are stepping up by innovating a machine that runs on in-built batteries.
Attributes Key Insights
Estimated Electronic Weighing Scale Market Size (2024E) US$ 5,079.20 million
Projected Electronic Weighing Scale Market Valuation (2034F) US$ 8,569.30 million
Value-based CAGR (2024 to 2034) 5.4%

Don't pay for what you don't need

Customize your report by selecting specific countries or regions and save 30%!

Overview of Markets Adjacent to the Global Electronic Weighing Scale Industry

The table below compares different weight-related markets. These include the electronic weighing scale market, industrial weighing equipment market, and weigh-in-motion system market. A key highlight of this column is the emphasis on trends and opportunities that are surfacing in different markets.

It is concluded from the table that the weigh in motion system market is expected to advance at a greater pace of 10.3% through 2034. Demand for these systems is increasing owing to their surging use in roadways, process industries, railways, etc.

Electronic Weighing Scale Market:

Attributes Electronic Weighing Scale Market
CAGR (2024 to 2034) 5.4%
Growth Factor Rapid automation in various industries to test and measure materials
Opportunity Surging advancements in the product
Key Trends Rising traction for tabletop variants of electronic weighing scales

Industrial Weighing Equipment Market:

Attributes Industrial Weighing Equipment Market
CAGR (2024 to 2034) 6%
Growth Factor Increasing availability of industrial weighing equipment in portable form to promote user-friendliness and versatility in different sectors
Opportunity Rising investments in state-of-the-art solutions to ensure accurate measurements and enhance operational processes
Key Trends Integration of Industry 4.0 technologies to increase operational effectiveness and real-time monitoring

Weigh in Motion System Market:

Attributes Weigh in Motion System Market
CAGR (2024 to 2034) 10.3%
Growth Factor Surging use of weigh-in motion systems in multiple industries
Opportunity Allocation of funds to update weigh-in-motion systems for better accuracy, increasing efficiency, and sustainability
Key Trends Rising requirements for commercial transportation

Category-wise Electronic Weighing Scale Industry Analysis

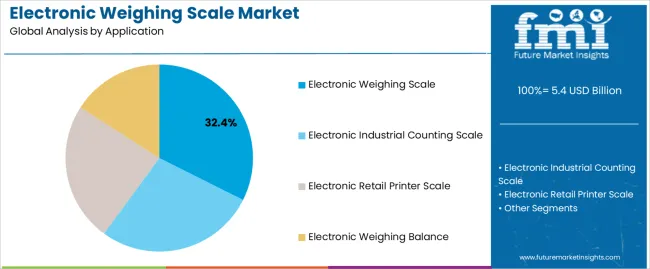
Electronic Industrial Counting Scale Form a Sizeable Market Portion

Leading Application Electronic Industrial Counting Scale
Value Share (2024) 30.20%

The electronic industrial counting scale is predicted to have a share of 30.20% in 2024. Factors that are catalyzing the expansion of this segment include:

  • Electronic industrial counting scales are finding greater use to quicken the counting process while reducing the scope for errors. This allows for conserving time, labor costs, and highly accurate results.
  • There is an increasing demand for these scales to efficiently track inventory and access data in real-time.
  • Rapid shift toward automation and the advent of Industry 4.0 are motivating the use of electronic industrial counting scales in various applications.

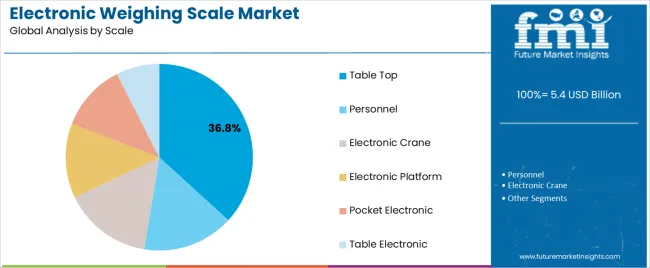
Electronic Platform to Account for a Notable Market Share

Leading Scale Electronic Platform
Value Share (2024) 23.60%

Based on scale, the electronic platform segment is expected to secure a share of 23.60% in the electronic weighing scale market. Top factors that are positively influencing the demand for the electronic platform are:

  • Key players are launching certain electronic platforms that can connect to networks or computers and assist in data collection, record-keeping, and analysis. This is in response to increasing demand for advanced technology in electronic platforms.
  • Electronic platforms typically have lower profiles, which makes it easy to load and unload items from them. The convenience of using electronic platforms is raising its adoption.
Sudip Saha
Sudip Saha

Principal Consultant

Talk to Analyst

Find your sweet spots for generating winning opportunities in this market.

Strategic Analysis of the Global Electronic Weighing Scale Market by Country

Countries Forecast CAGR (2024 to 2034)
The United States 2.20%
Germany 0.80%
Japan 0.10%
China 5.90%
Australia 8.90%

Rising Health and Wellness Concerns in the United States to Expand Prospects for Industry Leaders

Investments in electronic weighing scales within the United States are predicted to record a CAGR of 2.20% over the forecast period. Key factors that are increasing the prospects for industry participants in the country include:

  • Manufacturers in the country offer a wide variety of electronic weighing scales for all operations.
  • Latest innovations in the market include an innovative mobile weighing electric pallet jack. The device is built to lift, weigh, and move loads up to 4,000 lbs. It is ideal for heavy-duty warehouse applications, store deliveries, and lift-gate delivery fees. The product promotes weigh-on-the-go efficiency.
  • People in the United States invest some portion of their income in health and wellness activities. With health at the top of their minds and less spare time, the population is likely to purchase personal weighing scales to keep a regular and quick check on their weight to achieve their fitness goals and manage weight.

Pharmaceuticals and Food Processing Industries in Germany to Significantly Invest in Electronic Weighing Scales

In Germany, the demand for electronic weighing scales is projected to rise at a CAGR of 0.80% from 2024 to 2034. Certain motivating factors backing this market dynamics are:

  • Electronic weighing scales are highly valuable in manufacturing facilities as they promote industrial automation. Due to their ability to increase productivity and quality control, manufacturers are considering investing in electronic weighing scales to improve efficiency and accuracy in their processes.
  • In industries like food processing and pharmaceuticals, precision in measurement is not a requirement but a necessity. This factor is a guiding force behind the sales of electronic weighing scales, as their precision allows manufacturers to comply with strict regulations.

Key Players Targeting the Elderly Population of Japan are Making their Displays Easy to Read and Use

Sales of electronic weighing scales in Japan are projected to register a CAGR of 0.10% in the following decade. Some factors that are promising market growth are as follows:

  • Key providers of electronic weighing scales are finding business prospects in Japan where the inhabitants are highly focused on maintaining their health and well-being. Manufacturers are seen offering electronic scales with features like BMI calculation or body fat analysis to draw in customers, dedicated to tracking their health metrics.
  • Leading players also target Japan's aging population. Thus, they are developing electronic scales with improved stability and easy-to-read displays to attract older adults seeking convenience and safety.
  • Electronic weighing scales also have a role in packaging delivery for eCommerce shipments. These scales are used to accurately weigh a delivery package, and their demand is rising with the booming eCommerce industry.

Shift Toward Automation in the Manufacturing Sector of China to Raise Sales of Electronic Weighing Scales

Demand for electronic weighing scales is accelerating in China at a 5.90% CAGR from 2024 to 2034. Key factors that are impelling the growth of this regional electronic weighing scale market are:

  • The manufacturing sector is in the middle of a transformation, and this transformation is pointing toward greater efficiency and automation. As automation and productivity become a focal point for manufacturers, sales of electronic scales are set to increase as they offer reliable and more precise weighing.
  • Electronic weighing scales' versatility in industries ranging from pharmaceuticals and food to construction and logistics adds to their appeal among end users. Growth in these industries is dependent on China's economic activity, which is estimated to remain robust in the future. These contributory factors suggest a promising future for the sales of these scales.
  • The population in China is investing in personal weight management equipment like electronic weighing scales as the concept of home fitness draws in massive followers.

Demand for Electronic Weighing Scales Becomes Intense in Australia as Regulations in Certain Industries Become Stricter

The deployment of electronic weighing scales in Australia is observing an 8.90% CAGR, suggesting a promising future for key stakeholders and investors. The market is expected to flourish on account of:
  • Electronic scales are replacing the traditional mechanical ones in Australia, in line with the global trends. Their utility in various applications is rising as they ensure higher accuracy, ease of calibration, enhanced portability, and additional features like data connectivity.
  • In several industries in the country, such as packaging, manufacturing, food service, etc., regulations for accuracy are quite strict. This factor is driving the sales of electronic weighing scales among businesses that must adhere to these regulations.
  • Fitness activities among the population of Australia are increasing at a greater pace. This trend is fueling the sales of personal weighing scales to be used at home.

Competitive Landscape

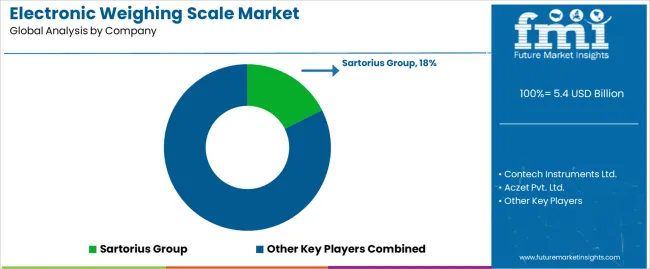
Key players are offering an extensive variety of electronic weighing scales to capture a greater population of potential customers. For instance, companies manufacture compact scales for personal use and specialized scales for certain industries.

Industry participants are introducing new features to digital weighing scales to enhance their functionality. Some of these features include body composition analysis, Bluetooth connectivity, and integration with inventory management software.

To reduce their carbon footprint, players are using eco-friendly materials, which is also attracting the interest of environmentally conscious businesses.

Industry players are offering their products at competitive prices or with flexible payment options to draw in budget-conscious buyers. Additionally, competitors are innovating easy-to-use scales that have intuitive interfaces and enhance customer satisfaction.

Latest Instances Shaping the Electronic Weighing Scale Market

  • In September 2023, the government of India introduced an initiative to fight against ration shop frauds by integrating e-POS weighing machines. This initiative sought to prevent tampering with weights and measurements. Key aim of this initiative is to eliminate the black market.
  • In July 2023, Victoria Arduino, an Italian espresso machine maker introduced a ‘Virtual Intelligent Scale’ (VIS) for integration in Eagle One commercial espresso machines. The company developed VIS to provide Eagle One Owners faster workflow than the earlier version.
  • In December 2020, Eufy, a sub-brand of Anker, introduced the Smart Weighing Scale C1 in India. The machine is equipped with smartphone connectivity and other intelligent features to assist users in monitoring health, tracking fitness, and attaining fitness goals. When linked to the EufyHome app on a smartphone, this weighing scale can measure 12 parameters in total. Some of them include Muscle Mass, Visceral Fat, Lean Body Mass, etc.

Get the data you need at a Fraction of the cost

Personalize your report by choosing insights you need
and save 40%!

Key Coverage in the Global Electronic Weighing Scale Market Research Report

  • Adjacent Study of the Weighing Equipment Market, Digital Scales Market, Commercial Weighing Scale Market, and Electronic Balance Market
  • Growth Analysis of Precision Weighing Scale Market

Key Players in the Electronic Weighing Scale Market

  • Contech Instruments Ltd.
  • Aczet Pvt. Ltd.
  • Essae Group
  • A&D Weighing Inc.
  • Adam Equipment Inc.
  • ATRAX Group NZ Ltd.
  • Avery Weigh-Tronix Ltd.
  • D. Brash & Sons Ltd.
  • Easiweigh Ltd.
  • Yes Technologies
  • Truweigh LLC
  • Kern & Sohn GmbH
  • Fairbanks Scales Inc.
  • Rice Lake Weighing Systems
  • BONSO Electronics International Inc.
  • Shimadzu Corporation
  • Sartorius Group
  • Others

Electronic Weighing Scale Market Research by Categories

By Application:

  • Electronic Weighing Scale
  • Electronic Industrial Counting Scale
  • Electronic Retail Printer Scale
  • Electronic Weighing Balance

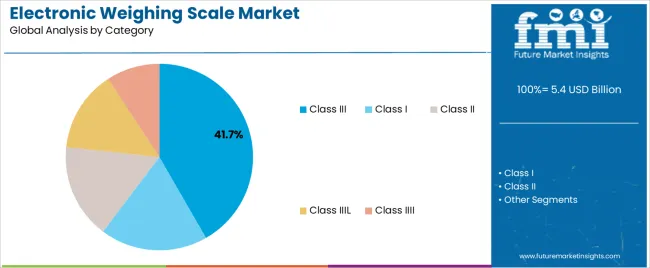
By Category:

  • Class I
  • Class II
  • Class III
  • Class IIIL
  • Class IIII

By Scale:

  • Table Top
  • Personnel
  • Electronic Crane
  • Electronic Platform
  • Pocket Electronic
  • Table Electronic

By Region:

  • North America
  • Europe
  • Asia Pacific
  • Middle East and Africa
  • Latin America

Frequently Asked Questions

What is the Market Valuation of Electronic Weighing Scale Market as of 2024?

For the year 2024, the electronic weighing scale industry is estimated to be valued at US$ 5,079.20 million.

What is the Projected Adoption Rate of Electronic Weighing Scales for the Years Between 2024 to 2034?

The adoption rate of electronic weighing scales is calculated to be around 5.40% for the forecast period.

How Much Revenue this Industry is Expected to Generate by 2034?

The market revenue is expected to shoot up to US$ 8,569.30 million by 2034.

Which Application Segment is Going to Excessively Utilize Electronic Weighing Scale?

The electronic industrial counting scale is expected to unduly deploy the electronic weighing scale.

Which Country is Expected to Offer Greater Business Opportunities to Providers of Electronic Weighing Scale?

Australia is expected to offer significant growth opportunities for businesses to prosper in the future.

Which Companies in the Electronic Weighing Scale Industry are Influential?

A&D Weighing Inc., Adam Equipment Inc., and ATRAX Group NZ Ltd. are influential players in the electronic weighing scale industry.

Table of Content

1. Executive Summary

    1.1. Global Market Outlook

    1.2. Demand-side Trends

    1.3. Supply-side Trends

    1.4. Technology Roadmap Analysis

    1.5. Analysis and Recommendations

2. Market Overview

    2.1. Market Coverage / Taxonomy

    2.2. Market Definition / Scope / Limitations

3. Market Background

    3.1. Market Dynamics

        3.1.1. Drivers

        3.1.2. Restraints

        3.1.3. Opportunity

        3.1.4. Trends

    3.2. Scenario Forecast

        3.2.1. Demand in Optimistic Scenario

        3.2.2. Demand in Likely Scenario

        3.2.3. Demand in Conservative Scenario

    3.3. Opportunity Map Analysis

    3.4. Product Life Cycle Analysis

    3.5. Supply Chain Analysis

        3.5.1. Supply Side Participants and their Roles

            3.5.1.1. Manufacturer

            3.5.1.2. Mid-Level Participants (Traders)

            3.5.1.3. Wholesalers and Distributors

        3.5.2. Value Added and Value Created at Node in the Supply Chain

        3.5.3. List of Raw Material Suppliers

        3.5.4. List of Existing and Potential Buyer’s

    3.6. Investment Feasibility Matrix

    3.7. Value Chain Analysis

        3.7.1. Profit Margin Analysis

        3.7.2. Wholesalers and Distributors

        3.7.3. Retailers

    3.8. PESTLE and Porter’s Analysis

    3.9. Regulatory Landscape

        3.9.1. By Key Regions

        3.9.2. By Key Countries

    3.10. Regional Parent Market Outlook

    3.11. Production and Consumption Statistics

    3.12. Import and Export Statistics

4. Global Market Analysis 2019 to 2023 and Forecast, 2024 to 2034

    4.1. Historical Market Size Value (US$ Million) & Volume (Units) Analysis, 2019 to 2023

    4.2. Current and Future Market Size Value (US$ Million) & Volume (Units) Projections, 2024 to 2034

        4.2.1. Y-o-Y Growth Trend Analysis

        4.2.2. Absolute $ Opportunity Analysis

5. Global Market Analysis 2019 to 2023 and Forecast 2024 to 2034, By Scale

    5.1. Introduction / Key Findings

    5.2. Historical Market Size Value (US$ Million) & Volume (Units) Analysis By Scale, 2019 to 2023

    5.3. Current and Future Market Size Value (US$ Million) & Volume (Units) Analysis and Forecast By Scale, 2024 to 2034

        5.3.1. Table Top

        5.3.2. Personnel

        5.3.3. Electronic Crane

        5.3.4. Electronic Platform

        5.3.5. Pocket Electronic

        5.3.6. Table Electronic

    5.4. Y-o-Y Growth Trend Analysis By Scale, 2019 to 2023

    5.5. Absolute $ Opportunity Analysis By Scale, 2024 to 2034

6. Global Market Analysis 2019 to 2023 and Forecast 2024 to 2034, By Class

    6.1. Introduction / Key Findings

    6.2. Historical Market Size Value (US$ Million) & Volume (Units) Analysis By Class, 2019 to 2023

    6.3. Current and Future Market Size Value (US$ Million) & Volume (Units) Analysis and Forecast By Class, 2024 to 2034

        6.3.1. Class I

        6.3.2. Class II

        6.3.3. Class III

        6.3.4. Class IIIL

        6.3.5. Class IIII

    6.4. Y-o-Y Growth Trend Analysis By Class, 2019 to 2023

    6.5. Absolute $ Opportunity Analysis By Class, 2024 to 2034

7. Global Market Analysis 2019 to 2023 and Forecast 2024 to 2034, By Application

    7.1. Introduction / Key Findings

    7.2. Historical Market Size Value (US$ Million) & Volume (Units) Analysis By Application, 2019 to 2023

    7.3. Current and Future Market Size Value (US$ Million) & Volume (Units) Analysis and Forecast By Application, 2024 to 2034

        7.3.1. Electronic Weighing Scale

        7.3.2. Electronic Industrial Counting Scale

        7.3.3. Electronic Retail Printer Scale

        7.3.4. Electronic Weighing Balance

    7.4. Y-o-Y Growth Trend Analysis By Application, 2019 to 2023

    7.5. Absolute $ Opportunity Analysis By Application, 2024 to 2034

8. Global Market Analysis 2019 to 2023 and Forecast 2024 to 2034, By Region

    8.1. Introduction

    8.2. Historical Market Size Value (US$ Million) & Volume (Units) Analysis By Region, 2019 to 2023

    8.3. Current Market Size Value (US$ Million) & Volume (Units) Analysis and Forecast By Region, 2024 to 2034

        8.3.1. North America

        8.3.2. Latin America

        8.3.3. Western Europe

        8.3.4. Eastern Europe

        8.3.5. South Asia and Pacific

        8.3.6. East Asia

        8.3.7. Middle East and Africa

    8.4. Market Attractiveness Analysis By Region

9. North America Market Analysis 2019 to 2023 and Forecast 2024 to 2034, By Country

    9.1. Historical Market Size Value (US$ Million) & Volume (Units) Trend Analysis By Market Taxonomy, 2019 to 2023

    9.2. Market Size Value (US$ Million) & Volume (Units) Forecast By Market Taxonomy, 2024 to 2034

        9.2.1. By Country

            9.2.1.1. USA

            9.2.1.2. Canada

        9.2.2. By Scale

        9.2.3. By Class

        9.2.4. By Application

    9.3. Market Attractiveness Analysis

        9.3.1. By Country

        9.3.2. By Scale

        9.3.3. By Class

        9.3.4. By Application

    9.4. Key Takeaways

10. Latin America Market Analysis 2019 to 2023 and Forecast 2024 to 2034, By Country

    10.1. Historical Market Size Value (US$ Million) & Volume (Units) Trend Analysis By Market Taxonomy, 2019 to 2023

    10.2. Market Size Value (US$ Million) & Volume (Units) Forecast By Market Taxonomy, 2024 to 2034

        10.2.1. By Country

            10.2.1.1. Brazil

            10.2.1.2. Mexico

            10.2.1.3. Rest of Latin America

        10.2.2. By Scale

        10.2.3. By Class

        10.2.4. By Application

    10.3. Market Attractiveness Analysis

        10.3.1. By Country

        10.3.2. By Scale

        10.3.3. By Class

        10.3.4. By Application

    10.4. Key Takeaways

11. Western Europe Market Analysis 2019 to 2023 and Forecast 2024 to 2034, By Country

    11.1. Historical Market Size Value (US$ Million) & Volume (Units) Trend Analysis By Market Taxonomy, 2019 to 2023

    11.2. Market Size Value (US$ Million) & Volume (Units) Forecast By Market Taxonomy, 2024 to 2034

        11.2.1. By Country

            11.2.1.1. Germany

            11.2.1.2. UK

            11.2.1.3. France

            11.2.1.4. Spain

            11.2.1.5. Italy

            11.2.1.6. Rest of Western Europe

        11.2.2. By Scale

        11.2.3. By Class

        11.2.4. By Application

    11.3. Market Attractiveness Analysis

        11.3.1. By Country

        11.3.2. By Scale

        11.3.3. By Class

        11.3.4. By Application

    11.4. Key Takeaways

12. Eastern Europe Market Analysis 2019 to 2023 and Forecast 2024 to 2034, By Country

    12.1. Historical Market Size Value (US$ Million) & Volume (Units) Trend Analysis By Market Taxonomy, 2019 to 2023

    12.2. Market Size Value (US$ Million) & Volume (Units) Forecast By Market Taxonomy, 2024 to 2034

        12.2.1. By Country

            12.2.1.1. Poland

            12.2.1.2. Russia

            12.2.1.3. Czech Republic

            12.2.1.4. Romania

            12.2.1.5. Rest of Eastern Europe

        12.2.2. By Scale

        12.2.3. By Class

        12.2.4. By Application

    12.3. Market Attractiveness Analysis

        12.3.1. By Country

        12.3.2. By Scale

        12.3.3. By Class

        12.3.4. By Application

    12.4. Key Takeaways

13. South Asia and Pacific Market Analysis 2019 to 2023 and Forecast 2024 to 2034, By Country

    13.1. Historical Market Size Value (US$ Million) & Volume (Units) Trend Analysis By Market Taxonomy, 2019 to 2023

    13.2. Market Size Value (US$ Million) & Volume (Units) Forecast By Market Taxonomy, 2024 to 2034

        13.2.1. By Country

            13.2.1.1. India

            13.2.1.2. Bangladesh

            13.2.1.3. Australia

            13.2.1.4. New Zealand

            13.2.1.5. Rest of South Asia and Pacific

        13.2.2. By Scale

        13.2.3. By Class

        13.2.4. By Application

    13.3. Market Attractiveness Analysis

        13.3.1. By Country

        13.3.2. By Scale

        13.3.3. By Class

        13.3.4. By Application

    13.4. Key Takeaways

14. East Asia Market Analysis 2019 to 2023 and Forecast 2024 to 2034, By Country

    14.1. Historical Market Size Value (US$ Million) & Volume (Units) Trend Analysis By Market Taxonomy, 2019 to 2023

    14.2. Market Size Value (US$ Million) & Volume (Units) Forecast By Market Taxonomy, 2024 to 2034

        14.2.1. By Country

            14.2.1.1. China

            14.2.1.2. Japan

            14.2.1.3. South Korea

        14.2.2. By Scale

        14.2.3. By Class

        14.2.4. By Application

    14.3. Market Attractiveness Analysis

        14.3.1. By Country

        14.3.2. By Scale

        14.3.3. By Class

        14.3.4. By Application

    14.4. Key Takeaways

15. Middle East and Africa Market Analysis 2019 to 2023 and Forecast 2024 to 2034, By Country

    15.1. Historical Market Size Value (US$ Million) & Volume (Units) Trend Analysis By Market Taxonomy, 2019 to 2023

    15.2. Market Size Value (US$ Million) & Volume (Units) Forecast By Market Taxonomy, 2024 to 2034

        15.2.1. By Country

            15.2.1.1. GCC Countries

            15.2.1.2. South Africa

            15.2.1.3. Israel

            15.2.1.4. Rest of MEA

        15.2.2. By Scale

        15.2.3. By Class

        15.2.4. By Application

    15.3. Market Attractiveness Analysis

        15.3.1. By Country

        15.3.2. By Scale

        15.3.3. By Class

        15.3.4. By Application

    15.4. Key Takeaways

16. Key Countries Market Analysis

    16.1. USA

        16.1.1. Pricing Analysis

        16.1.2. Market Share Analysis, 2023

            16.1.2.1. By Scale

            16.1.2.2. By Class

            16.1.2.3. By Application

    16.2. Canada

        16.2.1. Pricing Analysis

        16.2.2. Market Share Analysis, 2023

            16.2.2.1. By Scale

            16.2.2.2. By Class

            16.2.2.3. By Application

    16.3. Brazil

        16.3.1. Pricing Analysis

        16.3.2. Market Share Analysis, 2023

            16.3.2.1. By Scale

            16.3.2.2. By Class

            16.3.2.3. By Application

    16.4. Mexico

        16.4.1. Pricing Analysis

        16.4.2. Market Share Analysis, 2023

            16.4.2.1. By Scale

            16.4.2.2. By Class

            16.4.2.3. By Application

    16.5. Germany

        16.5.1. Pricing Analysis

        16.5.2. Market Share Analysis, 2023

            16.5.2.1. By Scale

            16.5.2.2. By Class

            16.5.2.3. By Application

    16.6. UK

        16.6.1. Pricing Analysis

        16.6.2. Market Share Analysis, 2023

            16.6.2.1. By Scale

            16.6.2.2. By Class

            16.6.2.3. By Application

    16.7. France

        16.7.1. Pricing Analysis

        16.7.2. Market Share Analysis, 2023

            16.7.2.1. By Scale

            16.7.2.2. By Class

            16.7.2.3. By Application

    16.8. Spain

        16.8.1. Pricing Analysis

        16.8.2. Market Share Analysis, 2023

            16.8.2.1. By Scale

            16.8.2.2. By Class

            16.8.2.3. By Application

    16.9. Italy

        16.9.1. Pricing Analysis

        16.9.2. Market Share Analysis, 2023

            16.9.2.1. By Scale

            16.9.2.2. By Class

            16.9.2.3. By Application

    16.10. Poland

        16.10.1. Pricing Analysis

        16.10.2. Market Share Analysis, 2023

            16.10.2.1. By Scale

            16.10.2.2. By Class

            16.10.2.3. By Application

    16.11. Russia

        16.11.1. Pricing Analysis

        16.11.2. Market Share Analysis, 2023

            16.11.2.1. By Scale

            16.11.2.2. By Class

            16.11.2.3. By Application

    16.12. Czech Republic

        16.12.1. Pricing Analysis

        16.12.2. Market Share Analysis, 2023

            16.12.2.1. By Scale

            16.12.2.2. By Class

            16.12.2.3. By Application

    16.13. Romania

        16.13.1. Pricing Analysis

        16.13.2. Market Share Analysis, 2023

            16.13.2.1. By Scale

            16.13.2.2. By Class

            16.13.2.3. By Application

    16.14. India

        16.14.1. Pricing Analysis

        16.14.2. Market Share Analysis, 2023

            16.14.2.1. By Scale

            16.14.2.2. By Class

            16.14.2.3. By Application

    16.15. Bangladesh

        16.15.1. Pricing Analysis

        16.15.2. Market Share Analysis, 2023

            16.15.2.1. By Scale

            16.15.2.2. By Class

            16.15.2.3. By Application

    16.16. Australia

        16.16.1. Pricing Analysis

        16.16.2. Market Share Analysis, 2023

            16.16.2.1. By Scale

            16.16.2.2. By Class

            16.16.2.3. By Application

    16.17. New Zealand

        16.17.1. Pricing Analysis

        16.17.2. Market Share Analysis, 2023

            16.17.2.1. By Scale

            16.17.2.2. By Class

            16.17.2.3. By Application

    16.18. China

        16.18.1. Pricing Analysis

        16.18.2. Market Share Analysis, 2023

            16.18.2.1. By Scale

            16.18.2.2. By Class

            16.18.2.3. By Application

    16.19. Japan

        16.19.1. Pricing Analysis

        16.19.2. Market Share Analysis, 2023

            16.19.2.1. By Scale

            16.19.2.2. By Class

            16.19.2.3. By Application

    16.20. South Korea

        16.20.1. Pricing Analysis

        16.20.2. Market Share Analysis, 2023

            16.20.2.1. By Scale

            16.20.2.2. By Class

            16.20.2.3. By Application

    16.21. GCC Countries

        16.21.1. Pricing Analysis

        16.21.2. Market Share Analysis, 2023

            16.21.2.1. By Scale

            16.21.2.2. By Class

            16.21.2.3. By Application

    16.22. South Africa

        16.22.1. Pricing Analysis

        16.22.2. Market Share Analysis, 2023

            16.22.2.1. By Scale

            16.22.2.2. By Class

            16.22.2.3. By Application

    16.23. Israel

        16.23.1. Pricing Analysis

        16.23.2. Market Share Analysis, 2023

            16.23.2.1. By Scale

            16.23.2.2. By Class

            16.23.2.3. By Application

17. Market Structure Analysis

    17.1. Competition Dashboard

    17.2. Competition Benchmarking

    17.3. Market Share Analysis of Top Players

        17.3.1. By Regional

        17.3.2. By Scale

        17.3.3. By Class

        17.3.4. By Application

18. Competition Analysis

    18.1. Competition Deep Dive

        18.1.1. Contech Instruments Ltd

            18.1.1.1. Overview

            18.1.1.2. Product Portfolio

            18.1.1.3. Profitability by Market Segments

            18.1.1.4. Sales Footprint

            18.1.1.5. Strategy Overview

                18.1.1.5.1. Marketing Strategy

                18.1.1.5.2. Product Strategy

                18.1.1.5.3. Channel Strategy

        18.1.2. Aczet Pvt. Ltd.

            18.1.2.1. Overview

            18.1.2.2. Product Portfolio

            18.1.2.3. Profitability by Market Segments

            18.1.2.4. Sales Footprint

            18.1.2.5. Strategy Overview

                18.1.2.5.1. Marketing Strategy

                18.1.2.5.2. Product Strategy

                18.1.2.5.3. Channel Strategy

        18.1.3. Essae Group

            18.1.3.1. Overview

            18.1.3.2. Product Portfolio

            18.1.3.3. Profitability by Market Segments

            18.1.3.4. Sales Footprint

            18.1.3.5. Strategy Overview

                18.1.3.5.1. Marketing Strategy

                18.1.3.5.2. Product Strategy

                18.1.3.5.3. Channel Strategy

        18.1.4. A&D Weighing Inc

            18.1.4.1. Overview

            18.1.4.2. Product Portfolio

            18.1.4.3. Profitability by Market Segments

            18.1.4.4. Sales Footprint

            18.1.4.5. Strategy Overview

                18.1.4.5.1. Marketing Strategy

                18.1.4.5.2. Product Strategy

                18.1.4.5.3. Channel Strategy

        18.1.5. Adam Equipment Inc

            18.1.5.1. Overview

            18.1.5.2. Product Portfolio

            18.1.5.3. Profitability by Market Segments

            18.1.5.4. Sales Footprint

            18.1.5.5. Strategy Overview

                18.1.5.5.1. Marketing Strategy

                18.1.5.5.2. Product Strategy

                18.1.5.5.3. Channel Strategy

        18.1.6. ATRAX Group NZ Ltd

            18.1.6.1. Overview

            18.1.6.2. Product Portfolio

            18.1.6.3. Profitability by Market Segments

            18.1.6.4. Sales Footprint

            18.1.6.5. Strategy Overview

                18.1.6.5.1. Marketing Strategy

                18.1.6.5.2. Product Strategy

                18.1.6.5.3. Channel Strategy

        18.1.7. Avery Weigh-Tronix Ltd

            18.1.7.1. Overview

            18.1.7.2. Product Portfolio

            18.1.7.3. Profitability by Market Segments

            18.1.7.4. Sales Footprint

            18.1.7.5. Strategy Overview

                18.1.7.5.1. Marketing Strategy

                18.1.7.5.2. Product Strategy

                18.1.7.5.3. Channel Strategy

        18.1.8. Easiweigh Ltd

            18.1.8.1. Overview

            18.1.8.2. Product Portfolio

            18.1.8.3. Profitability by Market Segments

            18.1.8.4. Sales Footprint

            18.1.8.5. Strategy Overview

                18.1.8.5.1. Marketing Strategy

                18.1.8.5.2. Product Strategy

                18.1.8.5.3. Channel Strategy

        18.1.9. Truweigh LLC

            18.1.9.1. Overview

            18.1.9.2. Product Portfolio

            18.1.9.3. Profitability by Market Segments

            18.1.9.4. Sales Footprint

            18.1.9.5. Strategy Overview

                18.1.9.5.1. Marketing Strategy

                18.1.9.5.2. Product Strategy

                18.1.9.5.3. Channel Strategy

        18.1.10. Kern & Sohn GmbH

            18.1.10.1. Overview

            18.1.10.2. Product Portfolio

            18.1.10.3. Profitability by Market Segments

            18.1.10.4. Sales Footprint

            18.1.10.5. Strategy Overview

                18.1.10.5.1. Marketing Strategy

                18.1.10.5.2. Product Strategy

                18.1.10.5.3. Channel Strategy

19. Assumptions & Acronyms Used

20. Research Methodology

Don't pay for what you don't need

Customize your report by selecting specific countries or regions and save 30%!

List of Tables

Table 1: Global Market Value (US$ Million) Forecast by Region, 2019 to 2034

Table 2: Global Market Volume (Units) Forecast by Region, 2019 to 2034

Table 3: Global Market Value (US$ Million) Forecast by Scale, 2019 to 2034

Table 4: Global Market Volume (Units) Forecast by Scale, 2019 to 2034

Table 5: Global Market Value (US$ Million) Forecast by Class, 2019 to 2034

Table 6: Global Market Volume (Units) Forecast by Class, 2019 to 2034

Table 7: Global Market Value (US$ Million) Forecast by Application, 2019 to 2034

Table 8: Global Market Volume (Units) Forecast by Application, 2019 to 2034

Table 9: North America Market Value (US$ Million) Forecast by Country, 2019 to 2034

Table 10: North America Market Volume (Units) Forecast by Country, 2019 to 2034

Table 11: North America Market Value (US$ Million) Forecast by Scale, 2019 to 2034

Table 12: North America Market Volume (Units) Forecast by Scale, 2019 to 2034

Table 13: North America Market Value (US$ Million) Forecast by Class, 2019 to 2034

Table 14: North America Market Volume (Units) Forecast by Class, 2019 to 2034

Table 15: North America Market Value (US$ Million) Forecast by Application, 2019 to 2034

Table 16: North America Market Volume (Units) Forecast by Application, 2019 to 2034

Table 17: Latin America Market Value (US$ Million) Forecast by Country, 2019 to 2034

Table 18: Latin America Market Volume (Units) Forecast by Country, 2019 to 2034

Table 19: Latin America Market Value (US$ Million) Forecast by Scale, 2019 to 2034

Table 20: Latin America Market Volume (Units) Forecast by Scale, 2019 to 2034

Table 21: Latin America Market Value (US$ Million) Forecast by Class, 2019 to 2034

Table 22: Latin America Market Volume (Units) Forecast by Class, 2019 to 2034

Table 23: Latin America Market Value (US$ Million) Forecast by Application, 2019 to 2034

Table 24: Latin America Market Volume (Units) Forecast by Application, 2019 to 2034

Table 25: Western Europe Market Value (US$ Million) Forecast by Country, 2019 to 2034

Table 26: Western Europe Market Volume (Units) Forecast by Country, 2019 to 2034

Table 27: Western Europe Market Value (US$ Million) Forecast by Scale, 2019 to 2034

Table 28: Western Europe Market Volume (Units) Forecast by Scale, 2019 to 2034

Table 29: Western Europe Market Value (US$ Million) Forecast by Class, 2019 to 2034

Table 30: Western Europe Market Volume (Units) Forecast by Class, 2019 to 2034

Table 31: Western Europe Market Value (US$ Million) Forecast by Application, 2019 to 2034

Table 32: Western Europe Market Volume (Units) Forecast by Application, 2019 to 2034

Table 33: Eastern Europe Market Value (US$ Million) Forecast by Country, 2019 to 2034

Table 34: Eastern Europe Market Volume (Units) Forecast by Country, 2019 to 2034

Table 35: Eastern Europe Market Value (US$ Million) Forecast by Scale, 2019 to 2034

Table 36: Eastern Europe Market Volume (Units) Forecast by Scale, 2019 to 2034

Table 37: Eastern Europe Market Value (US$ Million) Forecast by Class, 2019 to 2034

Table 38: Eastern Europe Market Volume (Units) Forecast by Class, 2019 to 2034

Table 39: Eastern Europe Market Value (US$ Million) Forecast by Application, 2019 to 2034

Table 40: Eastern Europe Market Volume (Units) Forecast by Application, 2019 to 2034

Table 41: South Asia and Pacific Market Value (US$ Million) Forecast by Country, 2019 to 2034

Table 42: South Asia and Pacific Market Volume (Units) Forecast by Country, 2019 to 2034

Table 43: South Asia and Pacific Market Value (US$ Million) Forecast by Scale, 2019 to 2034

Table 44: South Asia and Pacific Market Volume (Units) Forecast by Scale, 2019 to 2034

Table 45: South Asia and Pacific Market Value (US$ Million) Forecast by Class, 2019 to 2034

Table 46: South Asia and Pacific Market Volume (Units) Forecast by Class, 2019 to 2034

Table 47: South Asia and Pacific Market Value (US$ Million) Forecast by Application, 2019 to 2034

Table 48: South Asia and Pacific Market Volume (Units) Forecast by Application, 2019 to 2034

Table 49: East Asia Market Value (US$ Million) Forecast by Country, 2019 to 2034

Table 50: East Asia Market Volume (Units) Forecast by Country, 2019 to 2034

Table 51: East Asia Market Value (US$ Million) Forecast by Scale, 2019 to 2034

Table 52: East Asia Market Volume (Units) Forecast by Scale, 2019 to 2034

Table 53: East Asia Market Value (US$ Million) Forecast by Class, 2019 to 2034

Table 54: East Asia Market Volume (Units) Forecast by Class, 2019 to 2034

Table 55: East Asia Market Value (US$ Million) Forecast by Application, 2019 to 2034

Table 56: East Asia Market Volume (Units) Forecast by Application, 2019 to 2034

Table 57: Middle East and Africa Market Value (US$ Million) Forecast by Country, 2019 to 2034

Table 58: Middle East and Africa Market Volume (Units) Forecast by Country, 2019 to 2034

Table 59: Middle East and Africa Market Value (US$ Million) Forecast by Scale, 2019 to 2034

Table 60: Middle East and Africa Market Volume (Units) Forecast by Scale, 2019 to 2034

Table 61: Middle East and Africa Market Value (US$ Million) Forecast by Class, 2019 to 2034

Table 62: Middle East and Africa Market Volume (Units) Forecast by Class, 2019 to 2034

Table 63: Middle East and Africa Market Value (US$ Million) Forecast by Application, 2019 to 2034

Table 64: Middle East and Africa Market Volume (Units) Forecast by Application, 2019 to 2034
Sudip Saha
Sudip Saha

Principal Consultant

Talk to Analyst

Find your sweet spots for generating winning opportunities in this market.

List of Charts

Figure 1: Global Market Value (US$ Million) by Scale, 2024 to 2034

Figure 2: Global Market Value (US$ Million) by Class, 2024 to 2034

Figure 3: Global Market Value (US$ Million) by Application, 2024 to 2034

Figure 4: Global Market Value (US$ Million) by Region, 2024 to 2034

Figure 5: Global Market Value (US$ Million) Analysis by Region, 2019 to 2034

Figure 6: Global Market Volume (Units) Analysis by Region, 2019 to 2034

Figure 7: Global Market Value Share (%) and BPS Analysis by Region, 2024 to 2034

Figure 8: Global Market Y-o-Y Growth (%) Projections by Region, 2024 to 2034

Figure 9: Global Market Value (US$ Million) Analysis by Scale, 2019 to 2034

Figure 10: Global Market Volume (Units) Analysis by Scale, 2019 to 2034

Figure 11: Global Market Value Share (%) and BPS Analysis by Scale, 2024 to 2034

Figure 12: Global Market Y-o-Y Growth (%) Projections by Scale, 2024 to 2034

Figure 13: Global Market Value (US$ Million) Analysis by Class, 2019 to 2034

Figure 14: Global Market Volume (Units) Analysis by Class, 2019 to 2034

Figure 15: Global Market Value Share (%) and BPS Analysis by Class, 2024 to 2034

Figure 16: Global Market Y-o-Y Growth (%) Projections by Class, 2024 to 2034

Figure 17: Global Market Value (US$ Million) Analysis by Application, 2019 to 2034

Figure 18: Global Market Volume (Units) Analysis by Application, 2019 to 2034

Figure 19: Global Market Value Share (%) and BPS Analysis by Application, 2024 to 2034

Figure 20: Global Market Y-o-Y Growth (%) Projections by Application, 2024 to 2034

Figure 21: Global Market Attractiveness by Scale, 2024 to 2034

Figure 22: Global Market Attractiveness by Class, 2024 to 2034

Figure 23: Global Market Attractiveness by Application, 2024 to 2034

Figure 24: Global Market Attractiveness by Region, 2024 to 2034

Figure 25: North America Market Value (US$ Million) by Scale, 2024 to 2034

Figure 26: North America Market Value (US$ Million) by Class, 2024 to 2034

Figure 27: North America Market Value (US$ Million) by Application, 2024 to 2034

Figure 28: North America Market Value (US$ Million) by Country, 2024 to 2034

Figure 29: North America Market Value (US$ Million) Analysis by Country, 2019 to 2034

Figure 30: North America Market Volume (Units) Analysis by Country, 2019 to 2034

Figure 31: North America Market Value Share (%) and BPS Analysis by Country, 2024 to 2034

Figure 32: North America Market Y-o-Y Growth (%) Projections by Country, 2024 to 2034

Figure 33: North America Market Value (US$ Million) Analysis by Scale, 2019 to 2034

Figure 34: North America Market Volume (Units) Analysis by Scale, 2019 to 2034

Figure 35: North America Market Value Share (%) and BPS Analysis by Scale, 2024 to 2034

Figure 36: North America Market Y-o-Y Growth (%) Projections by Scale, 2024 to 2034

Figure 37: North America Market Value (US$ Million) Analysis by Class, 2019 to 2034

Figure 38: North America Market Volume (Units) Analysis by Class, 2019 to 2034

Figure 39: North America Market Value Share (%) and BPS Analysis by Class, 2024 to 2034

Figure 40: North America Market Y-o-Y Growth (%) Projections by Class, 2024 to 2034

Figure 41: North America Market Value (US$ Million) Analysis by Application, 2019 to 2034

Figure 42: North America Market Volume (Units) Analysis by Application, 2019 to 2034

Figure 43: North America Market Value Share (%) and BPS Analysis by Application, 2024 to 2034

Figure 44: North America Market Y-o-Y Growth (%) Projections by Application, 2024 to 2034

Figure 45: North America Market Attractiveness by Scale, 2024 to 2034

Figure 46: North America Market Attractiveness by Class, 2024 to 2034

Figure 47: North America Market Attractiveness by Application, 2024 to 2034

Figure 48: North America Market Attractiveness by Country, 2024 to 2034

Figure 49: Latin America Market Value (US$ Million) by Scale, 2024 to 2034

Figure 50: Latin America Market Value (US$ Million) by Class, 2024 to 2034

Figure 51: Latin America Market Value (US$ Million) by Application, 2024 to 2034

Figure 52: Latin America Market Value (US$ Million) by Country, 2024 to 2034

Figure 53: Latin America Market Value (US$ Million) Analysis by Country, 2019 to 2034

Figure 54: Latin America Market Volume (Units) Analysis by Country, 2019 to 2034

Figure 55: Latin America Market Value Share (%) and BPS Analysis by Country, 2024 to 2034

Figure 56: Latin America Market Y-o-Y Growth (%) Projections by Country, 2024 to 2034

Figure 57: Latin America Market Value (US$ Million) Analysis by Scale, 2019 to 2034

Figure 58: Latin America Market Volume (Units) Analysis by Scale, 2019 to 2034

Figure 59: Latin America Market Value Share (%) and BPS Analysis by Scale, 2024 to 2034

Figure 60: Latin America Market Y-o-Y Growth (%) Projections by Scale, 2024 to 2034

Figure 61: Latin America Market Value (US$ Million) Analysis by Class, 2019 to 2034

Figure 62: Latin America Market Volume (Units) Analysis by Class, 2019 to 2034

Figure 63: Latin America Market Value Share (%) and BPS Analysis by Class, 2024 to 2034

Figure 64: Latin America Market Y-o-Y Growth (%) Projections by Class, 2024 to 2034

Figure 65: Latin America Market Value (US$ Million) Analysis by Application, 2019 to 2034

Figure 66: Latin America Market Volume (Units) Analysis by Application, 2019 to 2034

Figure 67: Latin America Market Value Share (%) and BPS Analysis by Application, 2024 to 2034

Figure 68: Latin America Market Y-o-Y Growth (%) Projections by Application, 2024 to 2034

Figure 69: Latin America Market Attractiveness by Scale, 2024 to 2034

Figure 70: Latin America Market Attractiveness by Class, 2024 to 2034

Figure 71: Latin America Market Attractiveness by Application, 2024 to 2034

Figure 72: Latin America Market Attractiveness by Country, 2024 to 2034

Figure 73: Western Europe Market Value (US$ Million) by Scale, 2024 to 2034

Figure 74: Western Europe Market Value (US$ Million) by Class, 2024 to 2034

Figure 75: Western Europe Market Value (US$ Million) by Application, 2024 to 2034

Figure 76: Western Europe Market Value (US$ Million) by Country, 2024 to 2034

Figure 77: Western Europe Market Value (US$ Million) Analysis by Country, 2019 to 2034

Figure 78: Western Europe Market Volume (Units) Analysis by Country, 2019 to 2034

Figure 79: Western Europe Market Value Share (%) and BPS Analysis by Country, 2024 to 2034

Figure 80: Western Europe Market Y-o-Y Growth (%) Projections by Country, 2024 to 2034

Figure 81: Western Europe Market Value (US$ Million) Analysis by Scale, 2019 to 2034

Figure 82: Western Europe Market Volume (Units) Analysis by Scale, 2019 to 2034

Figure 83: Western Europe Market Value Share (%) and BPS Analysis by Scale, 2024 to 2034

Figure 84: Western Europe Market Y-o-Y Growth (%) Projections by Scale, 2024 to 2034

Figure 85: Western Europe Market Value (US$ Million) Analysis by Class, 2019 to 2034

Figure 86: Western Europe Market Volume (Units) Analysis by Class, 2019 to 2034

Figure 87: Western Europe Market Value Share (%) and BPS Analysis by Class, 2024 to 2034

Figure 88: Western Europe Market Y-o-Y Growth (%) Projections by Class, 2024 to 2034

Figure 89: Western Europe Market Value (US$ Million) Analysis by Application, 2019 to 2034

Figure 90: Western Europe Market Volume (Units) Analysis by Application, 2019 to 2034

Figure 91: Western Europe Market Value Share (%) and BPS Analysis by Application, 2024 to 2034

Figure 92: Western Europe Market Y-o-Y Growth (%) Projections by Application, 2024 to 2034

Figure 93: Western Europe Market Attractiveness by Scale, 2024 to 2034

Figure 94: Western Europe Market Attractiveness by Class, 2024 to 2034

Figure 95: Western Europe Market Attractiveness by Application, 2024 to 2034

Figure 96: Western Europe Market Attractiveness by Country, 2024 to 2034

Figure 97: Eastern Europe Market Value (US$ Million) by Scale, 2024 to 2034

Figure 98: Eastern Europe Market Value (US$ Million) by Class, 2024 to 2034

Figure 99: Eastern Europe Market Value (US$ Million) by Application, 2024 to 2034

Figure 100: Eastern Europe Market Value (US$ Million) by Country, 2024 to 2034

Figure 101: Eastern Europe Market Value (US$ Million) Analysis by Country, 2019 to 2034

Figure 102: Eastern Europe Market Volume (Units) Analysis by Country, 2019 to 2034

Figure 103: Eastern Europe Market Value Share (%) and BPS Analysis by Country, 2024 to 2034

Figure 104: Eastern Europe Market Y-o-Y Growth (%) Projections by Country, 2024 to 2034

Figure 105: Eastern Europe Market Value (US$ Million) Analysis by Scale, 2019 to 2034

Figure 106: Eastern Europe Market Volume (Units) Analysis by Scale, 2019 to 2034

Figure 107: Eastern Europe Market Value Share (%) and BPS Analysis by Scale, 2024 to 2034

Figure 108: Eastern Europe Market Y-o-Y Growth (%) Projections by Scale, 2024 to 2034

Figure 109: Eastern Europe Market Value (US$ Million) Analysis by Class, 2019 to 2034

Figure 110: Eastern Europe Market Volume (Units) Analysis by Class, 2019 to 2034

Figure 111: Eastern Europe Market Value Share (%) and BPS Analysis by Class, 2024 to 2034

Figure 112: Eastern Europe Market Y-o-Y Growth (%) Projections by Class, 2024 to 2034

Figure 113: Eastern Europe Market Value (US$ Million) Analysis by Application, 2019 to 2034

Figure 114: Eastern Europe Market Volume (Units) Analysis by Application, 2019 to 2034

Figure 115: Eastern Europe Market Value Share (%) and BPS Analysis by Application, 2024 to 2034

Figure 116: Eastern Europe Market Y-o-Y Growth (%) Projections by Application, 2024 to 2034

Figure 117: Eastern Europe Market Attractiveness by Scale, 2024 to 2034

Figure 118: Eastern Europe Market Attractiveness by Class, 2024 to 2034

Figure 119: Eastern Europe Market Attractiveness by Application, 2024 to 2034

Figure 120: Eastern Europe Market Attractiveness by Country, 2024 to 2034

Figure 121: South Asia and Pacific Market Value (US$ Million) by Scale, 2024 to 2034

Figure 122: South Asia and Pacific Market Value (US$ Million) by Class, 2024 to 2034

Figure 123: South Asia and Pacific Market Value (US$ Million) by Application, 2024 to 2034

Figure 124: South Asia and Pacific Market Value (US$ Million) by Country, 2024 to 2034

Figure 125: South Asia and Pacific Market Value (US$ Million) Analysis by Country, 2019 to 2034

Figure 126: South Asia and Pacific Market Volume (Units) Analysis by Country, 2019 to 2034

Figure 127: South Asia and Pacific Market Value Share (%) and BPS Analysis by Country, 2024 to 2034

Figure 128: South Asia and Pacific Market Y-o-Y Growth (%) Projections by Country, 2024 to 2034

Figure 129: South Asia and Pacific Market Value (US$ Million) Analysis by Scale, 2019 to 2034

Figure 130: South Asia and Pacific Market Volume (Units) Analysis by Scale, 2019 to 2034

Figure 131: South Asia and Pacific Market Value Share (%) and BPS Analysis by Scale, 2024 to 2034

Figure 132: South Asia and Pacific Market Y-o-Y Growth (%) Projections by Scale, 2024 to 2034

Figure 133: South Asia and Pacific Market Value (US$ Million) Analysis by Class, 2019 to 2034

Figure 134: South Asia and Pacific Market Volume (Units) Analysis by Class, 2019 to 2034

Figure 135: South Asia and Pacific Market Value Share (%) and BPS Analysis by Class, 2024 to 2034

Figure 136: South Asia and Pacific Market Y-o-Y Growth (%) Projections by Class, 2024 to 2034

Figure 137: South Asia and Pacific Market Value (US$ Million) Analysis by Application, 2019 to 2034

Figure 138: South Asia and Pacific Market Volume (Units) Analysis by Application, 2019 to 2034

Figure 139: South Asia and Pacific Market Value Share (%) and BPS Analysis by Application, 2024 to 2034

Figure 140: South Asia and Pacific Market Y-o-Y Growth (%) Projections by Application, 2024 to 2034

Figure 141: South Asia and Pacific Market Attractiveness by Scale, 2024 to 2034

Figure 142: South Asia and Pacific Market Attractiveness by Class, 2024 to 2034

Figure 143: South Asia and Pacific Market Attractiveness by Application, 2024 to 2034

Figure 144: South Asia and Pacific Market Attractiveness by Country, 2024 to 2034

Figure 145: East Asia Market Value (US$ Million) by Scale, 2024 to 2034

Figure 146: East Asia Market Value (US$ Million) by Class, 2024 to 2034

Figure 147: East Asia Market Value (US$ Million) by Application, 2024 to 2034

Figure 148: East Asia Market Value (US$ Million) by Country, 2024 to 2034

Figure 149: East Asia Market Value (US$ Million) Analysis by Country, 2019 to 2034

Figure 150: East Asia Market Volume (Units) Analysis by Country, 2019 to 2034

Figure 151: East Asia Market Value Share (%) and BPS Analysis by Country, 2024 to 2034

Figure 152: East Asia Market Y-o-Y Growth (%) Projections by Country, 2024 to 2034

Figure 153: East Asia Market Value (US$ Million) Analysis by Scale, 2019 to 2034

Figure 154: East Asia Market Volume (Units) Analysis by Scale, 2019 to 2034

Figure 155: East Asia Market Value Share (%) and BPS Analysis by Scale, 2024 to 2034

Figure 156: East Asia Market Y-o-Y Growth (%) Projections by Scale, 2024 to 2034

Figure 157: East Asia Market Value (US$ Million) Analysis by Class, 2019 to 2034

Figure 158: East Asia Market Volume (Units) Analysis by Class, 2019 to 2034

Figure 159: East Asia Market Value Share (%) and BPS Analysis by Class, 2024 to 2034

Figure 160: East Asia Market Y-o-Y Growth (%) Projections by Class, 2024 to 2034

Figure 161: East Asia Market Value (US$ Million) Analysis by Application, 2019 to 2034

Figure 162: East Asia Market Volume (Units) Analysis by Application, 2019 to 2034

Figure 163: East Asia Market Value Share (%) and BPS Analysis by Application, 2024 to 2034

Figure 164: East Asia Market Y-o-Y Growth (%) Projections by Application, 2024 to 2034

Figure 165: East Asia Market Attractiveness by Scale, 2024 to 2034

Figure 166: East Asia Market Attractiveness by Class, 2024 to 2034

Figure 167: East Asia Market Attractiveness by Application, 2024 to 2034

Figure 168: East Asia Market Attractiveness by Country, 2024 to 2034

Figure 169: Middle East and Africa Market Value (US$ Million) by Scale, 2024 to 2034

Figure 170: Middle East and Africa Market Value (US$ Million) by Class, 2024 to 2034

Figure 171: Middle East and Africa Market Value (US$ Million) by Application, 2024 to 2034

Figure 172: Middle East and Africa Market Value (US$ Million) by Country, 2024 to 2034

Figure 173: Middle East and Africa Market Value (US$ Million) Analysis by Country, 2019 to 2034

Figure 174: Middle East and Africa Market Volume (Units) Analysis by Country, 2019 to 2034

Figure 175: Middle East and Africa Market Value Share (%) and BPS Analysis by Country, 2024 to 2034

Figure 176: Middle East and Africa Market Y-o-Y Growth (%) Projections by Country, 2024 to 2034

Figure 177: Middle East and Africa Market Value (US$ Million) Analysis by Scale, 2019 to 2034

Figure 178: Middle East and Africa Market Volume (Units) Analysis by Scale, 2019 to 2034

Figure 179: Middle East and Africa Market Value Share (%) and BPS Analysis by Scale, 2024 to 2034

Figure 180: Middle East and Africa Market Y-o-Y Growth (%) Projections by Scale, 2024 to 2034

Figure 181: Middle East and Africa Market Value (US$ Million) Analysis by Class, 2019 to 2034

Figure 182: Middle East and Africa Market Volume (Units) Analysis by Class, 2019 to 2034

Figure 183: Middle East and Africa Market Value Share (%) and BPS Analysis by Class, 2024 to 2034

Figure 184: Middle East and Africa Market Y-o-Y Growth (%) Projections by Class, 2024 to 2034

Figure 185: Middle East and Africa Market Value (US$ Million) Analysis by Application, 2019 to 2034

Figure 186: Middle East and Africa Market Volume (Units) Analysis by Application, 2019 to 2034

Figure 187: Middle East and Africa Market Value Share (%) and BPS Analysis by Application, 2024 to 2034

Figure 188: Middle East and Africa Market Y-o-Y Growth (%) Projections by Application, 2024 to 2034

Figure 189: Middle East and Africa Market Attractiveness by Scale, 2024 to 2034

Figure 190: Middle East and Africa Market Attractiveness by Class, 2024 to 2034

Figure 191: Middle East and Africa Market Attractiveness by Application, 2024 to 2034

Figure 192: Middle East and Africa Market Attractiveness by Country, 2024 to 2034

Recommendations

Healthcare

Digital Scale Market

Published : November 2023

Packaging

Linear Net Weighing Machines Market

Published : July 2022

Explore Technology Insights

View Reports

Electronic Weighing Scale Market