Electronic Grade Trisilylamine Market Forecast and Outlook (2025-2035)

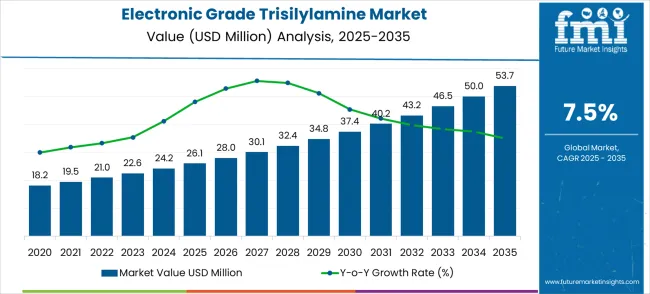
The electronic grade trisilylamine market begins its decade journey from a USD 26.1 million foundation in 2025, setting the stage for steady expansion ahead. The first half of the decade witnesses consistent momentum building, with market value climbing from USD 28.0 million in 2026 to USD 40.2 million by 2030. This initial phase reflects growing semiconductor manufacturing capacity and increasing advanced node production requirements across global foundries.

The latter half will witness growth dynamics, propelling the market from USD 43.2 million in 2031 to reach USD 53.7 million by 2035. Dollar additions during 2030-2035 maintain steady progression, with annual increments averaging USD 2.7 million compared to USD 2.8 million in the first phase. This progression represents a 105.7% total value increase over the forecast decade.

Market maturation factors include expanding semiconductor fab construction, advanced packaging technology adoption, and next-generation device manufacturing requirements. The 7.5% compound annual growth rate positions participants to capitalize on USD 27.6 million in additional market value creation. This trajectory signals robust opportunities for specialty chemical manufacturers, semiconductor material suppliers, and advanced process technology providers across the global electronics manufacturing landscape.
Quick Stats for Electronic Grade Trisilylamine Market

  • Electronic Grade Trisilylamine Market Value (2025): USD 26.1 million
  • Electronic Grade Trisilylamine Market Forecast Value (2035): USD 53.7 million
  • Electronic Grade Trisilylamine Market Forecast CAGR: 7.5%
  • Leading Purity Grade: Purity ≥99.9% (58.3%)
  • Key Growth Regions: Asia Pacific, Europe, and North America
  • Top Key Players: Air Liquide, Hansol Chemical, Dockweiler Chemicals, Jiangsu Nata Opto-electronic Material, APK (Shanghai) Gas, China Silicon Corporation

Electronic Grade Trisilylamine Market Market Value Analysis

Electronic Grade Trisilylamine Market Year-over-Year Forecast (2025-2035)

Market expansion unfolds through two distinct growth periods with different technological characteristics for each phase. The 2025-2030 foundation period delivers USD 14.1 million in value additions, representing 54% growth from the baseline. Market dynamics during this phase center on advanced semiconductor node development, CVD process optimization, and purity standard enhancement across manufacturing applications.

The 2030-2035 maturation period generates USD 13.5 million in incremental value, reflecting 33.6% growth from the 2030 position. This phase exhibits mature market characteristics with enhanced competition, advanced process integration strategies, and geographic manufacturing expansion initiatives. Dollar contributions shift from foundational capacity building to advanced technology node requirements and specialized application development.

Competitive landscape evolution progresses from specialty chemical supply to integrated semiconductor material solutions. The first period emphasizes purity advancement and process validation. The second period witnesses intensified competition for premium application segments and comprehensive solution development across CVD, ALD, and emerging semiconductor manufacturing processes.

Electronic Grade Trisilylamine Market Key Takeaways

Metric Value
Market Value (2025)  USD 26.1 million
Market Forecast (2035)  USD 53.7 million
Growth Rate  7.5% CAGR
Leading Segment  Purity ≥99.9%
Primary Application CVD

Why is the Electronic Grade Trisilylamine Market Growing?

Market expansion rests on four fundamental shifts driving semiconductor manufacturing material demand acceleration:

  • Advanced Semiconductor Node Development: Global semiconductor industry progression toward smaller process nodes creates demand for ultra-pure trisilylamine essential for silicon nitride deposition in advanced gate structures and interconnect applications. Sub-5nm technology nodes require exceptional material purity to prevent contamination affecting device performance and yield. Electronic grade trisilylamine enables precise stoichiometric control in chemical vapor deposition processes critical for advanced semiconductor manufacturing.
  • CVD and ALD Process Technology Advancement: Chemical Vapor Deposition and Atomic Layer Deposition technologies increasingly utilize trisilylamine for conformal silicon nitride film formation in three-dimensional device structures. Advanced packaging applications require precise material delivery for through-silicon via filling and barrier layer formation. High-aspect-ratio feature filling capabilities make trisilylamine essential for advanced memory and logic device manufacturing processes.
  • Semiconductor Manufacturing Capacity Expansion: Global foundry capacity expansion across Asia Pacific, Europe, and North America creates demand for specialized precursor materials, including electronic grade trisilylamine. New fab construction incorporates advanced process technologies requiring ultra-pure materials for consistent device performance. Manufacturing localization initiatives drive regional supply chain development for critical semiconductor materials.
  • Quality and Purity Requirements Enhancement: Advanced semiconductor devices demand exceptional material purity to achieve acceptable defect densities and electrical performance characteristics. Contamination control requirements necessitate ultra-pure trisilylamine grades exceeding 99.9% purity for critical applications. Process repeatability and yield optimization require consistent material quality across multiple production lots and supply sources.

The growth faces headwinds from complex synthesis requirements and stringent quality control standards increasing production costs. Limited supplier base creates supply chain concentration risks affecting material availability. Environmental and safety regulations require specialized handling and disposal procedures increasing operational complexity.

Global Electronic Grade Trisilylamine Market - Stakeholder Contribution Framework

The electronic grade trisilylamine market is central to semiconductor manufacturing advancement, advanced node development, device performance, and technological sovereignty. With rapid semiconductor scaling, stringent purity requirements, and geopolitical supply chain concerns, the sector faces pressure to balance ultra-high quality, supply security, and cost competitiveness. Coordinated action from governments, industry bodies, OEMs/technology players, suppliers, and investors is essential to transition toward domestically secure, technologically advanced, and ultra-pure electronic material systems.

How Governments Could Spur Domestic Production and Supply Security?

  • Strategic Material Incentives: Provide manufacturing subsidies for domestic ultra-pure chemical production, especially for critical semiconductor precursors, and incentivize facilities using advanced purification technologies.
  • R&D Investment: Fund programs on next-generation purification methods, contamination control systems, and alternative synthesis pathways for reduced environmental impact.
  • Quality Standards: Establish stringent purity specifications and analytical testing requirements to prevent substandard materials from compromising semiconductor manufacturing yield.
  • Supply Chain Security: Facilitate domestic production capabilities for critical semiconductor materials, reducing import dependency from concentrated supplier regions.
  • Technology Export Controls: Implement strategic export policies protecting advanced purification technologies while enabling legitimate international semiconductor collaboration.

How Industry Bodies Could Support Market Development?

  • Technical Standardization: Develop harmonized international guidelines on purity specifications, analytical testing methods, and contamination control protocols.
  • Certification Programs: Establish quality assurance frameworks ensuring material reliability and performance consistency across global semiconductor manufacturing operations.
  • Professional Development: Deliver specialized curricula on ultra-pure chemical handling, contamination prevention, and advanced analytical techniques for industry professionals.
  • Regulatory Advocacy: Represent stakeholders in discussions on environmental regulations, safety standards, and international trade policies affecting semiconductor materials.

How OEMs and Technology Players Could Strengthen the Ecosystem?

  • Process Integration: Bundle trisilylamine supply with advanced delivery systems, real-time purity monitoring, and predictive consumption analytics for optimized semiconductor manufacturing.
  • Strategic Partnerships: Collaborate with chemical suppliers to develop customized formulations tailored to specific process nodes, device architectures, and manufacturing requirements.
  • Application Innovation: Invest in next-generation deposition techniques, advanced CVD/ALD processes, and emerging semiconductor technologies requiring specialized precursor materials.
  • Equipment Solutions: Provide integrated chemical management systems enabling precise material handling, storage, and delivery for contamination-free semiconductor processing.

How Suppliers Could Navigate Technology Evolution?

  • Purification Excellence: Advance ultra-high purification technologies using distillation, crystallization, and advanced separation methods to achieve semiconductor-grade material specifications.
  • Application Specialization: Expand from standard chemical supply to specialized semiconductor applications (advanced nodes, emerging devices, quantum computing materials).
  • Quality Systems: Strengthen analytical capabilities and traceability systems to provide comprehensive material characterization and batch-to-batch consistency documentation.
  • Technical Support: Deploy specialized engineering teams to provide process optimization, troubleshooting assistance, and application development support for semiconductor customers.

How Investors and Financial Enablers Could Unlock Value?

  • Manufacturing Infrastructure: Support advanced purification facility construction, analytical laboratory development, and specialized handling equipment in strategic geographic locations.
  • Technology Ventures: Fund startups developing breakthrough purification technologies, alternative synthesis methods, and next-generation semiconductor material solutions.
  • Strategic Consolidation: Structure M&A opportunities combining complementary purification capabilities and creating integrated specialty chemical suppliers with global reach.
  • Supply Security Finance: Create specialized funding mechanisms for domestic semiconductor material production, reducing geopolitical supply chain vulnerabilities and ensuring manufacturing continuity.

Segmental Analysis

Primary Classification: Purity Grade Distribution

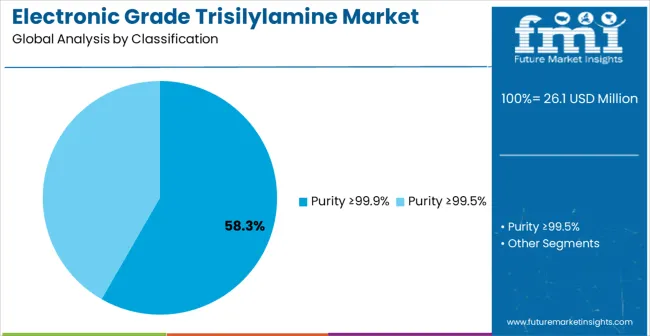
  • Purity ≥99.9% (58.3% market dominance)
  • Purity ≥99.5% (41.7% market participation)

Secondary Breakdown: Application Categories

  • CVD (61.2% application share)
  • ALD (38.8% targeted segment)

Geographic Segmentation: Regional Market Distribution
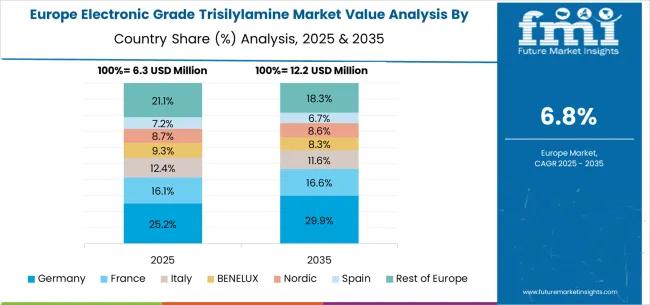
  • Asia Pacific (China leads with 10.1% CAGR, India 9.4% CAGR)
  • Europe (Germany 8.6% CAGR, UK 6.4% CAGR)
  • North America (USA represents 7.1% CAGR market growth)
  • Latin America (Brazil contributes 7.9% CAGR market expansion)

By Purity Grade, Purity ≥99.9% Segment Accounts for 58.3% Market Share

Electronic Grade Trisilylamine Market Analysis By Classification

Market Position: Ultra-high purity trisilylamine (≥99.9%) establishes clear market leadership through exceptional contamination control required for advanced semiconductor manufacturing processes. Critical applications including leading-edge logic and memory device production demand the highest material purity to achieve acceptable defect densities. Advanced process nodes below 10nm require ultra-pure precursors to prevent yield-limiting contamination during device fabrication.

Value Drivers: Advanced purification technologies enable consistent impurity control below critical threshold levels affecting device performance and manufacturing yield. Specialized packaging and handling systems maintain material purity throughout supply chain delivery to semiconductor fabs. Quality assurance protocols including comprehensive analytical testing ensure batch-to-batch consistency for critical manufacturing applications.

Competitive Advantages: Ultra-high purity grades offer superior performance in contamination-sensitive applications compared to lower purity alternatives requiring additional purification steps. Process optimization benefits include reduced equipment cleaning requirements and extended process chamber lifetime. Premium applications justify higher material costs through improved device yield and performance characteristics.

Market Challenges: Complex purification requirements increase production costs and technical complexity compared to standard purity grades. Specialized analytical testing and quality control procedures require significant investment in equipment and expertise. Limited production capacity for ultra-pure grades creates supply constraints during peak demand periods.
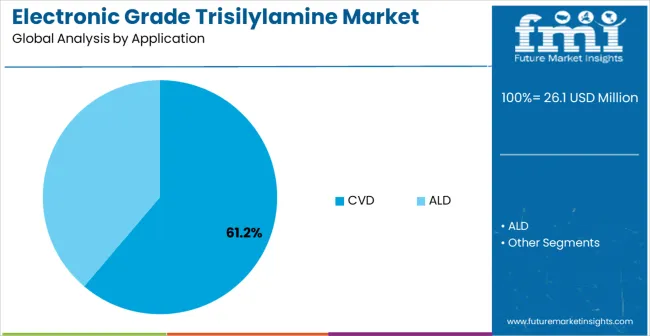
By Application, CVD Segment Accounts for 61.2% Market Share

Electronic Grade Trisilylamine Market Analysis By Application

Strategic Market Importance: Chemical Vapor Deposition represents the primary demand driver for electronic grade trisilylamine across semiconductor manufacturing processes. Silicon nitride film deposition for gate dielectrics, spacer formation, and etch stop layers requires precise precursor control achievable through trisilylamine chemistry. Advanced device architectures including FinFET and gate-all-around structures utilize CVD processes for conformal film formation in high-aspect-ratio features.

Market Dynamics Q&A:

  • Why dominant? CVD processes enable precise stoichiometric control and conformal film formation essential for advanced semiconductor device manufacturing applications.
  • What drives adoption? Advanced node scaling requires superior material properties achievable through CVD deposition using specialized precursors including trisilylamine.
  • Where is growth? Logic and memory device manufacturing expansion creates increasing demand for CVD processes utilizing trisilylamine across multiple device layers.

Business Logic: Semiconductor manufacturers prioritize process control and device performance, making advanced precursor materials essential for competitive technology development. Material consistency reduces process variation while improving manufacturing yield and device reliability. Investment justification occurs through enhanced device performance and reduced manufacturing costs over product lifecycle.

Forward-looking Implications: Emerging device architectures including chiplet designs and advanced packaging create additional CVD applications requiring specialized precursor materials. Quantum computing and neuromorphic device development may create new application opportunities for ultra-pure trisilylamine. Process technology advancement toward atomic-scale manufacturing increases precision requirements for precursor materials.

What are the Drivers, Restraints, and Key Trends of the Electronic Grade Trisilylamine Market?

Growth Accelerators

Semiconductor industry expansion drives increasing demand for specialized precursor materials supporting advanced device manufacturing processes. Technology node scaling requires ultra-pure materials enabling contamination-free processing essential for acceptable device yield. Fab capacity expansion across global regions creates demand for critical semiconductor materials including electronic grade trisilylamine. Advanced packaging technology adoption necessitates specialized materials for three-dimensional device integration and interconnect formation.

Growth Inhibitors

High production costs associated with ultra-pure material synthesis create price pressure affecting adoption in cost-sensitive applications. Limited supplier base concentrates supply chain risks and potential availability constraints during peak demand periods. Complex quality control requirements necessitate significant investment in analytical equipment and specialized expertise. Environmental and safety regulations require specialized handling procedures increasing operational complexity and costs.

Market Evolution Patterns

Advanced purification technologies enable higher purity grades meeting increasingly stringent semiconductor manufacturing requirements. Process optimization reduces material consumption while maintaining deposition quality and device performance characteristics. Supply chain localization creates regional production capabilities reducing logistics costs and supply chain risks. Digital quality monitoring systems enable real-time process control and predictive maintenance optimization.

Analysis of Electronic Grade Trisilylamine Market by Key Country

Global market dynamics reveal distinct performance tiers reflecting regional semiconductor manufacturing capacity and technology development priorities. High-Growth Markets including China (10.1% CAGR) and India (9.4% CAGR) demonstrate aggressive semiconductor capacity expansion with comprehensive material supply chain development. Technology Leaders such as Germany (8.6% CAGR) represent European precision chemical manufacturing excellence with advanced purification capabilities. Steady Performers including Brazil (7.9% CAGR) and the United States (7.1% CAGR) show consistent growth aligned with semiconductor manufacturing expansion and technology advancement. Mature Markets including the United Kingdom (6.4% CAGR) and Japan (5.6% CAGR) display moderate growth rates reflecting established manufacturing infrastructure with a specialty chemical focus.

China Market Leadership Profile

China establishes market leadership through massive semiconductor manufacturing capacity expansion and comprehensive supply chain localization initiatives. The 10.1% CAGR reflects unprecedented foundry capacity development supporting domestic semiconductor industry growth and technology independence objectives. Government investment in advanced semiconductor manufacturing creates demand for specialized precursor materials including electronic grade trisilylamine.

Market dynamics center on:

  • Semiconductor fab construction exceeding USD 100 billion investment requiring comprehensive material supply chains
  • Domestic supply chain localization reducing import dependency for critical semiconductor materials
  • Advanced node technology development creating demand for ultra-pure precursor materials and process chemicals

Strategic Market Indicators:

  • Semiconductor manufacturing capacity expansion targets exceed 50% growth requiring specialized material supply
  • Government initiatives promote domestic semiconductor material production reducing import dependency and supply chain risks
  • Technology transfer partnerships bring international expertise to domestic specialty chemical manufacturing development

India Growth Story Analysis

India demonstrates robust growth potential through expanding semiconductor manufacturing ecosystem development and government promotion of domestic electronics production initiatives. The 9.4% CAGR reflects increasing semiconductor assembly and testing capacity with growing demand for specialized materials. Manufacturing expansion under government incentive programs creates opportunities for semiconductor material supply chain development.

Market Intelligence Brief:
  • Semiconductor assembly and testing capacity expansion exceeding 25% annually creating material demand growth
  • Government Production Linked Incentive schemes promote domestic semiconductor manufacturing requiring material supply chains
  • Foreign investment in semiconductor operations introduces advanced material requirements and quality standards

Germany Precision Chemical Excellence

Electronic Grade Trisilylamine Market Europe Country Market Share Analysis, 2025 & 2035

Germany maintains technology leadership through precision chemical manufacturing excellence and comprehensive semiconductor material development capabilities. The 8.6% CAGR reflects established chemical industry expertise with continuous advancement in purification technologies and quality control systems. Automotive and industrial semiconductor demand creates consistent requirements for high-performance electronic materials.

Performance Metrics:

  • Chemical industry exports exceed EUR 180 billion annually including specialized semiconductor materials
  • Research and development investment in advanced purification technologies leads to global innovation development
  • Quality standard development influences international semiconductor material specifications and testing procedures

Brazil Emerging Market Development

Brazil represents emerging market growth potential with a 7.9% CAGR through expanding electronics manufacturing and government initiatives supporting domestic semiconductor ecosystem development. The market demonstrates increasing sophistication in specialty chemical applications driven by industrial development programs and foreign investment in advanced manufacturing capabilities. Regional electronics production expansion creates opportunities for specialty chemical supply chain development supporting broader Latin American market requirements.

Electronics manufacturing growth drives primary demand for specialized chemical materials across automotive electronics, consumer devices, and industrial automation applications. Government industrialization initiatives promote domestic production capabilities through technology transfer partnerships and investment incentives for advanced manufacturing operations. Regional trade agreements facilitate market access for specialty chemicals while supporting integrated supply chain development across Latin American manufacturing networks.

Strategic Market Considerations:
  • Electronics manufacturing sector is contributing to an increasing GDP percentage with specialty chemical material requirements
  • Government industrial development programs promote domestic chemical production capacity and technology advancement initiatives
  • Foreign direct investment brings international quality standards and advanced material requirements to domestic manufacturing facilities

United States Technology Innovation Hub

Electronic Grade Trisilylamine Market Country Value Analysis

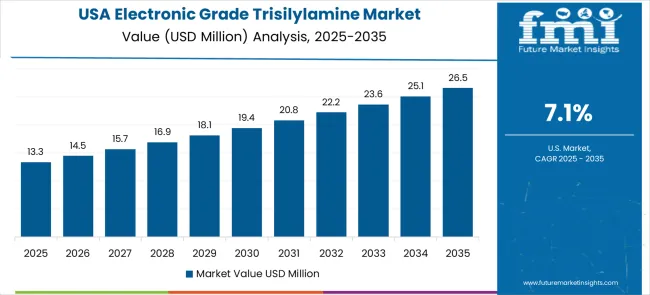
The United States demonstrates steady growth with a 7.1% CAGR through advanced semiconductor research and development initiatives coupled with domestic manufacturing reshoring programs. Silicon Valley innovation ecosystem combined with federal investment in semiconductor manufacturing, creates demand for ultra-pure specialty chemicals essential for next-generation device development. Academic research institutions and government funding programs drive continuous advancement in semiconductor material technologies.

Federal CHIPS Act investment exceeding USD 52 billion catalyzes comprehensive semiconductor manufacturing capacity development requiring sophisticated material supply chains including ultra-pure trisilylamine for advanced process applications. Manufacturing reshoring initiatives reduce supply chain dependencies while creating domestic demand for specialized precursor materials and process chemicals. Defense and aerospace applications require ultra-high purity materials for critical electronic systems and advanced technology platforms.

Market Development Focus:

  • Semiconductor manufacturing reshoring initiatives create domestic demand for specialized precursor materials and advanced process chemicals
  • Federal government investment programs drive advanced semiconductor manufacturing capacity requiring comprehensive ultra-pure material supply chains
  • Research and development leadership in quantum computing and neuromorphic technologies creates demand for innovative chemical solutions and specialized applications

United Kingdom Advanced Materials Innovation

The United Kingdom demonstrates focused growth with a 6.4% CAGR through specialty chemical innovation and advanced materials research excellence supported by world-class academic institutions and government innovation programs. Brexit-related industrial strategy initiatives promote domestic manufacturing capabilities while maintaining strong international research collaboration networks. Advanced materials research creates opportunities for next-generation semiconductor material development and specialized application optimization.

Academic research institutions including Cambridge and Oxford universities lead European development of advanced purification technologies and quality control systems for semiconductor applications. Government innovation funding supports specialty chemical development through Innovate UK programs and research council investments in advanced materials science. Aerospace and defense industries create a consistent demand for ultra-pure materials essential for critical electronic systems and specialized semiconductor devices.

Innovation Indicators:
  • Advanced materials research programs position UK leadership in next-generation semiconductor chemical development and purification technology advancement
  • Government innovation funding exceeds GBP 2 billion annually supporting specialty chemical development for emerging semiconductor and electronics applications
  • Academic-industry partnerships create comprehensive technology transfer opportunities for advanced purification methods and analytical techniques

Japan Precision Technology Excellence

Electronic Grade Trisilylamine Market Japan Market Share Analysis By Classification

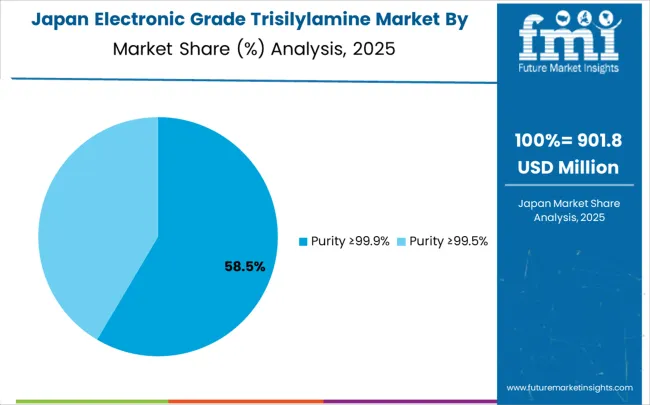
Japan maintains an established market position with a 5.6% CAGR through precision chemical manufacturing excellence and comprehensive semiconductor material technology development capabilities. Legacy semiconductor industry expertise combined with advanced materials research institutes creates consistent demand for ultra-pure specialty chemicals across multiple high-technology applications. Manufacturing precision culture drives continuous quality improvement and process optimization for specialty chemical production.

Semiconductor equipment manufacturing industry requires ultra-pure precursor materials for process validation, customer demonstrations, and technical support applications across global markets. Advanced materials research institutes, including RIKEN and the National Institute for Materials Science lead international development of next-generation purification technologies and analytical methods. Electronics manufacturing excellence spanning automotive, industrial, and consumer applications creates consistent demand for high-performance chemical materials.

Technology Leadership Aspects:
  • Semiconductor equipment exports exceed JPY 3 trillion annually, requiring a comprehensive ultra-pure material supply for manufacturing and customer support operations
  • Advanced materials research investment leads global development of innovative purification technologies and precision analytical methods for specialty chemicals
  • Quality management system expertise influences international semiconductor material standards and testing procedure development across global supply chains

Competitive Landscape of Electronic Grade Trisilylamine Market

Electronic Grade Trisilylamine Market Analysis By Company

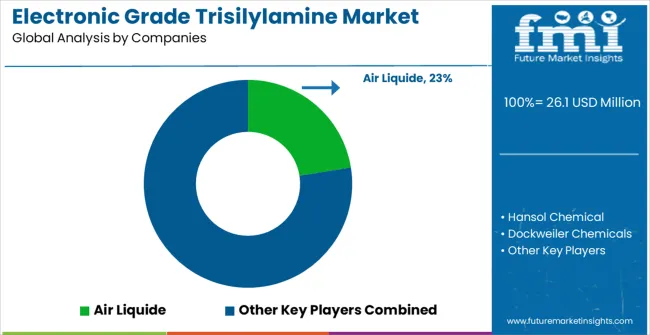
Market structure reflects high concentration with established specialty chemical manufacturers maintaining significant positions while regional suppliers serve specific geographic markets. Competition emphasizes technological innovation, quality assurance capabilities, and semiconductor industry partnership development. Industry dynamics favor companies combining advanced chemical synthesis expertise with comprehensive quality control systems and global supply chain presence.

Tier 1 - Global Specialty Chemical Leaders: Companies like Air Liquide dominate through comprehensive electronic material portfolios, global manufacturing networks, and extensive semiconductor industry relationships. Competitive advantages include proven quality systems, technical support capabilities, and integrated solution development spanning multiple semiconductor applications.

Tier 2 - Regional Chemical Providers: Organizations, including Hansol Chemical and Dockweiler Chemicals focus on specific geographic markets through specialized expertise and regional manufacturing capabilities. Competitive advantages include local market knowledge, flexible production capacity, and responsive technical support, enabling close customer relationships.

Tier 3 - Domestic Suppliers: Companies including Chinese manufacturers, serve local markets through cost-competitive solutions and specialized applications. Competitive advantages include regional supply chain advantages, flexible production scheduling, and partnership relationships with domestic semiconductor manufacturers and equipment suppliers.

Key Players in the Electronic Grade Trisilylamine Market

  • Air Liquide
  • Hansol Chemical
  • Dockweiler Chemicals
  • Jiangsu Nata Opto-electronic Material
  • APK (Shanghai) Gas
  • China Silicon Corporation
  • Huate Gas
  • Zhejiang Borui Electronic Technology
  • Anhui Argosun New Electronic Materials
  • Merck KGaA
  • Tokyo Chemical Industry (TCI)
  • Shin-Etsu Chemical
  • Gelest
  • Strem Chemicals
  • JSR Corporation
  • Umicore
  • BASF
  • DuPont

Scope of the Report

Item Value
Quantitative Units USD 53.7 million
Purity Grade Purity ≥99.5%, Purity ≥99.9%
Application CVD, ALD
Regions Covered North America, Latin America, Europe, East Asia, South Asia & Pacific, Middle East & Africa
Countries Covered United States, Canada, Mexico, Germany, United Kingdom, France, Italy, Spain, Nordic, BENELUX, China, Japan, South Korea, India, ASEAN, Australia, New Zealand, Brazil, Chile, Kingdom of Saudi Arabia, GCC Countries, Turkey, South Africa
Key Companies Profiled Air Liquide, Hansol Chemical, Dockweiler Chemicals, Jiangsu Nata Opto-electronic Material, APK (Shanghai) Gas, China Silicon Corporation, Huate Gas, Zhejiang Borui Electronic Technology
Additional Attributes Dollar sales by purity grade categories, regional demand trends across North America, Europe, and Asia-Pacific, competitive landscape analysis, adoption patterns across semiconductor sectors, integration with advanced manufacturing processes, purification technology innovations, and quality control standards

Electronic Grade Trisilylamine Market by Segments

Purity Grade:

  • Purity ≥99.5%
  • Purity ≥99.9%

Application:

  • CVD
  • ALD

Regions:

  • North America
    • United States
    • Canada
    • Mexico
  • Europe
    • Germany
    • United Kingdom
    • France
    • Italy
    • Spain
    • Nordic
    • BENELUX
    • Rest of Europe
  • East Asia
    • China
    • Japan
    • South Korea
  • South Asia & Pacific
    • India
    • ASEAN
    • Australia & New Zealand
    • Rest of South Asia & Pacific
  • Latin America
    • Brazil
    • Chile
    • Rest of Latin America
  • Middle East & Africa
    • Kingdom of Saudi Arabia
    • Other GCC Countries
    • Turkey
    • South Africa
    • Other African Union
    • Rest of Middle East & Africa

Table of Content

  1. Executive Summary
    • Global Market Outlook
    • Demand to side Trends
    • Supply to side Trends
    • Technology Roadmap Analysis
    • Analysis and Recommendations
  2. Market Overview
    • Market Coverage / Taxonomy
    • Market Definition / Scope / Limitations
  3. Market Background
    • Market Dynamics
      • Drivers
      • Restraints
      • Opportunity
      • Trends
    • Scenario Forecast
      • Demand in Optimistic Scenario
      • Demand in Likely Scenario
      • Demand in Conservative Scenario
    • Opportunity Map Analysis
    • Product Life Cycle Analysis
    • Supply Chain Analysis
    • Investment Feasibility Matrix
    • Value Chain Analysis
    • PESTLE and Porter’s Analysis
    • Regulatory Landscape
    • Regional Parent Market Outlook
    • Production and Consumption Statistics
    • Import and Export Statistics
  4. Global Market Analysis 2020 to 2024 and Forecast, 2025 to 2035
    • Historical Market Size Value (USD Million) Analysis, 2020 to 2024
    • Current and Future Market Size Value (USD Million) Projections, 2025 to 2035
      • Y to o to Y Growth Trend Analysis
      • Absolute $ Opportunity Analysis
  5. Global Market Pricing Analysis 2020 to 2024 and Forecast 2025 to 2035
  6. Global Market Analysis 2020 to 2024 and Forecast 2025 to 2035, By Classification
    • Introduction / Key Findings
    • Historical Market Size Value (USD Million) Analysis By Classification , 2020 to 2024
    • Current and Future Market Size Value (USD Million) Analysis and Forecast By Classification , 2025 to 2035
      • Purity ≥99.9%
      • Purity ≥99.5%
    • Y to o to Y Growth Trend Analysis By Classification , 2020 to 2024
    • Absolute $ Opportunity Analysis By Classification , 2025 to 2035
  7. Global Market Analysis 2020 to 2024 and Forecast 2025 to 2035, By Application
    • Introduction / Key Findings
    • Historical Market Size Value (USD Million) Analysis By Application, 2020 to 2024
    • Current and Future Market Size Value (USD Million) Analysis and Forecast By Application, 2025 to 2035
      • CVD
      • ALD
    • Y to o to Y Growth Trend Analysis By Application, 2020 to 2024
    • Absolute $ Opportunity Analysis By Application, 2025 to 2035
  8. Global Market Analysis 2020 to 2024 and Forecast 2025 to 2035, By Region
    • Introduction
    • Historical Market Size Value (USD Million) Analysis By Region, 2020 to 2024
    • Current Market Size Value (USD Million) Analysis and Forecast By Region, 2025 to 2035
      • North America
      • Latin America
      • Western Europe
      • Eastern Europe
      • East Asia
      • South Asia and Pacific
      • Middle East & Africa
    • Market Attractiveness Analysis By Region
  9. North America Market Analysis 2020 to 2024 and Forecast 2025 to 2035, By Country
    • Historical Market Size Value (USD Million) Trend Analysis By Market Taxonomy, 2020 to 2024
    • Market Size Value (USD Million) Forecast By Market Taxonomy, 2025 to 2035
      • By Country
        • USA
        • Canada
        • Mexico
      • By Classification
      • By Application
    • Market Attractiveness Analysis
      • By Country
      • By Classification
      • By Application
    • Key Takeaways
  10. Latin America Market Analysis 2020 to 2024 and Forecast 2025 to 2035, By Country
    • Historical Market Size Value (USD Million) Trend Analysis By Market Taxonomy, 2020 to 2024
    • Market Size Value (USD Million) Forecast By Market Taxonomy, 2025 to 2035
      • By Country
        • Brazil
        • Chile
        • Rest of Latin America
      • By Classification
      • By Application
    • Market Attractiveness Analysis
      • By Country
      • By Classification
      • By Application
    • Key Takeaways
  11. Western Europe Market Analysis 2020 to 2024 and Forecast 2025 to 2035, By Country
    • Historical Market Size Value (USD Million) Trend Analysis By Market Taxonomy, 2020 to 2024
    • Market Size Value (USD Million) Forecast By Market Taxonomy, 2025 to 2035
      • By Country
        • Germany
        • UK
        • Italy
        • Spain
        • France
        • Nordic
        • BENELUX
        • Rest of Western Europe
      • By Classification
      • By Application
    • Market Attractiveness Analysis
      • By Country
      • By Classification
      • By Application
    • Key Takeaways
  12. Eastern Europe Market Analysis 2020 to 2024 and Forecast 2025 to 2035, By Country
    • Historical Market Size Value (USD Million) Trend Analysis By Market Taxonomy, 2020 to 2024
    • Market Size Value (USD Million) Forecast By Market Taxonomy, 2025 to 2035
      • By Country
        • Russia
        • Poland
        • Hungary
        • Balkan & Baltic
        • Rest of Eastern Europe
      • By Classification
      • By Application
    • Market Attractiveness Analysis
      • By Country
      • By Classification
      • By Application
    • Key Takeaways
  13. East Asia Market Analysis 2020 to 2024 and Forecast 2025 to 2035, By Country
    • Historical Market Size Value (USD Million) Trend Analysis By Market Taxonomy, 2020 to 2024
    • Market Size Value (USD Million) Forecast By Market Taxonomy, 2025 to 2035
      • By Country
        • China
        • Japan
        • South Korea
      • By Classification
      • By Application
    • Market Attractiveness Analysis
      • By Country
      • By Classification
      • By Application
    • Key Takeaways
  14. South Asia and Pacific Market Analysis 2020 to 2024 and Forecast 2025 to 2035, By Country
    • Historical Market Size Value (USD Million) Trend Analysis By Market Taxonomy, 2020 to 2024
    • Market Size Value (USD Million) Forecast By Market Taxonomy, 2025 to 2035
      • By Country
        • India
        • ASEAN
        • Australia & New Zealand
        • Rest of South Asia and Pacific
      • By Classification
      • By Application
    • Market Attractiveness Analysis
      • By Country
      • By Classification
      • By Application
    • Key Takeaways
  15. Middle East & Africa Market Analysis 2020 to 2024 and Forecast 2025 to 2035, By Country
    • Historical Market Size Value (USD Million) Trend Analysis By Market Taxonomy, 2020 to 2024
    • Market Size Value (USD Million) Forecast By Market Taxonomy, 2025 to 2035
      • By Country
        • Kingdom of Saudi Arabia
        • Other GCC Countries
        • Turkiye
        • South Africa
        • Other African Union
        • Rest of Middle East & Africa
      • By Classification
      • By Application
    • Market Attractiveness Analysis
      • By Country
      • By Classification
      • By Application
    • Key Takeaways
  16. Key Countries Market Analysis
    • USA
      • Pricing Analysis
      • Market Share Analysis, 2024
        • By Classification
        • By Application
    • Canada
      • Pricing Analysis
      • Market Share Analysis, 2024
        • By Classification
        • By Application
    • Mexico
      • Pricing Analysis
      • Market Share Analysis, 2024
        • By Classification
        • By Application
    • Brazil
      • Pricing Analysis
      • Market Share Analysis, 2024
        • By Classification
        • By Application
    • Chile
      • Pricing Analysis
      • Market Share Analysis, 2024
        • By Classification
        • By Application
    • Germany
      • Pricing Analysis
      • Market Share Analysis, 2024
        • By Classification
        • By Application
    • UK
      • Pricing Analysis
      • Market Share Analysis, 2024
        • By Classification
        • By Application
    • Italy
      • Pricing Analysis
      • Market Share Analysis, 2024
        • By Classification
        • By Application
    • Spain
      • Pricing Analysis
      • Market Share Analysis, 2024
        • By Classification
        • By Application
    • France
      • Pricing Analysis
      • Market Share Analysis, 2024
        • By Classification
        • By Application
    • India
      • Pricing Analysis
      • Market Share Analysis, 2024
        • By Classification
        • By Application
    • ASEAN
      • Pricing Analysis
      • Market Share Analysis, 2024
        • By Classification
        • By Application
    • Australia & New Zealand
      • Pricing Analysis
      • Market Share Analysis, 2024
        • By Classification
        • By Application
    • China
      • Pricing Analysis
      • Market Share Analysis, 2024
        • By Classification
        • By Application
    • Japan
      • Pricing Analysis
      • Market Share Analysis, 2024
        • By Classification
        • By Application
    • South Korea
      • Pricing Analysis
      • Market Share Analysis, 2024
        • By Classification
        • By Application
    • Russia
      • Pricing Analysis
      • Market Share Analysis, 2024
        • By Classification
        • By Application
    • Poland
      • Pricing Analysis
      • Market Share Analysis, 2024
        • By Classification
        • By Application
    • Hungary
      • Pricing Analysis
      • Market Share Analysis, 2024
        • By Classification
        • By Application
    • Kingdom of Saudi Arabia
      • Pricing Analysis
      • Market Share Analysis, 2024
        • By Classification
        • By Application
    • Turkiye
      • Pricing Analysis
      • Market Share Analysis, 2024
        • By Classification
        • By Application
    • South Africa
      • Pricing Analysis
      • Market Share Analysis, 2024
        • By Classification
        • By Application
  17. Market Structure Analysis
    • Competition Dashboard
    • Competition Benchmarking
    • Market Share Analysis of Top Players
      • By Regional
      • By Classification
      • By Application
  18. Competition Analysis
    • Competition Deep Dive
      • Air Liquide
        • Overview
        • Product Portfolio
        • Profitability by Market Segments (Product/Age /Sales Channel/Region)
        • Sales Footprint
        • Strategy Overview
          • Marketing Strategy
          • Product Strategy
          • Channel Strategy
      • Hansol Chemical
      • Dockweiler Chemicals
      • Jiangsu Nata Opto-electronic Material
      • APK (Shanghai ) Gas
      • China Silicon Corporation
      • Huate Gas
      • Zhejiang Borui Electronic Technology
      • Anhui Argosun New Electronic Materials
  19. Assumptions & Acronyms Used
  20. Research Methodology

List of Tables

  • Table 1: Global Market Value (USD Million) Forecast by Region, 2020 to 2035
  • Table 2: Global Market Value (USD Million) Forecast by Classification , 2020 to 2035
  • Table 3: Global Market Value (USD Million) Forecast by Application, 2020 to 2035
  • Table 4: North America Market Value (USD Million) Forecast by Country, 2020 to 2035
  • Table 5: North America Market Value (USD Million) Forecast by Classification , 2020 to 2035
  • Table 6: North America Market Value (USD Million) Forecast by Application, 2020 to 2035
  • Table 7: Latin America Market Value (USD Million) Forecast by Country, 2020 to 2035
  • Table 8: Latin America Market Value (USD Million) Forecast by Classification , 2020 to 2035
  • Table 9: Latin America Market Value (USD Million) Forecast by Application, 2020 to 2035
  • Table 10: Western Europe Market Value (USD Million) Forecast by Country, 2020 to 2035
  • Table 11: Western Europe Market Value (USD Million) Forecast by Classification , 2020 to 2035
  • Table 12: Western Europe Market Value (USD Million) Forecast by Application, 2020 to 2035
  • Table 13: Eastern Europe Market Value (USD Million) Forecast by Country, 2020 to 2035
  • Table 14: Eastern Europe Market Value (USD Million) Forecast by Classification , 2020 to 2035
  • Table 15: Eastern Europe Market Value (USD Million) Forecast by Application, 2020 to 2035
  • Table 16: East Asia Market Value (USD Million) Forecast by Country, 2020 to 2035
  • Table 17: East Asia Market Value (USD Million) Forecast by Classification , 2020 to 2035
  • Table 18: East Asia Market Value (USD Million) Forecast by Application, 2020 to 2035
  • Table 19: South Asia and Pacific Market Value (USD Million) Forecast by Country, 2020 to 2035
  • Table 20: South Asia and Pacific Market Value (USD Million) Forecast by Classification , 2020 to 2035
  • Table 21: South Asia and Pacific Market Value (USD Million) Forecast by Application, 2020 to 2035
  • Table 22: Middle East & Africa Market Value (USD Million) Forecast by Country, 2020 to 2035
  • Table 23: Middle East & Africa Market Value (USD Million) Forecast by Classification , 2020 to 2035
  • Table 24: Middle East & Africa Market Value (USD Million) Forecast by Application, 2020 to 2035

List of Figures

  • Figure 1: Global Market Pricing Analysis
  • Figure 2: Global Market Value (USD Million) Forecast 2020-2035
  • Figure 3: Global Market Value Share and BPS Analysis by Classification , 2025 and 2035
  • Figure 4: Global Market Y to o to Y Growth Comparison by Classification , 2025-2035
  • Figure 5: Global Market Attractiveness Analysis by Classification
  • Figure 6: Global Market Value Share and BPS Analysis by Application, 2025 and 2035
  • Figure 7: Global Market Y to o to Y Growth Comparison by Application, 2025-2035
  • Figure 8: Global Market Attractiveness Analysis by Application
  • Figure 9: Global Market Value (USD Million) Share and BPS Analysis by Region, 2025 and 2035
  • Figure 10: Global Market Y to o to Y Growth Comparison by Region, 2025-2035
  • Figure 11: Global Market Attractiveness Analysis by Region
  • Figure 12: North America Market Incremental Dollar Opportunity, 2025-2035
  • Figure 13: Latin America Market Incremental Dollar Opportunity, 2025-2035
  • Figure 14: Western Europe Market Incremental Dollar Opportunity, 2025-2035
  • Figure 15: Eastern Europe Market Incremental Dollar Opportunity, 2025-2035
  • Figure 16: East Asia Market Incremental Dollar Opportunity, 2025-2035
  • Figure 17: South Asia and Pacific Market Incremental Dollar Opportunity, 2025-2035
  • Figure 18: Middle East & Africa Market Incremental Dollar Opportunity, 2025-2035
  • Figure 19: North America Market Value Share and BPS Analysis by Country, 2025 and 2035
  • Figure 20: North America Market Value Share and BPS Analysis by Classification , 2025 and 2035
  • Figure 21: North America Market Y to o to Y Growth Comparison by Classification , 2025-2035
  • Figure 22: North America Market Attractiveness Analysis by Classification
  • Figure 23: North America Market Value Share and BPS Analysis by Application, 2025 and 2035
  • Figure 24: North America Market Y to o to Y Growth Comparison by Application, 2025-2035
  • Figure 25: North America Market Attractiveness Analysis by Application
  • Figure 26: Latin America Market Value Share and BPS Analysis by Country, 2025 and 2035
  • Figure 27: Latin America Market Value Share and BPS Analysis by Classification , 2025 and 2035
  • Figure 28: Latin America Market Y to o to Y Growth Comparison by Classification , 2025-2035
  • Figure 29: Latin America Market Attractiveness Analysis by Classification
  • Figure 30: Latin America Market Value Share and BPS Analysis by Application, 2025 and 2035
  • Figure 31: Latin America Market Y to o to Y Growth Comparison by Application, 2025-2035
  • Figure 32: Latin America Market Attractiveness Analysis by Application
  • Figure 33: Western Europe Market Value Share and BPS Analysis by Country, 2025 and 2035
  • Figure 34: Western Europe Market Value Share and BPS Analysis by Classification , 2025 and 2035
  • Figure 35: Western Europe Market Y to o to Y Growth Comparison by Classification , 2025-2035
  • Figure 36: Western Europe Market Attractiveness Analysis by Classification
  • Figure 37: Western Europe Market Value Share and BPS Analysis by Application, 2025 and 2035
  • Figure 38: Western Europe Market Y to o to Y Growth Comparison by Application, 2025-2035
  • Figure 39: Western Europe Market Attractiveness Analysis by Application
  • Figure 40: Eastern Europe Market Value Share and BPS Analysis by Country, 2025 and 2035
  • Figure 41: Eastern Europe Market Value Share and BPS Analysis by Classification , 2025 and 2035
  • Figure 42: Eastern Europe Market Y to o to Y Growth Comparison by Classification , 2025-2035
  • Figure 43: Eastern Europe Market Attractiveness Analysis by Classification
  • Figure 44: Eastern Europe Market Value Share and BPS Analysis by Application, 2025 and 2035
  • Figure 45: Eastern Europe Market Y to o to Y Growth Comparison by Application, 2025-2035
  • Figure 46: Eastern Europe Market Attractiveness Analysis by Application
  • Figure 47: East Asia Market Value Share and BPS Analysis by Country, 2025 and 2035
  • Figure 48: East Asia Market Value Share and BPS Analysis by Classification , 2025 and 2035
  • Figure 49: East Asia Market Y to o to Y Growth Comparison by Classification , 2025-2035
  • Figure 50: East Asia Market Attractiveness Analysis by Classification
  • Figure 51: East Asia Market Value Share and BPS Analysis by Application, 2025 and 2035
  • Figure 52: East Asia Market Y to o to Y Growth Comparison by Application, 2025-2035
  • Figure 53: East Asia Market Attractiveness Analysis by Application
  • Figure 54: South Asia and Pacific Market Value Share and BPS Analysis by Country, 2025 and 2035
  • Figure 55: South Asia and Pacific Market Value Share and BPS Analysis by Classification , 2025 and 2035
  • Figure 56: South Asia and Pacific Market Y to o to Y Growth Comparison by Classification , 2025-2035
  • Figure 57: South Asia and Pacific Market Attractiveness Analysis by Classification
  • Figure 58: South Asia and Pacific Market Value Share and BPS Analysis by Application, 2025 and 2035
  • Figure 59: South Asia and Pacific Market Y to o to Y Growth Comparison by Application, 2025-2035
  • Figure 60: South Asia and Pacific Market Attractiveness Analysis by Application
  • Figure 61: Middle East & Africa Market Value Share and BPS Analysis by Country, 2025 and 2035
  • Figure 62: Middle East & Africa Market Value Share and BPS Analysis by Classification , 2025 and 2035
  • Figure 63: Middle East & Africa Market Y to o to Y Growth Comparison by Classification , 2025-2035
  • Figure 64: Middle East & Africa Market Attractiveness Analysis by Classification
  • Figure 65: Middle East & Africa Market Value Share and BPS Analysis by Application, 2025 and 2035
  • Figure 66: Middle East & Africa Market Y to o to Y Growth Comparison by Application, 2025-2035
  • Figure 67: Middle East & Africa Market Attractiveness Analysis by Application
  • Figure 68: Global Market - Tier Structure Analysis
  • Figure 69: Global Market - Company Share Analysis

Frequently Asked Questions

How big is the electronic grade trisilylamine market in 2025?

The global electronic grade trisilylamine market is estimated to be valued at USD 26.1 million in 2025.

What will be the size of electronic grade trisilylamine market in 2035?

The market size for the electronic grade trisilylamine market is projected to reach USD 53.7 million by 2035.

How much will be the electronic grade trisilylamine market growth between 2025 and 2035?

The electronic grade trisilylamine market is expected to grow at a 7.5% CAGR between 2025 and 2035.

What are the key product types in the electronic grade trisilylamine market?

The key product types in electronic grade trisilylamine market are purity ≥99.9% and purity ≥99.5%.

Which application segment to contribute significant share in the electronic grade trisilylamine market in 2025?

In terms of application, cvd segment to command 61.2% share in the electronic grade trisilylamine market in 2025.

Explore Similar Insights

Future Market Insights

Electronic Grade Trisilylamine Market

Chat With

MaRIA

Hi There, I am MaRIA, Your Market Research Intelligence Assistant. How may I help you?