Smart Home Devices Market
Market Insights on Smart Home Devices covering sales outlook, demand forecast & up-to-date key trends
Smart Home Devices Market By Product Type (Security Lighting Control Smart Home Device, Access Control Smart Home Device, HVAC Control Smart Home Device), Price Range (Below US$ 25 Smart Home Device, US$ 25-35 Smart Home Device) & Region - Forecast to 2021 - 2031
Smart Home Devices Market - About the Report
[300 Pages Report] The smart home devices market is currently exhibiting growth at an impressive pace. Due to the increasing popularity of technological advancements, device and appliance manufacturers now have the focus on fostering smarter homes.
Advanced automated systems such as monitor lighting, temperature, multi-media, security shields, entertainment systems, window and door operations, and others, which can be operated by users through smartphones and computers are being launched. Focus on smart home technologies is expected to rise, paving way for the expansion of smart home devices market.
One of the most important aspects of smart home technology is that it helps to save the world's limited resources. As they use controllers that are integrated with home sub-systems to make their homes smart and green, people are becoming more aware of the capabilities of smart home devices.
Future Market Insight’s latest edition of the study offers comprehensive insights into the market trends, value (US$ Bn) projections, recent developments, and dynamics. The report tracks the global value of smart home devices market in various high-growth countries across regions such as South Asia & Pacific, Middles East, and Latin America offering the most profitable opportunities to stakeholders.
The report also analyzes the impact COVID-19 has had on the economy in general, and thermal printing in particular.
Let us know your requirement to get
100% FREE customization
How Future Outlook of Smart Home Devices Market Compare with Historic Sales?
The early 1900s saw the introduction of the first home appliances due to the industrial revolution. Clothes dryers, washing machines, refrigerators, and electric dishwashers were introduced after vacuum cleaners. Although these were not “smart” appliances, but their arrival in the twentieth century changed the world for consumers.
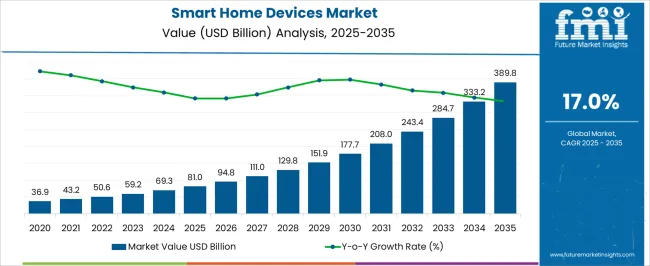
Apart from this, other aspects such as consumer interest for smart devices such as Amazon Alexa, Smart Thermostats, and Digital Electric Smoker and others have been fuelling the demand for connected devices. Driven by this, the smart home devices market is forecast to exhibit 18.7% CAGR between 2021 and 2031.
How is Increasing number of Internet Users Driving Smart Home Devices Sales?
Advantages obtained by connecting household items to the internet or the Internet of Things (IoT) are many. Connected devices have become increasingly popular among residential consumers. The IoT connects goods, software algorithms, services, and end-users, allowing data to flow freely and real-time decisions to be made.
The Internet of Things has proven its value by improving the performance and functionality of automation systems. Several huge, mid-sized, and small businesses around the world are heavily investing in the IoT and IoT-enabled devices. It is expected to impact a broad variety of application areas, including lighting, HVAC, defence, healthcare, and entertainment, as most companies moving towards IoT.
The increasing customer preference for video doorbells, voice-assisted technologies (such as Alexa and Google Home), and security systems are anticipated to accelerate the smart home devices market. Because of the adoption of internet-enabled smart devices such as radio frequency identification (RFID), barcode scanners, and mobile computers, the overall IoT market is expected to develop.
Find your sweet spots for generating winning opportunities in this market.
Talk to AnalystHow is Change in Consumer Behavior Pattern Affecting Smart Devices Sales?
Consumers nowadays prefer smart appliances which are highly integrated with latest technologies. The use of smart home technology helps to reduce energy consumption. Thermostats are one of the most attractive features of smart devices, since they maintain optimal temperatures while conserving energy while homeowners are away.
Smart indoor and outdoor lighting, in addition to temperature control, are another group of devices that are making homes more energy efficient - and making homeowners increasingly happy.
This changing consumer preference is influencing the manufactures to provide the highly innovative smart devices and increase their production. For instance, manufactures are providing smart lightings which allows the customers to monitor smart bulbs and lightings with their smart phones, smart watches and tablets as well as trigger them with voice commands. Consumers are becoming more involved in such technologies, which is motivating players to increase demand.
Technological Advancements in Smart Home Devices Driving Sales
Consumer preferences are evolving as a result of rapid technological advancements. As their standard of living rises, they expect more revolutionary smart devices. As a result, manufacturers are encouraged to invest in state-of-the-art and innovative technologies to expand their product portfolio and tailor them to meet the needs of customers.
Millennial as a consumer demography showcases great influence on prevailing market trends. This era has also given millennials a distinct set of expectations and priorities. They are more interested to know and adopt new things, which is why they are better connected to digital world.
For instance, the smart home appliances such as temperature control mugs have certain advantages which help in driving their demand. Against this backdrop, manufacturers are thinking of implementing advanced technology in their products, creating prospects for increasing penetration of smart home devices market in the coming years.

An unified Market Research Subscription Platform, built for today’s disparate research needs.
How are Eco-friendly Smart Devices Driving an Opportunities in the Market?
The potential for environmental effect is one of the biggest opportunities for the rising smart home industry. Smart devices and automated homes can help with home energy efficiency and cost savings, which can be a great value proposition for homeowners looking to maximize their technology. A simple sensor will ensure that lights and temperature control, for example, are only turned on when they are needed, reducing energy waste and saving money.
In light of growing demand players are providing eco- friendly devices like Nest Thermostat which includes security cameras and motion sensor alarms, to help you build an eco-friendly smart home.
How is Risk of Device Malfunctioning Posing Challenge to the Consumers?
Device interconnectivity specifications, communication protocols, and network technologies are all essential components of smart home systems. The integration of all devices is essential to the operation of smart home products.
The hardware, software, and service segments make up the smart home ecosystem. The smooth and cooperative operation of all three segments is critical for the effective and consistent operation of any single product. Any of these three failing or being disconnected can cause a slew of problems for consumers in terms of cost and technological difficulties. For a long time, a number of people have used smart thermostats, smart meters, HVAC controls, and lighting controls. Since these devices have a high switching cost, dis functioning of the devices is posing a challenge to customers and it is even hindering the product growth. Since customers have reported several problems with the product, this will generate a negative perception of the product, and customers may be hesitant to purchase it in the future.
As a result, manufacturers of smart home devices, on the other hand, are entering into collaboration or partnership agreements with software and communication technology providers to develop market-specific creative products, which could help them resolve the challenge.
Smart Home Devices Market Country-wise Insights
How is Digitization Fuelling Demand for Smart Home Devices in Germany?
Germany is expected to become a leading market for smart technology in the coming years. The digitization of private household applications, such as in the areas of comfort and protection, energy management, and self-determination in old age, is rapidly advancing.
The growth of the internet, as well as the spread of networkable household components and mobile communication devices, has resulted in new home applications and business models. As a result, the smart living industry has grown its importance. German companies, in particular, are projected to account for a significant share of the global market volume in an increasingly growing market.
In light of the current situation it is been noticed that people are much home bound and the Corona pandemic contributed to a substantial increase in demand for tech products for use at home, such as warning alarms, robot vacuum cleaners, or voice-controlled speakers etc. As a result, this demand has aided in the rapid digitization of private households. Hence, it is expected in future years there will be high demand for smart home devices in Germany.
Will Millennials Continue to Drive Demand for Smart Devices in the U.S.?
The younger generations are believed to be the most technologically advanced. Since these generations have seen several technological advances, millennials foresee more variety in the goods provided by businesses. Smart products have a strong grip on the younger generation. The generation most interested in having smart technology in their homes is the millennials.
The demography of consumers are also environmentally aware and support the use of sustainable materials. Millennials as a group that is passionate about reducing their carbon footprint and encouraging long-term sustainability. They are more likely to change their actions to reduce their carbon footprint or to patronise environmental friendly companies.
Given that smart home technology can be used to conserve energy and lead a more environment friendly lifestyle, it's understandable that this is a consideration of the younger generations and the need to buy the smart devices and to live a luxurious life is increasing demand for smart devices in US.
Is Affordability Increasing the Adoption of Smart Devices in Brazil?
In the past years, connected devices were distant reality due to lack of internet access to the Brazilian population. Rise in income and the rise in production of eco-friendly devices within Brazil has increased the popularity of the smart home devices among people, while on the hindsight the players are becoming more aware about the product development strategies and concentrating on developing more affordable products for their consumers.
How are Government Initiatives towards Digital India Driving the Adoption of Smart Home Devices in India?
Digitization campaigns have been gathering steam in India, thanks to recent government initiatives. For instance, the government's Digital India campaign aims to make India digitally empowered by improving Internet connectivity and speed.
The fear of losing power or other safety concerns is alleviated by high-speed Internet, which has been aiding the expansion of the market for connected goods. Similarly, home automation systems are becoming more prevalent. Thus, the increase in adoption of smart services will provide growth opportunities for the smart home device manufactures.
How will Robust Urban Society promote Smart Homes Devices demand in Japan?
The Smart Home industry has attractive business opportunity in Japan. The Japan market is seeing an increase in demand for a safe and secure living environment, especially in terms of safety features and distinct monitoring for the elderly.
Unprecedented natural calamities witnessed in the last few years such as the Great East Japan Earthquake of 2011 have fuelled the demand for connected devices that can send alert to consumers or let them control and monitor devices remotely using a smartphone app.
Japan also is concentrating on building energy-efficient smart homes and supporting devices. Since mountains cover two-thirds of Japan's land, the country essentially has just one-third of its land usable for living purposes.
In Japan rather than living in rural areas there is huge population which are been living in cities, smart home companies such as consumer electronics manufacturers, home builders, housing equipment manufacturers, and communication manufacturers have an opportunity to showcase their smart home products.
Smart Home Devices Market Category-Wise Insights
How is Entertainment Category Faring within the Smart Home Devices Market?
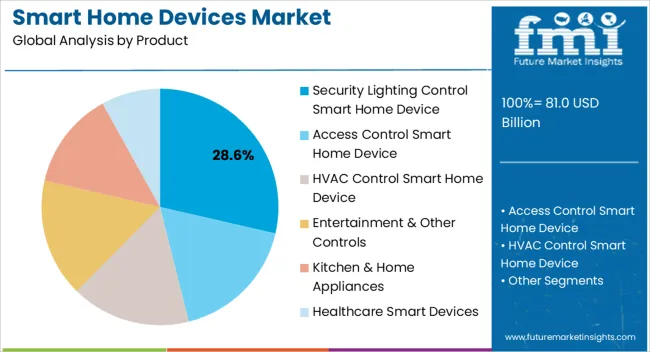
In terms of revenue share by product type, entertainment & other controls holds a notable share in the market. The demand for entertainment & other controls is driven by growing preferences for smart devices like Google home voice controller, smart coffee maker among millennials. Millennial consumers are highly fascinated by IT enabled tech products.
The growing spending power among millennials has further encouraged millennials buyers to switch to xx. Thus, facilitating high demand growth for laptops, iPads, Headphones etc. are other prominent smart home devices.
Will Online Retailing become the Most Prominent Sales channel of Smart Home Devices?
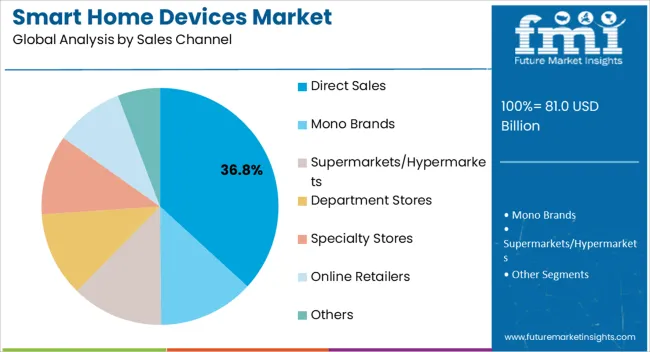
As per the analysis, online retailing is likely to dominate over the forecast period. Due to changing consumer preferences, rather buying offline the consumers are shifting towards online retailing this is encouraging the manufactures to increase their online presence in the market.
The availability of a variety of devices online is one of the prominent factors that have stimulated an increase in the online sales channel. Many smart home device players on the retail front today are actively guiding customers regarding the assortment of benefits available in different smart devices.
Will Kitchen Appliances Drive the Market Sales for Smart Devices?
There is an increase in the demand for home devices such as air fryers, toast makers, ovens, and others. The market is seeing an increase in the availability of electronic/ digital cooking products for domestic consumers. Due to traditional heating kitchen appliances, the homeowners look ahead for technologically advanced and aesthetic, smart kitchen appliances, in order to enhance the quality of their living.
In addition, the introduction of wind-driven technology encourages consumers to transform their basic kitchen into a smart kitchen. Companies operating in the smart home appliances market offer a number of home appliances to address the growing demand for such equipment for residential user applications.
Competitive Landscape
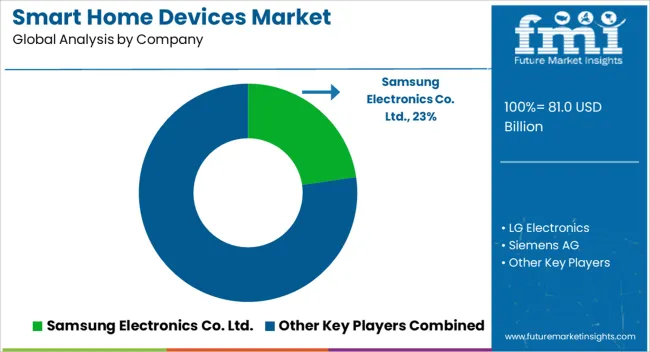
Some of the prominent players in global smart home devices market include Samsung electronics Co. Ltd, LG Electronics, Siemens AG, Samsung electronics Co. Ltd, Honeywell International Inc., Schneider Electric, Koninklijke Philips N. V, Amazon.com Inc., Robert Bosch GmbH, Apple Inc., Nest Labs, UNITED TECHNOLOGIES, Panasonic Corporation, Sony Corporation, and Midea Group.
The players have opportunities to generate sales and improve their position in the smart devices market by implementing latest ideas into their products. They also can widen their distribution methods by collaborating with the industries. There is incredible focus on staying up-to-date with the latest technologies. Therefore, product launches are a common strategy as market players seek to offer state-of-the art technologies to their consumers.
For instance,
- Apple, one of the pioneers of smart home devices, has been working on combining TV Box and HomePod speakers to revive their smart home efforts.
- In 2019, Google launched Google Assistant Connect with the intent of wooing smart home device manufacturers. This launch was intended to make it easier for companies to integrate Google Assistant technology into their products.
- In 2020, Panasonic launched its IoT and artificial intelligence-enabled platform called Miraie in India, through which it plans to introduce a wide range of connected air conditioners, switches, and smart door bells in India.
Some of the leading companies operating in the market are:
- Samsung electronics Co. Ltd
- LG Electronics
- Siemens AG
- Honeywell International Inc.
- Schneider Electric
- Koninklijke Philips N. V
- Amazon.com Inc.
- Robert Bosch GmbH
- Apple Inc.
- Nest Labs
- UNITED TECHNOLOGIES
- Panasonic Corporation
- Sony Corporation
- Midea Group
- ORVIBO, Inc.
*The list is not exhaustive, and only for representational purposes. Full competitive intelligence with SWOT analysis available in the report.
Scope of the Report
Attribute |
Details |
Forecast Period |
2021-2031 |
Historical Data Available for |
2016-2020 |
Market Analysis |
USD Billion for value |
Key Regions Covered |
North America, Latin America, Europe, East Asia, South Asia, Oceania Middle East & Africa |
Key Countries Covered |
US, Canada, Germany, U.K., France, Italy, Spain, China, Japan, South Korea, India, Thailand, Malaysia, Indonesia, Australia, New Zealand, South Africa, Brazil, Mexico |
Key Segments Covered |
Product Type, Price Range, Sales Channel and Region. |
Key Companies Profiled |
|
Report Coverage |
Market Forecast, brand share analysis, competition intelligence, DROT analysis, Market Dynamics and Challenges, Strategic Growth Initiatives |
Customization & Pricing |
Smart Home Devices Market by Category
Product Type:
- Security Lighting Control Smart Home Device
- Dimmers
- Switches
- Sensors
- Access Control Smart Home Device
- Video Surveillance
- Access Control
- Fire and Smoke Detectors
- HVAC Control Smart Home Device
- Smart Thermostats
- Heating and Cooling Coils
- Entertainment and Other Control Smart Home Device
- Audio, Volume, & Multimedia Controls
- Home Theater System Controls
- Others
- Kitchen & Home Appliances
- Smart Refrigerators
- Smart Vacuum Cleaners
- Smart Coffee Makers
- Others
- Healthcare Smart Devices
- Fitness Tracker
- Blood Pressure Monitor System
Price Range:
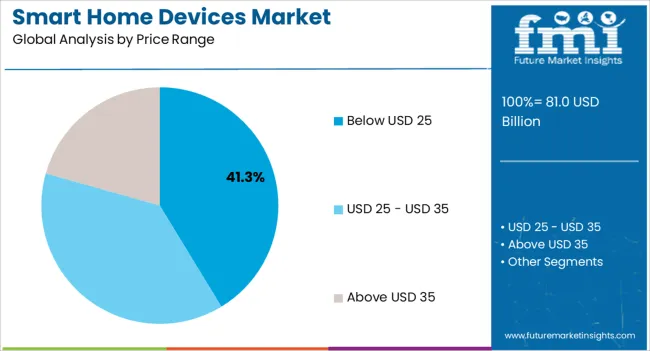
- Below US$ 25 Smart Home Device
- US$ 25-35 Smart Home Device
- Above US$ 35 Smart Home Device
Sales Channel:
- Direct Sales
- Mono Brands
- Supermarkets/Hypermarkets
- Department Stores
- Specialty Stores
- Online Retailers
- Other Sales Channel
Region:
- North America
- Latin America
- Europe
- East Asia
- South Asia
- Oceania
- Middle East and Africa (MEA)
Frequently Asked Questions
The global smart home devices market is expected to register a CAGR of 18.7% during the forecast period 2021-2031. As per Future Market Insights, the global smart home devices market valuation is around US$ 42 billion in 2021.
The U.S. is exhibiting considerably high demand within the global market for smart home devices. Sales in the U.S. is expected to account for a notable share of 72.5% of sales within North America.
Some of the leading companies in Smart Home Devices market are Samsung electronics Co. Ltd, LG Electronics, Siemens AG, Samsung electronics Co. Ltd, Honeywell International Inc., Schneider Electric, Koninklijke Philips N. V, Amazon.com Inc., Robert Bosch GmbH, Apple Inc., Nest Labs, UNITED TECHNOLOGIES, Panasonic Corporation, Sony Corporation, Midea Group and among others.
As per FMI, the demand for entertainment and other control smart home devices is considerably high, accounting for maximum sales in the smart home devices market.
Table of Content
1. Executive Summary
1.1. Global Market Outlook
1.2. Summary of Key Findings
1.3. Summary of Key statistics
1.4. FMI Analysis and Recommendations
2. Market Overview
2.1. Market Taxonomy
2.2. Market Definition
3. Key Market Trends
3.1. Key Trends Impacting the Market
3.1.1. Changing Trends Influence Manufactures;
3.1.2. Eco-Friendly Smart Home Devices
3.1.3. Expanding Urban Population
3.1.4. Consumers Becoming Tech Savvy
3.2. Product Innovation Trends
3.2.1. Companies focusing on Security Features
3.2.2. Increasing use of AI Technology
3.2.3. Enhanced functionality
3.2.4. Smart Grid Technology Becoming a Popular Trend
3.3. Future Prospects of Smart Home Devices Market
3.3.1. Factors Fueling growth
3.3.2. Influx of Brands
3.3.3. Innovative Distribution and Marketing Strategies
4. Brand Mapping Analysis
4.1. Price v/s Product
4.2. Value for Money
4.3. Top of Mind Smart Home Devices Brands
4.4. Brand Portfolio-by Key Players
4.5. Brand Loyalty Mapping
4.6. Usage Pattern Overview
4.7. Branded vs. Unbranded-Market Mix
5. Impact of Covid-19 on Smart Home Devices Market
5.1. Impact of Covid-19 on Smart Home Devices Industry
5.2. Smart Home Devices Sales Projection, Q1-Q4 2020 During Covid-19 Pandemic
5.3. Pre Covid-19 Market Forecast v/s Post Covid-19 Market Forecast
6. The Massive Impact of the Crisis
6.1. Covid-19 The Situation Now
6.2. Countries in action: How have countries been responding?
6.3. The Economic Impact of the COVID-19 Outbreak on Developing Asia
6.4. Impact of COVID-19 on the Gross Domestic Product of Selected Economies
6.5. Current Economic Projection – GDP/GVA and probable impact
6.6. Comparison of SAARs and market recovery, comparison to 2008 financial crisis and market recovery and forecast comparison for recovery of COVID-19
6.7. Impact of Covid-19 on Manufacturing Industry
6.8. Coronavirus Impact on The World of Work
6.9. Projected Recovery for Hardest Hit Sectors
7. Global Smart Home Devices Market Demand Analysis 2016-2020 and Forecast, 2021-2031
7.1. Historical Market Volume (Units) Analysis, 2016-2020
7.2. Current and Future Market Volume (Units) Projections, 2021-2031
7.3. Y-o-Y Growth Trend Analysis
8. Global Smart Home Devices Market - Pricing Analysis
8.1. Regional Pricing Analysis By Product Type
8.2. Pricing Break-up
8.2.1. Manufacturer Level Pricing
8.2.2. Distributor Level Pricing
8.3. Average Pricing Analysis Benchmark
9. Global Smart Home Devices Market Demand (in Value or Price Range in US$ Mn) Analysis 2016-2020 and Forecast, 2021-2031
9.1. Historical Market Value (US$ Bn) Analysis, 2016-2020
9.2. Current and Future Market Value (US$ Bn) Projections, 2021-2031
9.2.1. Y-o-Y Growth Trend Analysis
9.2.2. Absolute $ Opportunity Analysis
10. Market Background
10.1. Global Appliances Industry Outlook
10.2. Smart Devices Industry Outlook
10.3. Macro-Economic Factors
10.3.1. Global GDP Growth Outlook
10.3.2. Global Consumer Spending Outlook
10.3.3. Retail Sector GVA and Growth
10.3.4. Per Capita Disposable Income
10.3.5. Global Urbanization Outlook
10.3.6. Global Working Population Statistics
10.3.7. E-commerce Penetration Overview
10.4. Forecast Factors - Relevance & Impact
10.4.1. Top Company’s Historical Growth
10.4.2. Per Capita Disposable Income
10.4.3. Global consumer Goods Industry Analysis
10.4.4. Global Urbanization Growth outlook
10.4.5. World internet User Statistics
10.5. Industry Value and Supply Chain Analysis
10.6. Market Dynamics
10.6.1. Drivers
10.6.2. Restraints
10.6.3. Opportunity Analysis
10.7. PESTLE Analysis of Smart Home Devices Market
10.8. Investment Feasibility Matrix
10.9. Porter’s Five Force
10.10. Consumer Sentiment Analysis
10.10.1. Which specific brand is preferred by the consumers and why?
10.10.2. Factors influencing market behavior
10.10.3. Are consumers ready to pay premium price for products?
10.10.4. Does social media influence customer’s decision making?
10.10.5. Which mode of advertisement do vendors prefer?
10.10.6. Which of the social media platforms does companies prefers for branding?
10.10.7. What are the key challenges associated with the market suppliers?
10.10.8. Others
11. Global Smart Home Devices Market Analysis 2016-2020 and Forecast 2021-2031, by Product Type
11.1. Introduction / Key Findings
11.2. Historical Market Size (US$ Bn) and Volume Analysis By Product Type, 2016-2020
11.3. Current and Future Market Size (US$ Bn) and Volume Analysis and Forecast By Product Type, 2021-2031
11.3.1. Lighting Control
11.3.1.1. Dimmers
11.3.1.2. Switches
11.3.1.3. Sensors
11.3.2. Security and Access Control
11.3.2.1. Video Surveillance
11.3.2.2. Access Control
11.3.2.3. Fire and Smoke Detectors
11.3.3. HVAC Control
11.3.3.1. Smart Thermostats
11.3.3.2. Heating and Cooling Coils
11.3.4. Entertainment and Other Controls
11.3.4.1. Audio, Volume, & Multimedia Controls
11.3.4.2. Home Theater System Controls
11.3.4.3. Others
11.3.5. Kitchen & Home Appliances
11.3.5.1. Smart Refrigerators
11.3.5.2. Smart Vacuum Cleaners
11.3.5.3. Smart Coffee Makers
11.3.5.4. Others
11.3.6. Healthcare Smart Devices
11.3.6.1. Fitness Tracker
11.3.6.2. Blood Pressure Monitor System
11.4. Market Attractiveness Analysis By Product Type
12. Global Smart Home Devices Market Analysis 2016-2020 and Forecast 2021-2031, by Price Range
12.1. Introduction / Key Findings
12.2. Historical Market Size (US$ Bn) and Volume Analysis By Price Range, 2016-2020
12.3. Current and Future Market Size (US$ Bn) and Volume Analysis and Forecast Price Range, 2021-2031
12.3.1. Below US$ 25
12.3.2. US$ 25-35
12.3.3. Above US$ 35
12.4. Market Attractiveness Analysis By Price Range
13. Global Smart Home Devices Market Analysis 2016-2020 and Forecast 2021-2031, by Sales Channel
13.1. Introduction / Key Findings
13.2. Historical Market Size (US$ Bn) and Volume Analysis By Sales Channel, 2016-2020
13.3. Current and Future Market Size (US$ Bn) and Volume Analysis and Forecast By Sales Channel, 2021-2031
13.3.1. Direct Sales
13.3.2. Mono Brands
13.3.3. Supermarkets/Hypermarkets
13.3.4. Department Stores
13.3.5. Specialty Stores
13.3.6. Online Retailers
13.3.7. Other Sales Channel
13.4. Market Attractiveness Analysis By Sales Channel
14. Global Smart Home Devices Market Analysis 2016-2020 and Forecast 2021-2031, by Region
14.1. Introduction
14.2. Historical Market Size (US$ Bn) and Volume Analysis By Region, 2016-2020
14.3. Current Market Size (US$ Bn) and Volume Analysis and Forecast By Region, 2021-2031
14.3.1. North America
14.3.2. Latin America
14.3.3. Europe
14.3.4. South Asia
14.3.5. East Asia
14.3.6. Oceania
14.3.7. MEA
14.4. Market Attractiveness Analysis By Region
15. North America Smart Home Devices Market Analysis 2016-2020 and Forecast 2021-2031
15.1. Introduction
15.2. Pricing Analysis
15.3. Historical Market Size (US$ Bn) and Volume Trend Analysis By Market Taxonomy, 2016-2020
15.4. Market Size (US$ Bn) and Volume Forecast By Market Taxonomy, 2021-2031
15.4.1. By Country
15.4.1.1. US
15.4.1.2. Canada
15.4.2. By Product Type
15.4.3. By Price Range
15.4.4. By Sales channel
15.5. Market Attractiveness Analysis
15.5.1. By Country
15.5.2. By Product Type
15.5.3. By Price Range
15.5.4. By Sales channel
16. Latin America Smart Home Devices Market Analysis 2016-2020 and Forecast 2021-2031
16.1. Introduction
16.2. Pricing Analysis
16.3. Historical Market Size (US$ Bn) and Volume Trend Analysis By Market Taxonomy, 2016-2020
16.4. Market Size (US$ Bn) and Volume Forecast By Market Taxonomy, 2021-2031
16.4.1. By Country
16.4.1.1. Brazil
16.4.1.2. Mexico
16.4.1.3. Rest of Latin America
16.4.2. By Product Type
16.4.3. By Price Range
16.4.4. By Sales channel
16.5. Market Attractiveness Analysis
16.5.1. By Country
16.5.2. By Product Type
16.5.3. By Price Range
16.5.4. By Sales channel
17. Europe Smart Home Devices Market Analysis 2016-2020 and Forecast 2021-2031
17.1. Introduction
17.2. Pricing Analysis
17.3. Historical Market Size (US$ Bn) and Volume Trend Analysis By Market Taxonomy, 2016-2020
17.4. Market Size (US$ Bn) and Volume Forecast By Market Taxonomy, 2021-2031
17.4.1. By Country
17.4.1.1. UK
17.4.1.2. Germany
17.4.1.3. Italy
17.4.1.4. Spain
17.4.1.5. France
17.4.1.6. Rest of Europe
17.4.2. By Product Type
17.4.3. By Price Range
17.4.4. By Sales channel
17.5. Market Attractiveness Analysis
17.5.1. By Country
17.5.2. By Product Type
17.5.3. By Price Range
17.5.4. By Sales channel
18. East Asia Smart Home Devices Market Analysis 2016-2020 and Forecast 2021-2031
18.1. Introduction
18.2. Pricing Analysis
18.3. Historical Market Size (US$ Bn) and Volume Trend Analysis By Market Taxonomy, 2016-2020
18.4. Market Size (US$ Bn) and Volume Forecast By Market Taxonomy, 2021-2031
18.4.1. By Country
18.4.1.1. China
18.4.1.2. Japan
18.4.1.3. South Korea
18.4.2. By Product Type
18.4.3. By Price Range
18.4.4. By Sales channel
18.5. Market Attractiveness Analysis
18.5.1. By Country
18.5.2. By Product Type
18.5.3. By Price Range
18.5.4. By Sales channel
19. South Asia Smart Home Devices Market Analysis 2016-2020 and Forecast 2021-2031
19.1. Introduction
19.2. Pricing Analysis
19.3. Historical Market Size (US$ Bn) and Volume Trend Analysis By Market Taxonomy, 2016-2020
19.4. Market Size (US$ Bn) and Volume Forecast By Market Taxonomy, 2021-2031
19.4.1. By Country
19.4.1.1. India
19.4.1.2. Thailand
19.4.1.3. Indonesia
19.4.1.4. Malaysia
19.4.1.5. Rest of South Asia
19.4.2. By Product Type
19.4.3. By Price Range
19.4.4. By Sales channel
19.5. Market Attractiveness Analysis
19.5.1. By Country
19.5.2. By Product Type
19.5.3. By Price Range
19.5.4. By Sales channel
20. Oceania Smart Home Devices Market Analysis 2016-2020 and Forecast 2021-2031
20.1. Introduction
20.2. Pricing Analysis
20.3. Historical Market Size (US$ Bn) and Volume Trend Analysis By Market Taxonomy, 2016-2020
20.4. Market Size (US$ Bn) and Volume Forecast By Market Taxonomy, 2021-2031
20.4.1. By Country
20.4.1.1. Australia
20.4.1.2. New Zealand
20.4.2. By Product Type
20.4.3. By Price Range
20.4.4. By Sales channel
20.5. Market Attractiveness Analysis
20.5.1. By Country
20.5.2. By Product Type
20.5.3. By Price Range
20.5.4. By Sales channel
21. MEA Smart Home Devices Market Analysis 2016-2020 and Forecast 2021-2031
21.1. Introduction
21.2. Pricing Analysis
21.3. Historical Market Size (US$ Bn) and Volume Trend Analysis By Market Taxonomy, 2016-2020
21.4. Market Size (US$ Bn) and Volume Forecast By Market Taxonomy, 2021-2031
21.4.1. By Country
21.4.1.1. GCC Countries
21.4.1.2. South Africa
21.4.1.3. Northern Africa
21.4.1.4. Rest of MEA
21.4.2. By Product Type
21.4.3. By Price Range
21.4.4. By Sales channel
21.5. Market Attractiveness Analysis
21.5.1. By Country
21.5.2. By Product Type
21.5.3. By Price Range
21.5.4. By Sales channel
22. Market Structure Analysis
22.1. Market Analysis by Tier of Companies
22.2. Market Concentration
22.3. Market Share Analysis of Top Players
22.4. Market Presence Analysis
22.4.1. By Regional footprint of Players
22.4.2. Product foot print by Players
22.4.3. Channel Foot Print by Players
23. Competition Analysis
23.1. Competition Dashboard
23.2. Pricing Analysis by Competition
23.3. Competition Benchmarking
23.4. Competition Deep Dive
23.4.1. Samsung electronics Co. Ltd
23.4.1.1. Overview
23.4.1.2. Product Portfolio
23.4.1.3. Profitability by Market Segments (Product/Channel/Region)
23.4.1.4. Sales Footprint
23.4.1.5. Strategy Overview
23.4.2. LG Electronics
23.4.2.1. Overview
23.4.2.2. Product Portfolio
23.4.2.3. Profitability by Market Segments (Product/Channel/Region)
23.4.2.4. Sales Footprint
23.4.2.5. Strategy Overview
23.4.3. Siemens AG
23.4.3.1. Overview
23.4.3.2. Product Portfolio
23.4.3.3. Profitability by Market Segments (Product/Channel/Region)
23.4.3.4. Sales Footprint
23.4.3.5. Strategy Overview
23.4.4. Honeywell International Inc.
23.4.4.1. Overview
23.4.4.2. Product Portfolio
23.4.4.3. Profitability by Market Segments (Product/Channel/Region)
23.4.4.4. Sales Footprint
23.4.4.5. Strategy Overview
23.4.5. Schneider Electric
23.4.5.1. Overview
23.4.5.2. Product Portfolio
23.4.5.3. Profitability by Market Segments (Product/Channel/Region)
23.4.5.4. Sales Footprint
23.4.5.5. Strategy Overview
23.4.6. Koninklijke Philips N. V
23.4.6.1. Overview
23.4.6.2. Product Portfolio
23.4.6.3. Profitability by Market Segments (Product/Channel/Region)
23.4.6.4. Sales Footprint
23.4.6.5. Strategy Overview
23.4.7. Amazon.com Inc.
23.4.7.1. Overview
23.4.7.2. Product Portfolio
23.4.7.3. Profitability by Market Segments (Product/Channel/Region)
23.4.7.4. Sales Footprint
23.4.7.5. Strategy Overview
23.4.8. Robert Bosch GmbH
23.4.8.1. Overview
23.4.8.2. Product Portfolio
23.4.8.3. Profitability by Market Segments (Product/Channel/Region)
23.4.8.4. Sales Footprint
23.4.8.5. Strategy Overview
23.4.9. Apple Inc.
23.4.9.1. Overview
23.4.9.2. Product Portfolio
23.4.9.3. Profitability by Market Segments (Product/Channel/Region)
23.4.9.4. Sales Footprint
23.4.9.5. Strategy Overview
23.4.10. Nest Labs
23.4.10.1. Overview
23.4.10.2. Product Portfolio
23.4.10.3. Profitability by Market Segments (Product/Channel/Region)
23.4.10.4. Sales Footprint
23.4.10.5. Strategy Overview
23.4.11. UNITED TECHNOLOGIES
23.4.11.1. Overview
23.4.11.2. Product Portfolio
23.4.11.3. Profitability by Market Segments (Product/Channel/Region)
23.4.11.4. Sales Footprint
23.4.11.5. Strategy Overview
23.4.12. Panasonic Corporation
23.4.12.1. Overview
23.4.12.2. Product Portfolio
23.4.12.3. Profitability by Market Segments (Product/Channel/Region)
23.4.12.4. Sales Footprint
23.4.12.5. Strategy Overview
23.4.13. Sony Corporation
23.4.13.1. Overview
23.4.13.2. Product Portfolio
23.4.13.3. Profitability by Market Segments (Product/Channel/Region)
23.4.13.4. Sales Footprint
23.4.13.5. Strategy Overview
23.4.14. Midea Group
23.4.14.1. Overview
23.4.14.2. Product Portfolio
23.4.14.3. Profitability by Market Segments (Product/Channel/Region)
23.4.14.4. Sales Footprint
23.4.14.5. Strategy Overview
23.4.15. ORVIBO, Inc.
23.4.15.1. Overview
23.4.15.2. Product Portfolio
23.4.15.3. Profitability by Market Segments (Product/Channel/Region)
23.4.15.4. Sales Footprint
23.4.15.5. Strategy Overview
24. Assumptions and Acronyms Used
25. Research Methodology
Let us know your requirement to get
100% FREE customization
List of Tables
Table 1: Global Smart Home Devices Market Value (US$ Bn) Forecast, By Product Type, 2016–2031
Table 2: Global Smart Home Devices Market Volume (Units) Forecast, By Product Type, 2016–2031
Table 3: Global Smart Home Devices Market Value (US$ Bn) Forecast, By Price Range, 2016–2031
Table 4: Global Smart Home Devices Market Volume (Units) Forecast, By Price Range, 2016–2031
Table 5: Global Smart Home Devices Market Value (US$ Bn) Forecast, By Sales Channel, 2016–2031
Table 6: Global Smart Home Devices Market Volume (Units) Forecast, By Sales Channel, 2016–2031
Table 7: Global Smart Home Devices Market Value (US$ Bn) Forecast, By Region, 2016–2031
Table 8: Global Smart Home Devices Market Volume (Units) Forecast, By Region, 2016–2031
Table 9: North America Smart Home Devices Market Value (US$ Bn) Forecast, By Country , 2016–2031
Table 10: North America Smart Home Devices Market Volume (Units) Forecast, By Country , 2016–2031
Table 11: North America Smart Home Devices Market Value (US$ Bn) Forecast, By Product Type, 2016–2031
Table 12: North America Smart Home Devices Market Volume (Units) Forecast, By Product Type, 2016–2031
Table 13: North America Smart Home Devices Market Value (US$ Bn) Forecast, By Price Range, 2016–2031
Table 14: North America Smart Home Devices Market Volume (Units) Forecast, By Price Range, 2016–2031
Table 15: North America Smart Home Devices Market Value (US$ Bn) Forecast, By Sales Channel, 2016–2031
Table 16: North America Smart Home Devices Market Volume (Units) Forecast, By Sales Channel, 2016–2031
Table 17: Latin America Smart Home Devices Market Value (US$ Bn) Forecast, By Country , 2016–2031
Table 18: Latin America Smart Home Devices Market Volume (Units) Forecast, By Country , 2016–2031
Table 19: Latin America Smart Home Devices Market Value (US$ Bn) Forecast, By Product Type, 2016–2031
Table 20: Latin America Smart Home Devices Market Volume (Units) Forecast, By Product Type, 2016–2031
Table 21: Latin America Smart Home Devices Market Value (US$ Bn) Forecast, By Price Range, 2016–2031
Table 22: Latin America Smart Home Devices Market Volume (Units) Forecast, By Price Range, 2016–2031
Table 23: Latin America Smart Home Devices Market Value (US$ Bn) Forecast, By Sales Channel, 2016–2031
Table 24: Latin America Smart Home Devices Market Volume (Units) Forecast, By Sales Channel, 2016–2031
Table 25: Europe Smart Home Devices Market Value (US$ Bn) Forecast, By Country , 2016–2031
Table 26: Europe Smart Home Devices Market Volume (Units) Forecast, By Country , 2016–2031
Table 27: Europe Smart Home Devices Market Value (US$ Bn) Forecast, By Product Type, 2016–2031
Table 28: Europe Smart Home Devices Market Volume (Units) Forecast, By Product Type, 2016–2031
Table 29: Europe Smart Home Devices Market Value (US$ Bn) Forecast, By Price Range, 2016–2031
Table 30: Europe Smart Home Devices Market Volume (Units) Forecast, By Price Range, 2016–2031
Table 31: Europe Smart Home Devices Market Value (US$ Bn) Forecast, By Sales Channel, 2016–2031
Table 32: Europe Smart Home Devices Market Volume (Units) Forecast, By Sales Channel, 2016–2031
Table 33: East Asia Smart Home Devices Market Value (US$ Bn) Forecast, By Country , 2016–2031
Table 34: East Asia Smart Home Devices Market Volume (Units) Forecast, By Country , 2016–2031
Table 35: East Asia Smart Home Devices Market Value (US$ Bn) Forecast, By Product Type, 2016–2031
Table 36: East Asia Smart Home Devices Market Volume (Units) Forecast, By Product Type, 2016–2031
Table 37: East Asia Smart Home Devices Market Value (US$ Bn) Forecast, By Price Range, 2016–2031
Table 38: East Asia Smart Home Devices Market Volume (Units) Forecast, By Price Range, 2016–2031
Table 39: East Asia Smart Home Devices Market Value (US$ Bn) Forecast, By Sales Channel, 2016–2031
Table 40: East Asia Smart Home Devices Market Volume (Units) Forecast, By Sales Channel, 2016–2031
Table 41: South Asia Smart Home Devices Market Value (US$ Bn) Forecast, By Country , 2016–2031
Table 42: South Asia Smart Home Devices Market Volume (Units) Forecast, By Country , 2016–2031
Table 43: South Asia Smart Home Devices Market Value (US$ Bn) Forecast, By Product Type, 2016–2031
Table 44: South Asia Smart Home Devices Market Volume (Units) Forecast, By Product Type, 2016–2031
Table 45: South Asia Smart Home Devices Market Value (US$ Bn) Forecast, By Price Range, 2016–2031
Table 46: South Asia Smart Home Devices Market Volume (Units) Forecast, By Price Range, 2016–2031
Table 47: South Asia Smart Home Devices Market Value (US$ Bn) Forecast, By Sales Channel, 2016–2031
Table 48: South Asia Smart Home Devices Market Volume (Units) Forecast, By Sales Channel, 2016–2031
Table 49: Oceania Smart Home Devices Market Value (US$ Bn) Forecast, By Country , 2016–2031
Table 50: Oceania Smart Home Devices Market Volume (Units) Forecast, By Country , 2016–2031
Table 51: Oceania Smart Home Devices Market Value (US$ Bn) Forecast, By Product Type, 2016–2031
Table 52: Oceania Smart Home Devices Market Volume (Units) Forecast, By Product Type, 2016–2031
Table 53: Oceania Smart Home Devices Market Value (US$ Bn) Forecast, By Price Range, 2016–2031
Table 54: Oceania Smart Home Devices Market Volume (Units) Forecast, By Price Range, 2016–2031
Table 55: Oceania Smart Home Devices Market Value (US$ Bn) Forecast, By Sales Channel, 2016–2031
Table 56: Oceania Smart Home Devices Market Volume (Units) Forecast, By Sales Channel, 2016–2031
Table 57: MEA Smart Home Devices Market Value (US$ Bn) Forecast, By Country , 2016–2031
Table 58: MEA Smart Home Devices Market Volume (Units) Forecast, By Country , 2016–2031
Table 59: MEA Smart Home Devices Market Value (US$ Bn) Forecast, By Product Type, 2016–2031
Table 60: MEA Smart Home Devices Market Volume (Units) Forecast, By Product Type, 2016–2031
Table 61: MEA Smart Home Devices Market Value (US$ Bn) Forecast, By Price Range, 2016–2031
Table 62: MEA Smart Home Devices Market Volume (Units) Forecast, By Price Range, 2016–2031
Table 63: MEA Smart Home Devices Market Value (US$ Bn) Forecast, By Sales Channel, 2016–2031
Table 64: MEA Smart Home Devices Market Volume (Units) Forecast, By Sales Channel, 2016–2031
Find your sweet spots for generating winning opportunities in this market.
Talk to AnalystList of Charts
Figure 01: Global Smart Home Devices Market Value (US$ Bn) Analysis by Product Type, 2016-2031
Figure 02: Global Smart Home Devices Market Volume (Units) Analysis by Product Type, 2016-2031
Figure 03: Global Smart Home Devices Market Y-o-Y Growth (%) Projections, By Product Type, 2021-2031
Figure 04: Global Smart Home Devices Market Attractiveness by Product Type, 2021-2031
Figure 05: Global Smart Home Devices Market Value (US$ Bn) Analysis by Price Range, 2016-2031
Figure 06: Global Smart Home Devices Market Volume (Units) Analysis by Price Range, 2016-2031
Figure 07: Global Smart Home Devices Market Y-o-Y Growth (%) Projections, By Price Range, 2021–2031
Figure 08: Global Smart Home Devices Market Attractiveness by Price Range, 2021-2031
Figure 09: Global Smart Home Devices Market Value (US$ Bn) Analysis by Sales Channel, 2016-2031
Figure 10: Global Smart Home Devices Market Volume (Units) Analysis by Sales Channel, 2016-2031
Figure 11: Global Smart Home Devices Market Y-o-Y Growth (%) Projections, By Sales Channel, 2021-2031
Figure 12: Global Smart Home Devices Market Attractiveness by Sales Channel, 2021-2031
Figure 13: Global Smart Home Devices Market Value (US$ Bn) Analysis by Region, 2016-2031
Figure 14: Global Smart Home Devices Market Volume (Units) Analysis by Region, 2016-2031
Figure 15: Global Smart Home Devices Market Y-o-Y Growth (%) Projections, By Region, 2021-2031
Figure 16: Global Smart Home Devices Market Attractiveness by Region, 2021-2031
Figure 17: North America Smart Home Devices Market Value (US$ Bn) Analysis by Country, 2016-2031
Figure 18: North America Smart Home Devices Market Volume (Units) Analysis by Country, 2016-2031
Figure 19: North America Smart Home Devices Market Y-o-Y Growth (%) Projections, By Country, 2021-2031
Figure 20: North America Smart Home Devices Market Attractiveness by Country, 2021-2031
Figure 21: North America Smart Home Devices Market Value (US$ Bn) Analysis by Product Type, 2016-2031
Figure 22: North America Smart Home Devices Market Volume (Units) Analysis by Product Type, 2016-2031
Figure 23: North America Smart Home Devices Market Y-o-Y Growth (%) Projections, By Product Type, 2021–2031
Figure 24: North America Smart Home Devices Market Attractiveness by Product Type, 2021-2031
Figure 25: North America Smart Home Devices Market Value (US$ Bn) Analysis by Price Range, 2016-2031
Figure 26: North America Smart Home Devices Market Volume (Units) Analysis by Price Range, 2016-2031
Figure 27: North America Smart Home Devices Market Y-o-Y Growth (%) Projections, By Price Range, 2021–2031
Figure 28: North America Smart Home Devices Market Attractiveness by Price Range, 2021-2031
Figure 29: North America Smart Home Devices Market Value (US$ Bn) Analysis by Sales Channel, 2016-2031
Figure 30: North America Smart Home Devices Market Volume (Units) Analysis by Sales Channel, 2016-2031
Figure 31: North America Smart Home Devices Market Y-o-Y Growth (%) Projections, By Sales Channel, 2021–2031
Figure 32: North America Smart Home Devices Market Attractiveness by Sales Channel, 2021-2031
Figure 33: Latin America Smart Home Devices Market Value (US$ Bn) Analysis by Country, 2016-2031
Figure 34: Latin America Smart Home Devices Market Volume (Units) Analysis by Country, 2016-2031
Figure 35: Latin America Smart Home Devices Market Y-o-Y Growth (%) Projections, By Country, 2021–2031
Figure 36: Latin America Smart Home Devices Market Attractiveness by Country, 2021-2031
Figure 37: Latin America Smart Home Devices Market Value (US$ Bn) Analysis by Product Type, 2016-2031
Figure 38: Latin America Smart Home Devices Market Volume (Units) Analysis by Product Type, 2016-2031
Figure 39: Latin America Smart Home Devices Market Y-o-Y Growth (%) Projections, By Product Type, 2021–2031
Figure 40: Latin America Smart Home Devices Market Attractiveness by Product Type, 2021-2031
Figure 41: Latin America Smart Home Devices Market Value (US$ Bn) Analysis by Price Range, 2016-2031
Figure 42: Latin America Smart Home Devices Market Volume (Units) Analysis by Price Range, 2016-2031
Figure 43: Latin America Smart Home Devices Market Y-o-Y Growth (%) Projections, By Price Range, 2021–2031
Figure 44: Latin America Smart Home Devices Market Attractiveness by Price Range, 2021-2031
Figure 45: Latin America Smart Home Devices Market Value (US$ Bn) Analysis by Sales Channel, 2016-2031
Figure 46: Latin America Smart Home Devices Market Volume (Units) Analysis by Sales Channel, 2016-2031
Figure 47: Latin America Smart Home Devices Market Y-o-Y Growth (%) Projections, By Sales Channel, 2021–2031
Figure 48: Latin America Smart Home Devices Market Attractiveness by Sales Channel, 2021-2031
Figure 49: Europe Smart Home Devices Market Value (US$ Bn) Analysis by Country, 2016-2031
Figure 50: Europe Smart Home Devices Market Volume (Units) Analysis by Country, 2016-2031
Figure 51: Europe Smart Home Devices Market Y-o-Y Growth (%) Projections, By Country, 2021–2031
Figure 52: Europe Smart Home Devices Market Attractiveness by Country, 2021-2031
Figure 53: Europe Smart Home Devices Market Value (US$ Bn) Analysis by Product Type, 2016-2031
Figure 54: Europe Smart Home Devices Market Volume (Units) Analysis by Product Type, 2016-2031
Figure 55: Europe Smart Home Devices Market Y-o-Y Growth (%) Projections, By Product Type, 2021–2031
Figure 56: Europe Smart Home Devices Market Attractiveness by Product Type, 2021-2031
Figure 57: Europe Smart Home Devices Market Value (US$ Bn) Analysis by Price Range, 2016-2031
Figure 58: Europe Smart Home Devices Market Volume (Units) Analysis by Price Range, 2016-2031
Figure 59: Europe Smart Home Devices Market Y-o-Y Growth (%) Projections, By Price Range, 2021–2031
Figure 60: Europe Smart Home Devices Market Attractiveness by Price Range, 2021-2031
Figure 61: Europe Smart Home Devices Market Value (US$ Bn) Analysis by Sales Channel, 2016-2031
Figure 62: Europe Smart Home Devices Market Volume (Units) Analysis by Sales Channel, 2016-2031
Figure 63: Europe Smart Home Devices Market Y-o-Y Growth (%) Projections, By Sales Channel, 2021–2031
Figure 64: Europe Smart Home Devices Market Attractiveness by Sales Channel, 2021-2031
Figure 65: East Asia Smart Home Devices Market Value (US$ Bn) Analysis by Country, 2016-2031
Figure 66: East Asia Smart Home Devices Market Volume (Units) Analysis by Country, 2016-2031
Figure 67: East Asia Smart Home Devices Market Y-o-Y Growth (%) Projections, By Country, 2021–2031
Figure 68: East Asia Smart Home Devices Market Attractiveness by Country, 2021-2031
Figure 69: East Asia Smart Home Devices Market Value (US$ Bn) Analysis by Product Type, 2016-2031
Figure 70: East Asia Smart Home Devices Market Volume (Units) Analysis by Product Type, 2016-2031
Figure 71: East Asia Smart Home Devices Market Y-o-Y Growth (%) Projections, By Product Type, 2021–2031
Figure 72: East Asia Smart Home Devices Market Attractiveness by Product Type, 2021-2031
Figure 73: East Asia Smart Home Devices Market Value (US$ Bn) Analysis by Price Range, 2016-2031
Figure 74: East Asia Smart Home Devices Market Volume (Units) Analysis by Price Range, 2016-2031
Figure 75: East Asia Smart Home Devices Market Y-o-Y Growth (%) Projections, By Price Range, 2021–2031
Figure 76: East Asia Smart Home Devices Market Attractiveness by Price Range, 2021-2031
Figure 77: East Asia Smart Home Devices Market Value (US$ Bn) Analysis by Sales Channel, 2016-2031
Figure 78: East Asia Smart Home Devices Market Volume (Units) Analysis by Sales Channel, 2016-2031
Figure 79: East Asia Smart Home Devices Market Y-o-Y Growth (%) Projections, By Sales Channel, 2021–2031
Figure 80: East Asia Smart Home Devices Market Attractiveness by Sales Channel, 2021-2031
Figure 81: South Asia Smart Home Devices Market Value (US$ Bn) Analysis by Country, 2016-2031
Figure 82: South Asia Smart Home Devices Market Volume (Units) Analysis by Country, 2016-2031
Figure 83: South Asia Smart Home Devices Market Y-o-Y Growth (%) Projections, By Country, 2021–2031
Figure 84: South Asia Smart Home Devices Market Attractiveness by Country, 2021-2031
Figure 85: South Asia Smart Home Devices Market Value (US$ Bn) Analysis by Product Type, 2016-2031
Figure 86: South Asia Smart Home Devices Market Volume (Units) Analysis by Product Type, 2016-2031
Figure 87: South Asia Smart Home Devices Market Y-o-Y Growth (%) Projections, By Product Type, 2021–2031
Figure 88: South Asia Smart Home Devices Market Attractiveness by Product Type, 2021-2031
Figure 89: South Asia Smart Home Devices Market Value (US$ Bn) Analysis by Price Range, 2016-2031
Figure 90: South Asia Smart Home Devices Market Volume (Units) Analysis by Price Range, 2016-2031
Figure 91: South Asia Smart Home Devices Market Y-o-Y Growth (%) Projections, By Price Range, 2021–2031
Figure 92: South Asia Smart Home Devices Market Attractiveness by Price Range, 2021-2031
Figure 93: South Asia Smart Home Devices Market Value (US$ Bn) Analysis by Sales Channel, 2016-2031
Figure 94: South Asia Smart Home Devices Market Volume (Units) Analysis by Sales Channel, 2016-2031
Figure 95: South Asia Smart Home Devices Market Y-o-Y Growth (%) Projections, By Sales Channel, 2021–2031
Figure 96: South Asia Smart Home Devices Market Attractiveness by Sales Channel, 2021-2031
Figure 97: Oceania Smart Home Devices Market Value (US$ Bn) Analysis by Country, 2016-2031
Figure 98: Oceania Smart Home Devices Market Volume (Units) Analysis by Country, 2016-2031
Figure 99: Oceania Smart Home Devices Market Y-o-Y Growth (%) Projections, By Country, 2021–2031
Figure 100: Oceania Smart Home Devices Market Attractiveness by Country, 2021-2031
Figure 101: Oceania Smart Home Devices Market Value (US$ Bn) Analysis by Product Type, 2016-2031
Figure 102: Oceania Smart Home Devices Market Volume (Units) Analysis by Product Type, 2016-2031
Figure 103: Oceania Smart Home Devices Market Y-o-Y Growth (%) Projections, By Product Type, 2021–2031
Figure 104: Oceania Smart Home Devices Market Attractiveness by Product Type, 2021-2031
Figure 105: Oceania Smart Home Devices Market Value (US$ Bn) Analysis by Price Range, 2016-2031
Figure 106: Oceania Smart Home Devices Market Volume (Units) Analysis by Price Range, 2016-2031
Figure 107: Oceania Smart Home Devices Market Y-o-Y Growth (%) Projections, By Price Range, 2021–2031
Figure 108: Oceania Smart Home Devices Market Attractiveness by Price Range, 2021-2031
Figure 109: Oceania Smart Home Devices Market Value (US$ Bn) Analysis by Sales Channel, 2016-2031
Figure 110: Oceania Smart Home Devices Market Volume (Units) Analysis by Sales Channel, 2016-2031
Figure 111: Oceania Smart Home Devices Market Y-o-Y Growth (%) Projections, By Sales Channel, 2021–2031
Figure 112: Oceania Smart Home Devices Market Attractiveness by Sales Channel, 2021-2031
Figure 113: MEA Smart Home Devices Market Value (US$ Bn) Analysis by Country, 2016-2031
Figure 114: MEA Smart Home Devices Market Volume (Units) Analysis by Country, 2016-2031
Figure 115: MEA Smart Home Devices Market Y-o-Y Growth (%) Projections, By Country, 2021–2031
Figure 116: MEA Smart Home Devices Market Attractiveness by Country, 2021-2031
Figure 117: MEA Smart Home Devices Market Value (US$ Bn) Analysis by Product Type, 2016-2031
Figure 118: MEA Smart Home Devices Market Volume (Units) Analysis by Product Type, 2016-2031
Figure 119: MEA Smart Home Devices Market Y-o-Y Growth (%) Projections, By Product Type, 2021–2031
Figure 120: MEA Smart Home Devices Market Attractiveness by Product Type, 2021-2031
Figure 121: MEA Smart Home Devices Market Value (US$ Bn) Analysis by Price Range, 2016-2031
Figure 122: MEA Smart Home Devices Market Volume (Units) Analysis by Price Range, 2016-2031
Figure 123: MEA Smart Home Devices Market Y-o-Y Growth (%) Projections, By Price Range, 2021–2031
Figure 124: MEA Smart Home Devices Market Attractiveness by Price Range, 2021-2031
Figure 125: MEA Smart Home Devices Market Value (US$ Bn) Analysis by Sales Channel, 2016-2031
Figure 126: MEA Smart Home Devices Market Volume (Units) Analysis by Sales Channel, 2016-2031
Figure 127: MEA Smart Home Devices Market Y-o-Y Growth (%) Projections, By Sales Channel, 2021–2031
Figure 128: MEA Smart Home Devices Market Attractiveness by Sales Channel, 2021-2031
Need specific information?
Request CustomizationExplore Consumer Product Insights
View Reports