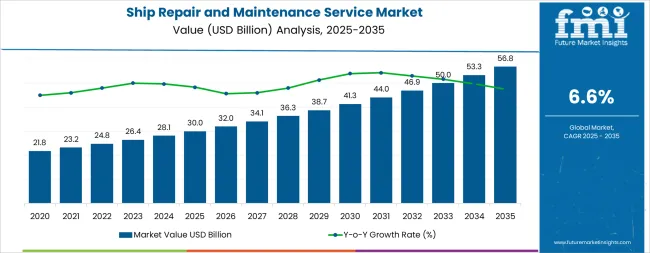
The global ship repair and maintenance service market is projected to reach USD 56.8 billion by 2035, recording an absolute increase of USD 26.8 billion over the forecast period. The market is valued at USD 30 billion in 2025 and is set to rise at a CAGR of 6.6% during the assessment period. The overall market size is expected to grow by nearly 1.9 times during the same period, supported by increasing demand for maritime trade and the need to maintain aging fleets worldwide, driving demand for efficient repair and maintenance systems and increasing investments in fleet modernization and maritime infrastructure projects globally. However, rising labor costs and complex environmental standards may pose challenges to market expansion.
| Metric | Value |
|---|---|
| Market Value (2025) | USD 30.0 billion |
| Market Forecast Value (2035) | USD 56.8 billion |
| Forecast CAGR (2025-2035) | 6.6% |
Between 2025 and 2030, the ship repair and maintenance service market is projected to expand from USD 30 billion to USD 42.1 billion, resulting in a value increase of USD 12.1 billion, which represents 45.1% of the total forecast growth for the decade. This phase of development will be shaped by rising demand for maritime transport and commercial fleet expansion, product innovation in repair technologies and high-capacity maintenance systems, as well as expanding integration with environmental compliance and fleet modernization initiatives. Companies are establishing competitive positions through investment in advanced repair technologies, corrosion-resistant solutions, and strategic market expansion across shipping, offshore energy, and maritime logistics applications.
From 2030 to 2035, the market is forecast to grow from USD 42.1 billion to USD 56.8 billion, adding another USD 14.7 billion, which constitutes 54.9% of the overall ten-year expansion. This period is expected to be characterized by the expansion of specialized repair systems, including advanced high-capacity formulations and integrated maintenance solutions tailored for specific vessel requirements, strategic collaborations between shipyard operators and maritime industries, and an enhanced focus on operational efficiency and environmental compliance. The growing emphasis on fleet optimization and advanced maintenance processes will drive demand for comprehensive, high-performance repair and maintenance solutions across diverse maritime applications.
The ship repair and maintenance service market grows by enabling maritime operators to achieve superior operational efficiency and fleet reliability across commercial shipping facilities, ranging from small-scale regional fleets to mega shipping complexes. Maritime operators face mounting pressure to improve operational efficiency and regulatory compliance, with repair and maintenance solutions typically providing 30-40% improvement in fleet uptime compared to conventional maintenance systems, making advanced repair services essential for competitive maritime operations. The shipping industry's need for maximum fleet availability creates demand for advanced maintenance solutions that can minimize downtime, enhance durability, and ensure consistent performance across diverse operational conditions. Government initiatives promoting maritime safety and fleet modernization drive adoption in commercial shipping, offshore operations, and logistics applications, where operational performance has a direct impact on efficiency and regulatory compliance. However, raw material price volatility and the complexity of achieving consistent performance across different vessel types may limit adoption rates among cost-sensitive operators and developing regions with limited technical expertise.
The market is segmented by vessel type, service, and region. By vessel type, the market is divided into oil and chemical tankers, bulk carriers, general cargo, container ships, gas carriers, offshore vessels, passenger ships and ferries, and mega yachts and other vessels. Based on service, the market is categorized into general services, dockage, hull part, engine parts, electric works, and auxiliary services. Regionally, the market is divided into North America, Latin America, Western Europe, Eastern Europe, East Asia, South Asia Pacific, and Middle East & Africa.
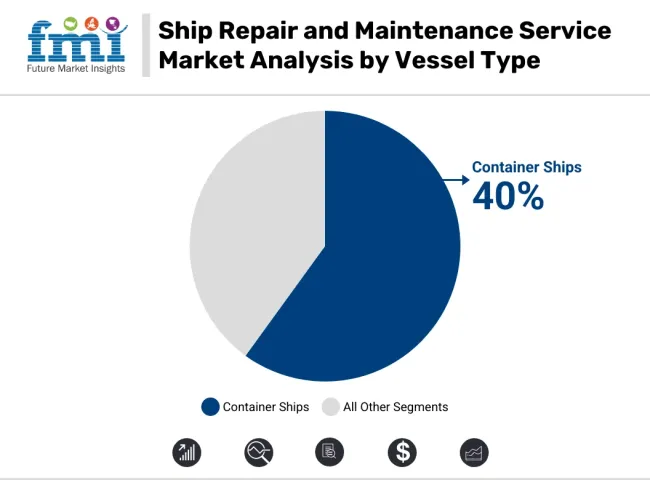
The container ships segment represents the dominant force in the ship repair and maintenance service market, capturing approximately 40.0% of total market share in 2025. This advanced vessel category encompasses formulations featuring superior operational characteristics, including enhanced cargo capacity and optimized performance combinations that enable superior operational durability and enhanced efficiency characteristics. The container ships segment's market leadership stems from its exceptional role in global trade operations, with vessels capable of handling high-volume cargo operations while maintaining consistent performance and operational reliability across diverse shipping routes.
The bulk carriers segment maintains a substantial market share, serving operators who require cost-effective maintenance solutions for standard cargo applications. These vessels offer reliable performance for general-purpose shipping applications while providing sufficient durability to meet basic performance requirements in maritime transport and logistics applications.
Key technological advantages driving the container ships segment include:
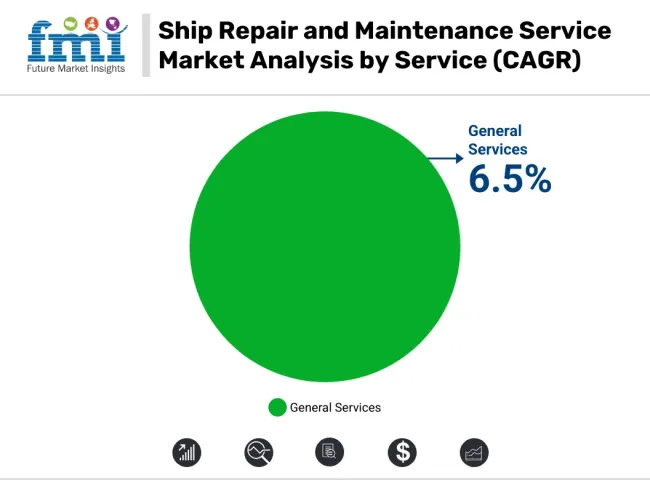
General Services applications dominate the ship repair and maintenance service market with approximately 35% market share in 2025, reflecting the critical role of routine maintenance in serving maritime fleet demand and supporting operational efficiency initiatives. The general services segment's market leadership is reinforced by increasing fleet maintenance requirements, standardized repair procedures, and rising demand for cost-effective maintenance optimization that directly correlates with operational flexibility and fleet responsiveness.
The hull part segment represents the second-largest service category, capturing significant market share through specialized requirements for structural maintenance, major repair operations, and high-intensity maintenance procedures. This segment benefits from growing demand for structural integrity services that meet stringent durability, performance, and safety requirements in demanding maritime applications.
The engine parts segment accounts for substantial market share, serving operators requiring specialized propulsion system solutions. The electric works segment captures market share through advanced electrical system applications, while other service ranges represent specialized market segments.
Key market dynamics supporting service growth include:
The market is driven by three concrete demand factors tied to maritime and operational optimization outcomes. First, global maritime trade growth and fleet expansion create increasing demand for high-performance repair and maintenance solutions, with global seaborne trade projected to continue expanding, requiring specialized service solutions for maximum operational efficiency. Second, modernization of aging vessel fleets and regulatory compliance drive the adoption of superior maintenance technologies, with operators seeking 30-40% improvement in fleet availability and regulatory compliance enhancement. Third, technological advancements in repair technologies and corrosion-resistant solutions enable more effective and durable maintenance systems that reduce downtime requirements while improving long-term performance and cost-effectiveness.
Market restraints include raw material price volatility that can impact service costs and profitability margins, particularly during periods of supply chain disruption or commodity price fluctuations affecting key steel and specialty component costs. Regulatory complexity in environmental compliance poses another significant challenge, as achieving consistent performance standards across different vessel types and regulatory frameworks requires specialized expertise and quality control systems, potentially causing project delays and increased maintenance costs. Technical complexity in system integration and customization requirements create additional challenges for service providers, demanding ongoing investment in technical capabilities and compliance with varying regional maritime standards.
Key trends indicate accelerated adoption in emerging markets, particularly China, India, and Southeast Asia, where rapid maritime infrastructure development and fleet capacity expansion drive comprehensive repair and maintenance system development. Technology advancement trends toward digital integration with enhanced predictive maintenance, process optimization, and multi-functional service capabilities enable next-generation service development that addresses multiple performance requirements simultaneously. The market thesis could face disruption if alternative maritime technologies or significant changes in shipping practices minimize reliance on traditional vessel maintenance solutions.
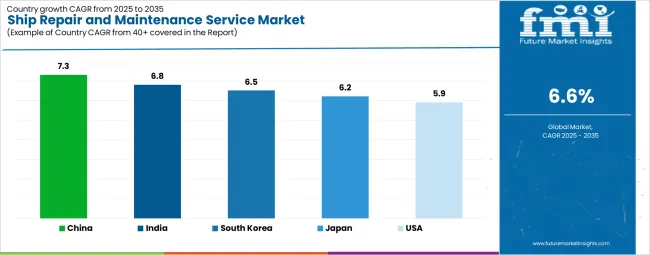
| Country | CAGR (2025-2035) |
|---|---|
| China | 7.3% |
| India | 6.8% |
| South Korea | 6.5% |
| Japan | 6.2% |
| United States | 5.9% |
The ship repair and maintenance service market is gaining momentum worldwide, with China taking the lead thanks to massive maritime infrastructure expansion and government-backed fleet modernization programs. Close behind, India benefits from growing maritime trade and port development initiatives, positioning itself as a strategic growth hub in the Asian region. South Korea shows steady advancement, where integration of advanced shipbuilding technologies strengthens its role in the global maritime supply chain. Japan is focusing on fleet modernization and maritime technology development, signaling an ambition to capitalize on growing opportunities in Pacific maritime markets. Meanwhile, United States stands out for its advanced maritime technology development in existing fleet applications, recording consistent progress in maritime operational advancement. Together, China and India anchor the global expansion story, while the rest build stability and diversity into the market's growth path.
The report covers an in-depth analysis of 40+ countries top-performing countries are highlighted below.
China demonstrates the strongest growth potential in the Ship Repair and Maintenance Service Market with a CAGR of 7.3% through 2035. The country's leadership position stems from massive maritime infrastructure projects, government-backed maritime development programs, and aggressive fleet modernization targets, driving the adoption of high-performance repair and maintenance systems. Growth is concentrated in major maritime regions, including Shanghai, Guangdong, Jiangsu, and Shandong, where shipyard operators and maritime companies are implementing advanced maintenance solutions for enhanced operational performance and international competitiveness. Distribution channels through established service providers and direct shipyard relationships expand deployment across commercial shipping facilities and maritime processing centers. The country's maritime leadership strategy provides policy support for advanced maintenance development, including high-performance service system adoption.
Key market factors:
In Mumbai, Chennai, Kolkata, and Kochi, the adoption of ship repair and maintenance systems is accelerating across maritime facilities and commercial shipping centers, driven by port modernization targets and government maritime development initiatives. The market demonstrates strong growth momentum with a CAGR of 6.8% through 2035, linked to comprehensive maritime capacity expansion and increasing focus on operational competitiveness solutions. Indian operators are implementing advanced maintenance systems and quality control platforms to enhance operational performance while meeting growing demand for maritime services in domestic and international markets. The country's maritime development programs create continued demand for high-performance maintenance solutions, while increasing emphasis on local capabilities drives adoption of advanced technologies and operational systems.
Advanced maritime industry in South Korea demonstrates sophisticated implementation of ship repair and maintenance systems, with documented case studies showing efficiency improvements in fleet applications through optimized maintenance solutions. The country's maritime infrastructure in major shipbuilding centers, including Busan, Ulsan, Geoje, and Mokpo, showcases integration of advanced maintenance technologies with existing operational systems, leveraging expertise in shipbuilding and precision manufacturing. Korean operators emphasize quality standards and operational compliance, creating demand for high-performance maintenance solutions that support efficiency initiatives and regulatory requirements. The market maintains steady growth through focus on maritime innovation and operational competitiveness, with a CAGR of 6.5% through 2035.
Key development areas:
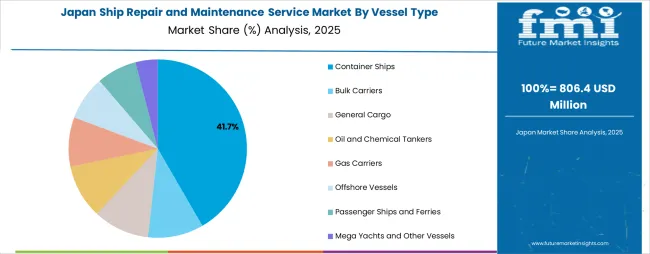
Market expansion in Japan is driven by diverse maritime demand, including fleet maintenance in Tokyo and Yokohama regions, shipbuilding development in Nagasaki and Hiroshima, and comprehensive maritime modernization across multiple coastal areas. The country demonstrates promising growth potential with a CAGR of 6.2% through 2035, supported by national maritime programs and regional infrastructure development initiatives. Japanese operators face implementation challenges related to technology integration and operational efficiency requirements, requiring maintenance upgrade approaches and international partnership support. However, growing maritime targets and operational competitiveness requirements create compelling business cases for repair and maintenance system adoption, particularly in commercial shipping regions where performance optimization has a direct impact on maritime competitiveness.
Market characteristics:
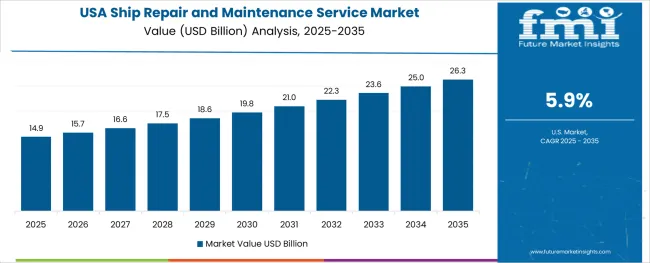
United States market leads in advanced maritime innovation based on integration with next-generation fleet technologies and sophisticated maintenance applications for enhanced performance characteristics. The country shows solid potential with a CAGR of 5.9% through 2035, driven by maritime modernization programs and advanced operational initiatives across major maritime regions, including Gulf Coast, West Coast, East Coast, and Great Lakes. American operators are adopting advanced maintenance systems for operational optimization and regulatory compliance, particularly in regions with maritime mandates and advanced processing facilities requiring superior performance differentiation. Technology deployment channels through established service distributors and direct operator relationships expand coverage across commercial shipping and maritime processing facilities.
Leading market segments:
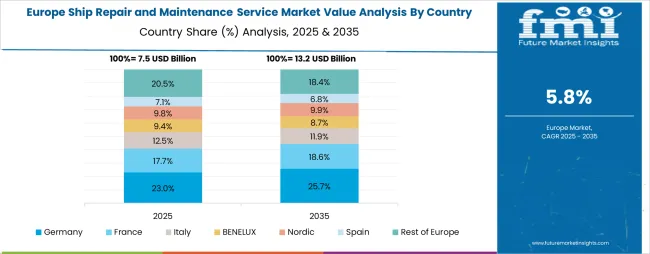
The ship repair and maintenance service market in Europe is projected to grow from USD 6.8 billion in 2025 to USD 11.2 billion by 2035, registering a CAGR of 5.1% over the forecast period. Germany is expected to maintain its leadership position with a 26.5% market share in 2025, declining slightly to 26.1% by 2035, supported by its extensive maritime infrastructure and major shipbuilding centers, including Hamburg, Bremen, and coastal production facilities.
United Kingdom follows with a 24.2% share in 2025, projected to reach 24.6% by 2035, driven by comprehensive maritime development programs and advanced maintenance initiatives implementing repair technologies. Italy holds a 18.4% share in 2025, expected to maintain 18.0% by 2035 through ongoing maritime facility upgrades and shipbuilding technology development. Netherlands commands a 14.8% share, while France accounts for 9.7% in 2025. The Rest of Europe region is anticipated to gain momentum, expanding its collective share from 6.4% to 7.6% by 2035, attributed to increasing ship repair adoption in Nordic countries and emerging Eastern European maritime facilities implementing advanced maintenance programs.
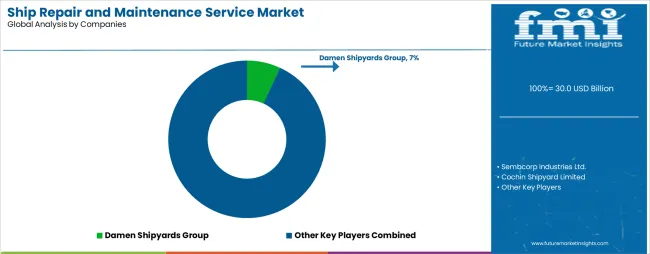
The ship repair and maintenance service market features approximately 15-20 meaningful players with moderate concentration, where the top three companies control roughly 32-38% of global market share through established service platforms and extensive maritime industry relationships. Competition centers on operational reliability, service quality, and technical expertise rather than price competition alone.
Market leaders include Damen Shipyards Group, China Shipbuilding Industry Corporation, and Sembcorp Industries Ltd., which maintain competitive advantages through comprehensive maritime solution portfolios, global facility networks, and deep expertise in the commercial shipping and offshore sectors, creating high switching costs for customers. These companies leverage research and development capabilities and ongoing technical support relationships to defend market positions while expanding into adjacent maritime and industrial applications.
Challengers encompass Fincantieri S.p.A. and Cochin Shipyard Limited, which compete through specialized maintenance solutions and strong regional presence in key maritime markets. Technology specialists, including Hyundai Mipo Dockyards Co. Ltd., Dae Sun Shipbuilding & Engineering Co. Ltd., and Arab Shipbuilding and Repair Yard Company, focus on specific vessel configurations or vertical applications, offering differentiated capabilities in maintenance technology, customization services, and specialized performance characteristics.
Regional players and emerging service providers create competitive pressure through cost-effective solutions and rapid customization capabilities, particularly in high-growth markets including China, India, and Southeast Asia, where local presence provides advantages in customer service and regulatory compliance. Market dynamics favor companies that combine advanced maintenance technologies with comprehensive technical support offerings that address the complete service lifecycle from initial assessment through ongoing operational optimization.
Ship repair and maintenance services represent specialized maritime operations that enable operators to achieve 30-40% improvement in fleet availability compared to conventional maintenance systems, delivering superior operational performance and downtime reduction with enhanced reliability capabilities in demanding commercial shipping applications. With the market projected to grow from USD 30 billion in 2025 to USD 56.8 billion by 2035 at a 6.6% CAGR, these services offer compelling advantages - enhanced fleet efficiency, customizable maintenance configurations, and operational durability - making them essential for commercial shipping applications, offshore operations, and maritime facilities seeking alternatives to inefficient maintenance systems that compromise performance through excessive downtime. Scaling market adoption and technological advancement requires coordinated action across maritime policy, operational standards development, service providers, shipping industries, and maritime technology investment capital.
How Governments Could Spur Local Production and Adoption?
How Industry Bodies Could Support Market Development?
How OEMs and Technology Players Could Strengthen the Ecosystem?
How Suppliers Could Navigate the Shift?
How Investors and Financial Enablers Could Unlock Value?
| Items | Values |
|---|---|
| Quantitative Units | USD 30.0 Billion |
| Vessel Type | Oil and Chemical Tankers, Bulk Carriers, General Cargo, Container Ships, Gas Carriers, Offshore Vessels, Passenger Ships and Ferries, Mega Yachts and Other Vessels |
| Service | General Services, Dockage, Hull Part, Engine Parts, Electric Works, Auxiliary Services |
| Regions Covered | North America, Latin America, Western Europe, Eastern Europe, East Asia, South Asia Pacific, Middle East & Africa |
| Country Covered | China, India, South Korea, Japan, United States, and 40+ countries |
| Key Companies Profiled | Damen Shipyards Group, Sembcorp Industries Ltd., Cochin Shipyard Limited, China Shipbuilding Industry Corporation, Fincantieri S.p.A., Dae Sun Shipbuilding & Engineering Co. Ltd., Hyundai Mipo Dockyards Co. Ltd., Arab Shipbuilding and Repair Yard Company |
| Additional Attributes | Dollar sales by vessel type and service categories, regional adoption trends across Asia-Pacific, East Asia, and South Asia Pacific, competitive landscape with service providers and technology integrators, maritime facility requirements and specifications, integration with fleet initiatives and shipping systems, innovations in maintenance technology and service systems, and development of specialized configurations with performance and durability capabilities. |
The global ship repair and maintenance service market is estimated to be valued at USD 30.0 billion in 2025.
The market size for the ship repair and maintenance service market is projected to reach USD 56.8 billion by 2035.
The ship repair and maintenance service market is expected to grow at a 6.6% CAGR between 2025 and 2035.
The key product types in ship repair and maintenance service market are container ships, bulk carriers, general cargo, oil and chemical tankers, gas carriers, offshore vessels, passenger ships and ferries and mega yachts and other vessels.
In terms of service, general services segment to command 35.0% share in the ship repair and maintenance service market in 2025.


Full Research Suite comprises of:
Market outlook & trends analysis
Interviews & case studies
Strategic recommendations
Vendor profiles & capabilities analysis
5-year forecasts
8 regions and 60+ country-level data splits
Market segment data splits
12 months of continuous data updates
DELIVERED AS:
PDF EXCEL ONLINE
Ship Anchor Market Size and Share Forecast Outlook 2025 to 2035
Shipping Label Market Size and Share Forecast Outlook 2025 to 2035
Shipping Supply Market Size and Share Forecast Outlook 2025 to 2035
Ship Plate Market Size and Share Forecast Outlook 2025 to 2035
Ship Pod Drives Market Size and Share Forecast Outlook 2025 to 2035
Shipping Tapes Market Size and Share Forecast Outlook 2025 to 2035
Shipping Mailers Market Size and Share Forecast Outlook 2025 to 2035
Shipping Container Market Size, Share & Forecast 2025 to 2035
Leading Providers & Market Share in Shipping Tapes
Competitive Breakdown of Shipping Mailers Manufacturers
Ship Rudders Market
Ship Bridge Simulator Market
PUR Shippers Market Size and Share Forecast Outlook 2025 to 2035
EPS Shippers Market Size and Share Forecast Outlook 2025 to 2035
Jug Shipper Market
Cargo Shipping Market Size and Share Forecast Outlook 2025 to 2035
Leadership Development Program Market Analysis - Size, Share, and Forecast 2025 to 2035
Examining Market Share Trends in Leadership Development Programs
Bottle Shippers Market Size and Share Forecast Outlook 2025 to 2035
Pallet Shippers Market Size and Share Forecast Outlook 2025 to 2035

Thank you!
You will receive an email from our Business Development Manager. Please be sure to check your SPAM/JUNK folder too.
Chat With
MaRIA