Reports

- Global Locations -

Headquarters

Future Market Insights, Inc.

Christiana Corporate, 200
Continental Drive, Suite 401,
Newark, Delaware - 19713,
United States

T: +1-845-579-5705

Americas

Future Market Insights, Inc.

616 Corporate Way, Suite 2-9018,
Valley Cottage, NY 10989, United States

T: +1-347-918-3531

MEA

Future Market Insights

1602-6 Jumeirah Bay X2 Tower, Plot No: JLT-PH2-X2A,
Jumeirah Lakes Towers, Dubai,
United Arab Emirates

Europe

Future Market Insights

3rd Floor, 207 Regent Street,
W1B 3HH London
United Kingdom

T: + 44 (0) 20 8123 9659
D: +44 (0) 20 3287 4268

Asia Pacific

Future Market Insights

IndiaLand Global Tech Park, Unit UG-1, Behind Grand HighStreet, Phase 1, Hinjawadi, MH, Pune – 411057, India

PUR Shippers Market Snapshot (2022-2032)

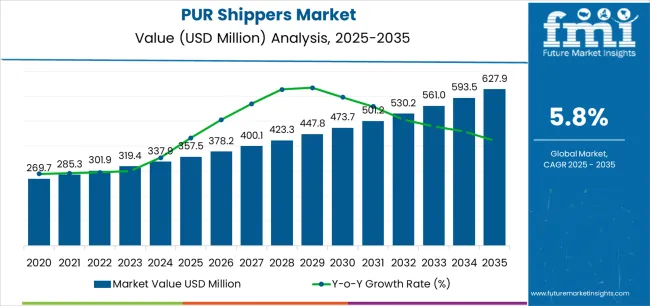
[250 Pages Report] The global PUR shippers market size is expected to reach US$ 9.3 Billion in 2022 and US$ 15.7 Billion in 2032. It is likely to exhibit growth at a CAGR of 6.2% in the forecast period from 2022 to 2032. The surging demand for temperature-controlled packaging solutions in various parts of the globe is set to bolster the sales of PUR shippers in the future years.

Report Attribute Details
PUR Shippers Market Estimated Base Year Value (2021) US$ 8.4 Billion
PUR Shippers Market Expected Market Value (2022) US$ 9.3 Billion
PUR Shippers Market Anticipated Forecast Value (2032) US$ 15.7 Billion
PUR Shippers Market Projected Growth Rate (2022 to 2032) 6.2% CAGR

Polyurethane (PUR) shippers are referred to as shipping coolers that can provide protection from the bruises and bumps of the road, as well as deliver greater insulating power. Commonly known as cold shipping boxes, PUR shippers are capable of protecting temperature-sensitive products during delivery and transportation.

The emergence of Expanded Polystyrene (EPS) shippers that can provide safety without leaching harmful chemicals during disposal or usage is a major factor that is likely to bode well for the global market. As compared to an equivalent-thickness EPS container, PUR shippers offer greater insulating power.

PUR is stable and more consistent than other materials, which helps in lowering the risk of excursions and product failures. The physical properties of PUR are ideal for heavy payloads under the closed distribution loop program. It also helps in protecting various products from extreme environmental conditions and transit shock.

Don't pay for what you don't need

Customize your report by selecting specific countries or regions and save 30%!

Which are Some Prominent Drivers Spearheading PUR Shippers Market Growth

The increasing usage of smartphones and the internet is expected to drive the e-commerce industry worldwide. High technological awareness among customers is anticipated to influence the demand for PUR shippers in the forthcoming years. The ongoing development of 4G and 5G technology owing to the importance of faster browsing is another crucial factor that is set to augur well for the global market.

Besides, the rapid development of new PUR shippers by reputed companies that are equipped with temperature sensors and can instantly detect if the container was opened during transportation, is set to propel the growth in this market. The urgent need to improve the handling of temperature-sensitive products is also expected to augment the growth.

What are the Challenges Faced by the PUR Shippers Industry

The high cost of temperature-controlled packaging solutions is a major concern for small-scale manufacturers. In developing countries, many emerging pharmaceutical companies may not afford these costly shippers for the transportation of crucial drugs and other related products. Spurred by the aforementioned factors, the PUR shippers market growth may be hampered in the evaluation period.

Ismail Sutaria
Ismail Sutaria

Principal Consultant

Talk to Analyst

Find your sweet spots for generating winning opportunities in this market.

Why is North America Emerging as an Opportunistic PUR Shippers Market

North America is projected to remain at the forefront in terms of the PUR shippers market share in the assessment period. The presence of a well-established pharmaceutical industry in the U.S. is estimated to accelerate the growth in the regional market.

The entry of multiple large- and small-scale PUR shipper manufacturers in Canada is another vital factor that is likely to spur the North America market. In addition to that, the rising demand for reusable packaging solutions for reducing the carbon footprint is expected to drive the growth.

How is Asia Pacific Contributing to Growth of the PUR Shippers Market

Asia Pacific is anticipated to remain in the second position after North America in future years. This growth is attributable to the ongoing development of the e-commerce sector in emerging economies, such as China and India. The high disposable income of people is one of the significant factors that is contributing to the growth of this sector.

The demand for PUR shippers is likely to surge at a steady pace across Asia Pacific backed by the increasing need for sturdy packaging solutions. Many companies based in Japan and South Korea are also aiming to develop reformulated versions of conventional PUR shippers that are lightweight and provide superior insulation.

Get the data you need at a Fraction of the cost

Personalize your report by choosing insights you need
and save 40%!

Market Competition

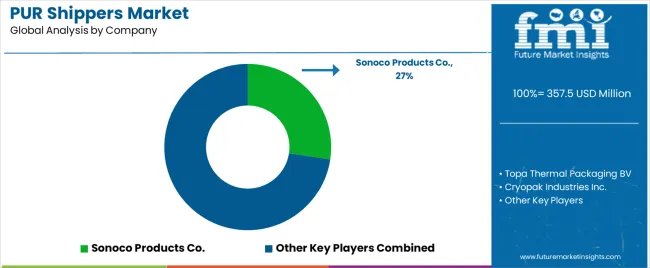
Some of the leading companies present in the global PUR shippers market include American Aerogel Corporation, Sonoco Products Co., Topa Thermal Packaging BV, Sintex Plastics Technology Limited, Jarden Life Sciences, Cryopak Industries Inc., Tempack Packaging Solutions, S.L., Cold Chain Technologies, Inc., Chill-Pak, Sofrigam SA, Pelican BioThermal LLC, ACH Foam Technologies, and Mesa Laboratories, Inc. among others.

Majority of the leading players operating in the global market are increasingly focusing on mergers and acquisitions with start-up companies and local firms to co-develop new products and cater to the surging demand from various end-use industries. Meanwhile, a few other key players are engaging in partnerships and new product launches to expand their existing portfolios and gain a competitive advantage in the global market.

Report Scope

Report Attribute Details
Growth Rate CAGR of 6.2% from 2022 to 2032
Base Year for Estimation 2021
Historical Data 2015 to 2020
Forecast Period 2022 to 2032
Quantitative Units Revenue in USD Million, Volume in Kilotons and CAGR from 2022 to 2032
Report Coverage Revenue Forecast, Volume Forecast, Company Ranking, Competitive Landscape, Growth Factors, Trends and Pricing Analysis
Segments Covered
  • Application
  • Capacity
  • End Use
  • Region
Regions Covered
  • North America
  • Latin America
  • Western Europe
  • Eastern Europe
  • APEJ
  • Japan
  • Middle East and Africa
Key Countries Profiled
  • USA
  • Canada
  • Brazil
  • Argentina
  • Germany
  • UK
  • France
  • Spain
  • Italy
  • Nordics
  • BENELUX
  • Australia & New Zealand
  • China
  • India
  • ASEAN
  • GCC
  • South Africa
Key Companies Profiled
  • American Aerogel Corporation
  • Sonoco Products Co.
  • Topa Thermal Packaging BV
  • Sintex Plastics Technology Limited
  • Jarden Life Sciences
  • Cryopak Industries Inc.
  • Tempack Packaging Solutions, S.L.
  • Cold Chain Technologies, Inc.
  • Chill-Pak
  • Sofrigam SA
  • Pelican BioThermal LLC
  • ACH Foam Technologies
  • Mesa Laboratories, Inc.
Customization Available Upon Request

Key Segments Profiled in the PUR Shippers Industry Survey

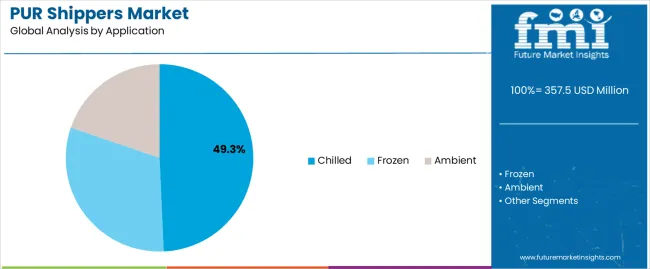
By Application:

  • Frozen
  • Ambient
  • Chilled

By Capacity:

  • Less than 5 Liters
  • 5 Liters to 10 Liters
  • 10 Liters to 15 Liters
  • 15 Liters & Above

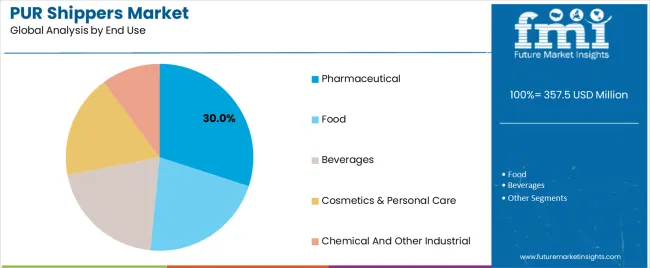
By End Use:

  • Pharmaceutical & Healthcare
  • Clinical Samples
  • Serum
  • Blood
  • Chemicals & Agro Chemical
  • Food & Beverage
  • Industrial
  • Others

By Region:

  • North America
  • Latin America
  • Western Europe
  • Eastern Europe
  • APEJ
  • Japan
  • Middle East and Africa

Frequently Asked Questions

At what rate will the PUR shippers market grow?

The global PUR shippers market is anticipated to surpass US$ 15.7 Billion in 2032.

Which region is set to lead the PUR shippers market?

North America is set to lead the PUR shippers market in the forecast period.

Which are some of the renowned companies in the PUR shippers market?

American Aerogel Corporation, Sonoco Products Co., Topa Thermal Packaging BV, Sintex Plastics Technology Limited, and Jarden Life Sciences are some of the renowned companies in the PUR shippers market.

Table of Content

1. Executive Summary

    1.1. Global Market Outlook

    1.2. Demand-side Trends

    1.3. Supply-side Trends

    1.4. Technology Roadmap Analysis

    1.5. Analysis and Recommendations

2. Market Overview

    2.1. Market Coverage / Taxonomy

    2.2. Market Definition / Scope / Limitations

3. Market Background

    3.1. Market Dynamics

        3.1.1. Drivers

        3.1.2. Restraints

        3.1.3. Opportunity

        3.1.4. Trends

    3.2. Impact of Covid-19

        3.2.1. Demand in Optimistic Scenario

        3.2.2. Demand in Likely Scenario

        3.2.3. Demand in Conservative Scenario

    3.3. Macro Factors and Forecast Factors

    3.4. Value Chain Analysis

        3.4.1. Profit Margin Analysis

        3.4.2. Raw Material Suppliers

        3.4.3. Manufacturers, Wholesalers and Distributors

        3.4.4. End Users/ Customers

    3.5. Regional Parent Market Outlook

    3.6. Production and Consumption Statistics

    3.7. Global Average Pricing Analysis Benchmark

4. Global PUR Shippers Market Analysis 2015-2021 and Forecast, 2022-2032

    4.1. Historical Market Size Value (US$ Mn) & Volume (Units) Analysis, 2015-2021

    4.2. Current and Future Market Size Value (US$ Mn) & Volume (Units) Projections, 2022-2032

        4.2.1. Y-o-Y Growth Trend Analysis

        4.2.2. Absolute $ Opportunity Analysis

5. Global PUR Shippers Market Analysis 2015–2021 and Forecast 2022–2032, By Product Type

    5.1. Introduction / Key Findings

    5.2. Historical Market Size Value (US$ Mn) & Volume (Units) Analysis by Product Type, 2015-2021

    5.3. Current and Future Market Size Value (US$ Mn) & Volume (Units) Analysis and Forecast by Product Type, 2022-2032

        5.3.1. Collapsible

        5.3.2. Non-collapsible

    5.4. Y-o-Y Growth Trend Analysis by Product Type, 2015-2021

    5.5. Absolute $ Opportunity Analysis by Product Type, 2022-2032

6. Global PUR Shippers Market Analysis 2015–2021 and Forecast 2022–2032, By Application

    6.1. Introduction / Key Findings

    6.2. Historical Market Size Value (US$ Mn) & Volume (Units) Analysis by Application, 2015-2021

    6.3. Current and Future Market Size Value (US$ Mn) & Volume (Units) Analysis and Forecast by Application, 2022-2032

        6.3.1. Frozen

        6.3.2. Chilled

        6.3.3. Ambient

    6.4. Y-o-Y Growth Trend Analysis by Application, 2015-2021

    6.5. Absolute $ Opportunity Analysis by Application, 2022-2032

7. Global PUR Shippers Market Analysis 2015–2021 and Forecast 2022–2032, By End Use

    7.1. Introduction / Key Findings

    7.2. Historical Market Size Value (US$ Mn) & Volume (Units) Analysis by End Use, 2015-2021

    7.3. Current and Future Market Size Value (US$ Mn) & Volume (Units) Analysis and Forecast by End Use, 2022-2032

        7.3.1. Food & Beverage

        7.3.2. Pharmaceuticals

        7.3.3. Chemical

        7.3.4. Agriculture

    7.4. Y-o-Y Growth Trend Analysis by End Use, 2015-2021

    7.5. Absolute $ Opportunity Analysis by End Use, 2022-2032

8. Global PUR Shippers Market Analysis 2015–2021 and Forecast 2022–2032, By Region

    8.1. Introduction / Key Findings

    8.2. Historical Market Size Value (US$ Mn) & Volume (Units) Analysis by Region, 2015-2021

    8.3. Current and Future Market Size Value (US$ Mn) & Volume (Units) Analysis and Forecast by Region, 2022-2032

        8.3.1. North America

        8.3.2. Latin America

        8.3.3. Europe

        8.3.4. East Asia

        8.3.5. South Asia

        8.3.6. Oceania

        8.3.7. Middle East and Africa (MEA)

    8.4. Market Attractiveness Analysis, by Region

9. North America PUR Shippers Market Analysis 2015–2021 and Forecast 2022–2032, By Country

    9.1. Historical Market Size Value (US$ Mn) & Volume (Units) Trend Analysis by Market Taxonomy, 2015-2021

    9.2. Market Size Value (US$ Mn) & Volume (Units) Forecast by Market Taxonomy, 2022-2032

        9.2.1. By Country

            9.2.1.1. U.S.

            9.2.1.2. Canada

        9.2.2. By Product Type

        9.2.3. By Application

        9.2.4. By End Use

    9.3. Market Attractiveness Analysis

        9.3.1. By Country

        9.3.2. By Product Type

        9.3.3. By Application

        9.3.4. By End Use

    9.4. Key Takeaways

10. Latin America PUR Shippers Market Analysis 2015–2021 and Forecast 2022–2032, By Country

    10.1. Historical Market Size Value (US$ Mn) & Volume (Units) Trend Analysis by Market Taxonomy, 2015-2021

    10.2. Market Size Value (US$ Mn) & Volume (Units) Forecast by Market Taxonomy, 2022-2032

        10.2.1. By Country

            10.2.1.1. Brazil

            10.2.1.2. Mexico

            10.2.1.3. Argentina

            10.2.1.4. Chile

            10.2.1.5. Peru

            10.2.1.6. Rest of Latin America

        10.2.2. By Product Type

        10.2.3. By Application

        10.2.4. By End Use

    10.3. Market Attractiveness Analysis

        10.3.1. By Country

        10.3.2. By Product Type

        10.3.3. By Application

        10.3.4. By End Use

    10.4. Key Takeaways

11. Europe PUR Shippers Market Analysis 2015–2021 and Forecast 2022–2032, By Country

    11.1. Historical Market Size Value (US$ Mn) & Volume (Units) Trend Analysis by Market Taxonomy, 2015-2021

    11.2. Market Size Value (US$ Mn) & Volume (Units) Forecast by Market Taxonomy, 2022-2032

        11.2.1. By Country

            11.2.1.1. Germany

            11.2.1.2. Italy

            11.2.1.3. France

            11.2.1.4. U.K.

            11.2.1.5. Spain

            11.2.1.6. BENELUX

            11.2.1.7. Nordic

            11.2.1.8. Russia

            11.2.1.9. Poland

            11.2.1.10. Rest of Europe

        11.2.2. By Product Type

        11.2.3. By Application

        11.2.4. By End Use

    11.3. Market Attractiveness Analysis

        11.3.1. By Country

        11.3.2. By Product Type

        11.3.3. By Application

        11.3.4. By End Use

    11.4. Key Takeaways

12. East Asia PUR Shippers Market Analysis 2015–2021 and Forecast 2022–2032, By Country

    12.1. Historical Market Size Value (US$ Mn) & Volume (Units) Trend Analysis by Market Taxonomy, 2015-2021

    12.2. Market Size Value (US$ Mn) & Volume (Units) Forecast by Market Taxonomy, 2022-2032

        12.2.1. By Country

            12.2.1.1. China

            12.2.1.2. Japan

            12.2.1.3. South Korea

        12.2.2. By Product Type

        12.2.3. By Application

        12.2.4. By End Use

    12.3. Market Attractiveness Analysis

        12.3.1. By Country

        12.3.2. By Product Type

        12.3.3. By Application

        12.3.4. By End Use

    12.4. Key Takeaways

13. South Asia PUR Shippers Market Analysis 2015–2021 and Forecast 2022–2032, By Country

    13.1. Historical Market Size Value (US$ Mn) & Volume (Units) Trend Analysis by Market Taxonomy, 2015-2021

    13.2. Market Size Value (US$ Mn) & Volume (Units) Forecast by Market Taxonomy, 2022-2032

        13.2.1. By Country

            13.2.1.1. India

            13.2.1.2. Thailand

            13.2.1.3. Malaysia

            13.2.1.4. Indonesia

            13.2.1.5. Rest of South Asia

        13.2.2. By Product Type

        13.2.3. By Application

        13.2.4. By End Use

    13.3. Market Attractiveness Analysis

        13.3.1. By Country

        13.3.2. By Product Type

        13.3.3. By Application

        13.3.4. By End Use

    13.4. Key Takeaways

14. Oceania PUR Shippers Market Analysis 2015–2021 and Forecast 2022–2032, By Country

    14.1. Historical Market Size Value (US$ Mn) & Volume (Units) Trend Analysis by Market Taxonomy, 2015-2021

    14.2. Market Size Value (US$ Mn) & Volume (Units) Forecast by Market Taxonomy, 2022-2032

        14.2.1. By Country

            14.2.1.1. Australia

            14.2.1.2. New Zealand

        14.2.2. By Product Type

        14.2.3. By Application

        14.2.4. By End Use

    14.3. Market Attractiveness Analysis

        14.3.1. By Country

        14.3.2. By Product Type

        14.3.3. By Application

        14.3.4. By End Use

    14.4. Key Takeaways

15. Middle East & Africa PUR Shippers Market Analysis 2015–2021 and Forecast 2022–2032, By Country

    15.1. Historical Market Size Value (US$ Mn) & Volume (Units) Trend Analysis by Market Taxonomy, 2015-2021

    15.2. Market Size Value (US$ Mn) & Volume (Units) Forecast by Market Taxonomy, 2022-2032

        15.2.1. By Country

            15.2.1.1. GCC Countries

            15.2.1.2. Turkey

            15.2.1.3. Northern Africa

            15.2.1.4. South Africa

            15.2.1.5. Rest of MEA

        15.2.2. By Product Type

        15.2.3. By Application

        15.2.4. By End Use

    15.3. Market Attractiveness Analysis

        15.3.1. By Country

        15.3.2. By Product Type

        15.3.3. By Application

        15.3.4. By End Use

    15.4. Key Takeaways

16. Country wise PUR Shippers Market Analysis

    16.1. United States (U.S.)

        16.1.1. Market Share Analysis, 2022

        16.1.2. By Product Type

        16.1.3. By Application

        16.1.4. By End Use

    16.2. Canada

        16.2.1. Market Share Analysis, 2022

        16.2.2. By Product Type

        16.2.3. By Application

        16.2.4. By End Use

    16.3. Brazil

        16.3.1. Market Share Analysis, 2022

        16.3.2. By Product Type

        16.3.3. By Application

        16.3.4. By End Use

    16.4. Mexico

        16.4.1. Market Share Analysis, 2022

        16.4.2. By Product Type

        16.4.3. By Application

        16.4.4. By End Use

    16.5. Germany

        16.5.1. Market Share Analysis, 2022

        16.5.2. By Product Type

        16.5.3. By Application

        16.5.4. By End Use

    16.6. Italy

        16.6.1. Market Share Analysis, 2022

        16.6.2. By Product Type

        16.6.3. By Application

        16.6.4. By End Use

    16.7. France

        16.7.1. Market Share Analysis, 2022

        16.7.2. By Product Type

        16.7.3. By Application

        16.7.4. By End Use

    16.8. Spain

        16.8.1. Market Share Analysis, 2022

        16.8.2. By Product Type

        16.8.3. By Application

        16.8.4. By End Use

    16.9. U.K.

        16.9.1. Market Share Analysis, 2022

        16.9.2. By Product Type

        16.9.3. By Application

        16.9.4. By End Use

    16.10. Russia

        16.10.1. Market Share Analysis, 2022

        16.10.2. By Product Type

        16.10.3. By Application

        16.10.4. By End Use

    16.11. China

        16.11.1. Market Share Analysis, 2022

        16.11.2. By Product Type

        16.11.3. By Application

        16.11.4. By End Use

    16.12. Japan

        16.12.1. Market Share Analysis, 2022

        16.12.2. By Product Type

        16.12.3. By Application

        16.12.4. By End Use

    16.13. India

        16.13.1. Market Share Analysis, 2022

        16.13.2. By Product Type

        16.13.3. By Application

        16.13.4. By End Use

    16.14. GCC Countries

        16.14.1. Market Share Analysis, 2022

        16.14.2. By Product Type

        16.14.3. By Application

        16.14.4. By End Use

    16.15. Australia

        16.15.1. Market Share Analysis, 2022

        16.15.2. By Product Type

        16.15.3. By Application

        16.15.4. By End Use

17. Market Structure Analysis

    17.1. Competition Dashboard

    17.2. Competition Benchmarking

    17.3. Market Share Analysis of Top Players

        17.3.1. By Region

        17.3.2. By Product Portfolio

18. Competition Analysis

    18.1. Competition Deep Dive

        18.1.1. Cryopak

            18.1.1.1. Overview

            18.1.1.2. Product Portfolio

            18.1.1.3. Profitability by Market Segments (Product/Channel/Region)

            18.1.1.4. Sales Footprint

            18.1.1.5. Strategy Overview

                18.1.1.5.1. Marketing Strategy

                18.1.1.5.2. Product Strategy

                18.1.1.5.3. Channel Strategy

        18.1.2. Nordic Cold Chain Solutions

            18.1.2.1. Overview

            18.1.2.2. Product Portfolio

            18.1.2.3. Profitability by Market Segments (Product/Channel/Region)

            18.1.2.4. Sales Footprint

            18.1.2.5. Strategy Overview

                18.1.2.5.1. Marketing Strategy

                18.1.2.5.2. Product Strategy

                18.1.2.5.3. Channel Strategy

        18.1.3. Fisher Scientific

            18.1.3.1. Overview

            18.1.3.2. Product Portfolio

            18.1.3.3. Profitability by Market Segments (Product/Channel/Region)

            18.1.3.4. Sales Footprint

            18.1.3.5. Strategy Overview

                18.1.3.5.1. Marketing Strategy

                18.1.3.5.2. Product Strategy

                18.1.3.5.3. Channel Strategy

        18.1.4. Cole-Parmer Instrument Company, LLC

            18.1.4.1. Overview

            18.1.4.2. Product Portfolio

            18.1.4.3. Profitability by Market Segments (Product/Channel/Region)

            18.1.4.4. Sales Footprint

            18.1.4.5. Strategy Overview

                18.1.4.5.1. Marketing Strategy

                18.1.4.5.2. Product Strategy

                18.1.4.5.3. Channel Strategy

        18.1.5. Chill-Pak

            18.1.5.1. Overview

            18.1.5.2. Product Portfolio

            18.1.5.3. Profitability by Market Segments (Product/Channel/Region)

            18.1.5.4. Sales Footprint

            18.1.5.5. Strategy Overview

                18.1.5.5.1. Marketing Strategy

                18.1.5.5.2. Product Strategy

                18.1.5.5.3. Channel Strategy

        18.1.6. Sonoco Thermosafe

            18.1.6.1. Overview

            18.1.6.2. Product Portfolio

            18.1.6.3. Profitability by Market Segments (Product/Channel/Region)

            18.1.6.4. Sales Footprint

            18.1.6.5. Strategy Overview

                18.1.6.5.1. Marketing Strategy

                18.1.6.5.2. Product Strategy

                18.1.6.5.3. Channel Strategy

        18.1.7. VWR International, LLC

            18.1.7.1. Overview

            18.1.7.2. Product Portfolio

            18.1.7.3. Profitability by Market Segments (Product/Channel/Region)

            18.1.7.4. Sales Footprint

            18.1.7.5. Strategy Overview

                18.1.7.5.1. Marketing Strategy

                18.1.7.5.2. Product Strategy

                18.1.7.5.3. Channel Strategy

        18.1.8. Medline Industries, LP.

            18.1.8.1. Overview

            18.1.8.2. Product Portfolio

            18.1.8.3. Profitability by Market Segments (Product/Channel/Region)

            18.1.8.4. Sales Footprint

            18.1.8.5. Strategy Overview

                18.1.8.5.1. Marketing Strategy

                18.1.8.5.2. Product Strategy

                18.1.8.5.3. Channel Strategy

        18.1.9. Cold Chain Technologies

            18.1.9.1. Overview

            18.1.9.2. Product Portfolio

            18.1.9.3. Profitability by Market Segments (Product/Channel/Region)

            18.1.9.4. Sales Footprint

            18.1.9.5. Strategy Overview

                18.1.9.5.1. Marketing Strategy

                18.1.9.5.2. Product Strategy

                18.1.9.5.3. Channel Strategy

        18.1.10. CSafe Global

            18.1.10.1. Overview

            18.1.10.2. Product Portfolio

            18.1.10.3. Profitability by Market Segments (Product/Channel/Region)

            18.1.10.4. Sales Footprint

            18.1.10.5. Strategy Overview

                18.1.10.5.1. Marketing Strategy

                18.1.10.5.2. Product Strategy

                18.1.10.5.3. Channel Strategy

        18.1.11. Polar Ice Ltd.

            18.1.11.1. Overview

            18.1.11.2. Product Portfolio

            18.1.11.3. Profitability by Market Segments (Product/Channel/Region)

            18.1.11.4. Sales Footprint

            18.1.11.5. Strategy Overview

                18.1.11.5.1. Marketing Strategy

                18.1.11.5.2. Product Strategy

                18.1.11.5.3. Channel Strate

        18.1.12. Softbox Systems Inc.

            18.1.12.1. Overview

            18.1.12.2. Product Portfolio

            18.1.12.3. Profitability by Market Segments (Product/Channel/Region)

            18.1.12.4. Sales Footprint

            18.1.12.5. Strategy Overview

                18.1.12.5.1. Marketing Strategy

                18.1.12.5.2. Product Strategy

                18.1.12.5.3. Channel Strategy

19. Assumptions and Acronyms Used

20. Research Methodology

Don't pay for what you don't need

Customize your report by selecting specific countries or regions and save 30%!

List of Tables

Table 01: Global PUR Shippers Market Value (US$ Mn) Forecast by Region, 2015-2032

Table 02: Global PUR Shippers Market Volume (Units) Forecast by Region, 2015-2032

Table 03: Global PUR Shippers Market Value (US$ Mn) Forecast by Product Type, 2015-2032

Table 04: Global PUR Shippers Market Volume (Units) Forecast by Product Type, 2015-2032

Table 05: Global PUR Shippers Market Value (US$ Mn) Forecast by Application, 2015-2032

Table 06: Global PUR Shippers Market Volume (Units) Forecast by Application, 2015-2032

Table 07: Global PUR Shippers Market Value (US$ Mn) Forecast by End Use, 2015-2032

Table 08: Global PUR Shippers Market Volume (Units) Forecast by End Use, 2015-2032

Table 09: North America PUR Shippers Market Value (US$ Mn) Forecast by Country, 2015-2032

Table 10: North America PUR Shippers Market Volume (Units) Forecast by Country, 2015-2032

Table 11: North America PUR Shippers Market Value (US$ Mn) Forecast by Product Type, 2015-2032

Table 12: North America PUR Shippers Market Volume (Units) Forecast by Product Type, 2015-2032

Table 13: North America PUR Shippers Market Value (US$ Mn) Forecast by Application, 2015-2032

Table 14: North America PUR Shippers Market Volume (Units) Forecast by Application, 2015-2032

Table 15: North America PUR Shippers Market Value (US$ Mn) Forecast by End Use, 2015-2032

Table 16: North America PUR Shippers Market Volume (Units) Forecast by End Use, 2015-2032

Table 17: Latin America PUR Shippers Market Value (US$ Mn) Forecast by Country, 2015-2032

Table 18: Latin America PUR Shippers Market Volume (Units) Forecast by Country, 2015-2032

Table 19: Latin America PUR Shippers Market Value (US$ Mn) Forecast by Product Type, 2015-2032

Table 20: Latin America PUR Shippers Market Volume (Units) Forecast by Product Type, 2015-2032

Table 21: Latin America PUR Shippers Market Value (US$ Mn) Forecast by Application, 2015-2032

Table 22: Latin America PUR Shippers Market Volume (Units) Forecast by Application, 2015-2032

Table 23: Latin America PUR Shippers Market Value (US$ Mn) Forecast by End Use, 2015-2032

Table 24: Latin America PUR Shippers Market Volume (Units) Forecast by End Use, 2015-2032

Table 25: Europe PUR Shippers Market Value (US$ Mn) Forecast by Country, 2015-2032

Table 26: Europe PUR Shippers Market Volume (Units) Forecast by Country, 2015-2032

Table 27: Europe PUR Shippers Market Value (US$ Mn) Forecast by Product Type, 2015-2032

Table 28: Europe PUR Shippers Market Volume (Units) Forecast by Product Type, 2015-2032

Table 29: Europe PUR Shippers Market Value (US$ Mn) Forecast by Application, 2015-2032

Table 30: Europe PUR Shippers Market Volume (Units) Forecast by Application, 2015-2032

Table 31: Europe PUR Shippers Market Value (US$ Mn) Forecast by End Use, 2015-2032

Table 32: Europe PUR Shippers Market Volume (Units) Forecast by End Use, 2015-2032

Table 33: East Asia PUR Shippers Market Value (US$ Mn) Forecast by Country, 2015-2032

Table 34: East Asia PUR Shippers Market Volume (Units) Forecast by Country, 2015-2032

Table 35: East Asia PUR Shippers Market Value (US$ Mn) Forecast by Product Type, 2015-2032

Table 36: East Asia PUR Shippers Market Volume (Units) Forecast by Product Type, 2015-2032

Table 37: East Asia PUR Shippers Market Value (US$ Mn) Forecast by Application, 2015-2032

Table 38: East Asia PUR Shippers Market Volume (Units) Forecast by Application, 2015-2032

Table 39: East Asia PUR Shippers Market Value (US$ Mn) Forecast by End Use, 2015-2032

Table 40: East Asia PUR Shippers Market Volume (Units) Forecast by End Use, 2015-2032

Table 41: South Asia PUR Shippers Market Value (US$ Mn) Forecast by Country, 2015-2032

Table 42: South Asia PUR Shippers Market Volume (Units) Forecast by Country, 2015-2032

Table 43: South Asia PUR Shippers Market Value (US$ Mn) Forecast by Product Type, 2015-2032

Table 44: South Asia PUR Shippers Market Volume (Units) Forecast by Product Type, 2015-2032

Table 45: South Asia PUR Shippers Market Value (US$ Mn) Forecast by Application, 2015-2032

Table 46: South Asia PUR Shippers Market Volume (Units) Forecast by Application, 2015-2032

Table 47: South Asia PUR Shippers Market Value (US$ Mn) Forecast by End Use, 2015-2032

Table 48: South Asia PUR Shippers Market Volume (Units) Forecast by End Use, 2015-2032

Table 49: Oceania PUR Shippers Market Value (US$ Mn) Forecast by Country, 2015-2032

Table 50: Oceania PUR Shippers Market Volume (Units) Forecast by Country, 2015-2032

Table 51: Oceania PUR Shippers Market Value (US$ Mn) Forecast by Product Type, 2015-2032

Table 52: Oceania PUR Shippers Market Volume (Units) Forecast by Product Type, 2015-2032

Table 53: Oceania PUR Shippers Market Value (US$ Mn) Forecast by Application, 2015-2032

Table 54: Oceania PUR Shippers Market Volume (Units) Forecast by Application, 2015-2032

Table 55: Oceania PUR Shippers Market Value (US$ Mn) Forecast by End Use, 2015-2032

Table 56: Oceania PUR Shippers Market Volume (Units) Forecast by End Use, 2015-2032

Table 57: MEA PUR Shippers Market Value (US$ Mn) Forecast by Country, 2015-2032

Table 58: MEA PUR Shippers Market Volume (Units) Forecast by Country, 2015-2032

Table 59: MEA PUR Shippers Market Value (US$ Mn) Forecast by Product Type, 2015-2032

Table 60: MEA PUR Shippers Market Volume (Units) Forecast by Product Type, 2015-2032

Table 61: MEA PUR Shippers Market Value (US$ Mn) Forecast by Application, 2015-2032

Table 62: MEA PUR Shippers Market Volume (Units) Forecast by Application, 2015-2032

Table 63: MEA PUR Shippers Market Value (US$ Mn) Forecast by End Use, 2015-2032

Table 64: MEA PUR Shippers Market Volume (Units) Forecast by End Use, 2015-2032

Table 65: U.S. PUR Shippers Market Value (US$ Mn) Forecast by Product Type, Application, and End Use (2022(E) & 2032(F))

Table 66: Canada PUR Shippers Market Value (US$ Mn) Forecast by Product Type, Application, and End Use (2022(E) & 2032(F))

Table 67: Brazil PUR Shippers Market Value (US$ Mn) Forecast by Product Type, Application, and End Use (2022(E) & 2032(F))

Table 68: Mexico PUR Shippers Market Value (US$ Mn) Forecast by Product Type, Application, and End Use (2022(E) & 2032(F))

Table 69: Germany PUR Shippers Market Value (US$ Mn) Forecast by Product Type, Application, and End Use (2022(E) & 2032(F))

Table 70: Italy PUR Shippers Market Value (US$ Mn) Forecast by Product Type, Application, and End Use (2022(E) & 2032(F))

Table 71: France PUR Shippers Market Value (US$ Mn) Forecast by Product Type, Application, and End Use (2022(E) & 2032(F))

Table 72: Spain PUR Shippers Market Value (US$ Mn) Forecast by Product Type, Application, and End Use (2022(E) & 2032(F))

Table 73: U.K. PUR Shippers Market Value (US$ Mn) Forecast by Product Type, Application, and End Use (2022(E) & 2032(F))

Table 74: Russia PUR Shippers Market Value (US$ Mn) Forecast by Product Type, Application, and End Use (2022(E) & 2032(F))

Table 75: China PUR Shippers Market Value (US$ Mn) Forecast by Product Type, Application, and End Use (2022(E) & 2032(F))

Table 76: Japan PUR Shippers Market Value (US$ Mn) Forecast by Product Type, Application, and End Use (2022(E) & 2032(F))

Table 77: India PUR Shippers Market Value (US$ Mn) Forecast by Product Type, Application, and End Use (2022(E) & 2032(F))

Table 78: GCC Countries PUR Shippers Market Value (US$ Mn) Forecast by Product Type, Application, and End Use (2022(E) & 2032(F))

Table 79: Australia PUR Shippers Market Value (US$ Mn) Forecast by Product Type, Application, and End Use (2022(E) & 2032(F))
Ismail Sutaria
Ismail Sutaria

Principal Consultant

Talk to Analyst

Find your sweet spots for generating winning opportunities in this market.

List of Charts

Figure 01: Global PUR Shippers Market Value (US$ Mn) by Product Type, 2022-2032

Figure 02: Global PUR Shippers Market Value (US$ Mn) by Application, 2022-2032

Figure 03: Global PUR Shippers Market Value (US$ Mn) by End Use, 2022-2032

Figure 04: Global PUR Shippers Market Value (US$ Mn) by Region, 2022-2032

Figure 05: Global PUR Shippers Market Value (US$ Mn) Analysis by Region, 2015-2021

Figure 06: Global PUR Shippers Market Volume (Units) Analysis by Region, 2015-2032

Figure 07: Global PUR Shippers Market Value Share (%) and BPS Analysis by Region, 2022 & 2032

Figure 08: Global PUR Shippers Market Y-o-Y Growth (%) Projections by Region, 2022-2032

Figure 09: Global PUR Shippers Market Value (US$ Mn) Analysis by Product Type, 2015-2021

Figure 10: Global PUR Shippers Market Volume (Units) Analysis by Product Type, 2015-2032

Figure 11: Global PUR Shippers Market Value Share (%) and BPS Analysis by Product Type, 2022 & 2032

Figure 12: Global PUR Shippers Market Y-o-Y Growth (%) Projections by Product Type, 2022-2032

Figure 13: Global PUR Shippers Market Value (US$ Mn) Analysis by Application, 2015-2021

Figure 14: Global PUR Shippers Market Volume (Units) Analysis by Application, 2015-2032

Figure 15: Global PUR Shippers Market Value Share (%) and BPS Analysis by Application, 2022 & 2032

Figure 16: Global PUR Shippers Market Y-o-Y Growth (%) Projections by Application, 2022-2032

Figure 17: Global PUR Shippers Market Value (US$ Mn) Analysis by End Use, 2015-2021

Figure 18: Global PUR Shippers Market Volume (Units) Analysis by End Use, 2015-2032

Figure 19: Global PUR Shippers Market Value Share (%) and BPS Analysis by End Use, 2022 & 2032

Figure 20: Global PUR Shippers Market Y-o-Y Growth (%) Projections by End Use, 2022-2032

Figure 21: Global PUR Shippers Market Attractiveness by Product Type, 2022-2032

Figure 22: Global PUR Shippers Market Attractiveness by Application, 2022-2032

Figure 23: Global PUR Shippers Market Attractiveness by End Use, 2022-2032

Figure 24: Global PUR Shippers Market Attractiveness by End Use, 2022-2032

Figure 25: Global PUR Shippers Market Attractiveness by Region, 2022-2032

Figure 26: North America PUR Shippers Market Value (US$ Mn) by Product Type, 2022-2032

Figure 27: North America PUR Shippers Market Value (US$ Mn) by Application, 2022-2032

Figure 28: North America PUR Shippers Market Value (US$ Mn) by End Use, 2022-2032

Figure 29: North America PUR Shippers Market Value (US$ Mn) by Country, 2022-2032

Figure 30: North America PUR Shippers Market Value (US$ Mn) Analysis by Country, 2015-2021

Figure 31: North America PUR Shippers Market Volume (Units) Analysis by Country, 2015-2032

Figure 32: North America PUR Shippers Market Value Share (%) and BPS Analysis by Country, 2022 & 2032

Figure 33: North America PUR Shippers Market Y-o-Y Growth (%) Projections by Country, 2022-2032

Figure 34: North America PUR Shippers Market Value (US$ Mn) Analysis by Product Type, 2015-2021

Figure 35: North America PUR Shippers Market Volume (Units) Analysis by Product Type, 2015-2032

Figure 36: North America PUR Shippers Market Value Share (%) and BPS Analysis by Product Type, 2022 & 2032

Figure 37: North America PUR Shippers Market Y-o-Y Growth (%) Projections by Product Type, 2022-2032

Figure 38: North America PUR Shippers Market Value (US$ Mn) Analysis by Application, 2015-2021

Figure 39: North America PUR Shippers Market Volume (Units) Analysis by Application, 2015-2032

Figure 40: North America PUR Shippers Market Value Share (%) and BPS Analysis by Application, 2022 & 2032

Figure 41: North America PUR Shippers Market Y-o-Y Growth (%) Projections by Application, 2022-2032

Figure 42: North America PUR Shippers Market Value (US$ Mn) Analysis by End Use, 2015-2021

Figure 43: North America PUR Shippers Market Volume (Units) Analysis by End Use, 2015-2032

Figure 44: North America PUR Shippers Market Value Share (%) and BPS Analysis by End Use, 2022 & 2032

Figure 45: North America PUR Shippers Market Y-o-Y Growth (%) Projections by End Use, 2022-2032

Figure 46: North America PUR Shippers Market Attractiveness by Product Type, 2022-2032

Figure 47: North America PUR Shippers Market Attractiveness by Application, 2022-2032

Figure 48: North America PUR Shippers Market Attractiveness by End Use, 2022-2032

Figure 49: North America PUR Shippers Market Attractiveness by Country, 2022-2032

Figure 50: Latin America PUR Shippers Market Value (US$ Mn) by Product Type, 2022 & 2032

Figure 51: Latin America PUR Shippers Market Value (US$ Mn) by Application, 2022-2032

Figure 52: Latin America PUR Shippers Market Value (US$ Mn) by End Use, 2022-2032

Figure 53: Latin America PUR Shippers Market Value (US$ Mn) by Country, 2022-2032

Figure 54: Latin America PUR Shippers Market Value (US$ Mn) Analysis by Country, 2015-2021

Figure 55: Latin America PUR Shippers Market Volume (Units) Analysis by Country, 2015-2032

Figure 56: Latin America PUR Shippers Market Value Share (%) and BPS Analysis by Country, 2022 & 2032

Figure 57: Latin America PUR Shippers Market Y-o-Y Growth (%) Projections by Country, 2022-2032

Figure 58: Latin America PUR Shippers Market Value (US$ Mn) Analysis by Product Type, 2015-2021

Figure 59: Latin America PUR Shippers Market Volume (Units) Analysis by Product Type, 2015-2032

Figure 60: Latin America PUR Shippers Market Value Share (%) and BPS Analysis by Product Type, 2022 & 2032

Figure 61: Latin America PUR Shippers Market Y-o-Y Growth (%) Projections by Product Type, 2022-2032

Figure 62: Latin America PUR Shippers Market Value (US$ Mn) Analysis by Application, 2015-2021

Figure 63: Latin America PUR Shippers Market Volume (Units) Analysis by Application, 2015-2032

Figure 64: Latin America PUR Shippers Market Value Share (%) and BPS Analysis by Application, 2022 & 2032

Figure 65: Latin America PUR Shippers Market Y-o-Y Growth (%) Projections by Application, 2022-2032

Figure 66: Latin America PUR Shippers Market Value (US$ Mn) Analysis by End Use, 2015-2021

Figure 67: Latin America PUR Shippers Market Volume (Units) Analysis by End Use, 2015-2032

Figure 68: Latin America PUR Shippers Market Value Share (%) and BPS Analysis by End Use, 2022 & 2032

Figure 69: Latin America PUR Shippers Market Y-o-Y Growth (%) Projections by End Use, 2022-2032

Figure 70: Latin America PUR Shippers Market Attractiveness by Product Type, 2022-2032

Figure 71: Latin America PUR Shippers Market Attractiveness by Application, 2022-2032

Figure 72: Latin America PUR Shippers Market Attractiveness by End Use, 2022-2032

Figure 73: Latin America PUR Shippers Market Attractiveness by Country, 2022-2032

Figure 74: Europe PUR Shippers Market Value (US$ Mn) by Product Type, 2022-2032

Figure 75: Europe PUR Shippers Market Value (US$ Mn) by Application, 2022-2032

Figure 76: Europe PUR Shippers Market Value (US$ Mn) by End Use, 2022-2032

Figure 77: Europe PUR Shippers Market Value (US$ Mn) by Country, 2022-2032

Figure 78: Europe PUR Shippers Market Value (US$ Mn) Analysis by Country, 2015-2021

Figure 79: Europe PUR Shippers Market Volume (Units) Analysis by Country, 2015-2032

Figure 80: Europe PUR Shippers Market Value Share (%) and BPS Analysis by Country, 2022 & 2032

Figure 81: Europe PUR Shippers Market Y-o-Y Growth (%) Projections by Country, 2022-2032

Figure 82: Europe PUR Shippers Market Value (US$ Mn) Analysis by Product Type, 2015-2021

Figure 83: Europe PUR Shippers Market Volume (Units) Analysis by Product Type, 2015-2032

Figure 84: Europe PUR Shippers Market Value Share (%) and BPS Analysis by Product Type, 2022 & 2032

Figure 85: Europe PUR Shippers Market Y-o-Y Growth (%) Projections by Product Type, 2022-2032

Figure 86: Europe PUR Shippers Market Value (US$ Mn) Analysis by Application, 2015-2021

Figure 87: Europe PUR Shippers Market Volume (Units) Analysis by Application, 2015-2032

Figure 88: Europe PUR Shippers Market Value Share (%) and BPS Analysis by Application, 2022 & 2032

Figure 89: Europe PUR Shippers Market Y-o-Y Growth (%) Projections by Application, 2022-2032

Figure 90: Europe PUR Shippers Market Value (US$ Mn) Analysis by End Use, 2015-2021

Figure 91: Europe PUR Shippers Market Volume (Units) Analysis by End Use, 2015-2032

Figure 92: Europe PUR Shippers Market Value Share (%) and BPS Analysis by End Use, 2022 & 2032

Figure 93: Europe PUR Shippers Market Y-o-Y Growth (%) Projections by End Use, 2022-2032

Figure 94: Europe PUR Shippers Market Attractiveness by Product Type, 2022-2032

Figure 95: Europe PUR Shippers Market Attractiveness by Application, 2022-2032

Figure 96: Europe PUR Shippers Market Attractiveness by End Use, 2022-2032

Figure 97: Europe PUR Shippers Market Attractiveness by Country, 2022-2032

Figure 98: East Asia PUR Shippers Market Value (US$ Mn) by Product Type, 2022-2032

Figure 99: East Asia PUR Shippers Market Value (US$ Mn) by Application, 2022-2032

Figure 100: East Asia PUR Shippers Market Value (US$ Mn) by End Use, 2022-2032

Figure 101: East Asia PUR Shippers Market Value (US$ Mn) by Country, 2022-2032

Figure 102: East Asia PUR Shippers Market Value (US$ Mn) Analysis by Country, 2015-2021

Figure 103: East Asia PUR Shippers Market Volume (Units) Analysis by Country, 2015-2032

Figure 104: East Asia PUR Shippers Market Value Share (%) and BPS Analysis by Country, 2022 & 2032

Figure 105: East Asia PUR Shippers Market Y-o-Y Growth (%) Projections by Country, 2022-2032

Figure 106: East Asia PUR Shippers Market Value (US$ Mn) Analysis by Product Type, 2015-2021

Figure 107: East Asia PUR Shippers Market Volume (Units) Analysis by Product Type, 2015-2032

Figure 108: East Asia PUR Shippers Market Value Share (%) and BPS Analysis by Product Type, 2022 & 2032

Figure 109: East Asia PUR Shippers Market Y-o-Y Growth (%) Projections by Product Type, 2022-2032

Figure 110: East Asia PUR Shippers Market Value (US$ Mn) Analysis by Application, 2015-2021

Figure 111: East Asia PUR Shippers Market Volume (Units) Analysis by Application, 2015-2032

Figure 112: East Asia PUR Shippers Market Value Share (%) and BPS Analysis by Application, 2022 & 2032

Figure 113: East Asia PUR Shippers Market Y-o-Y Growth (%) Projections by Application, 2022-2032

Figure 114: East Asia PUR Shippers Market Value (US$ Mn) Analysis by End Use, 2015-2021

Figure 115: East Asia PUR Shippers Market Volume (Units) Analysis by End Use, 2015-2032

Figure 116: East Asia PUR Shippers Market Value Share (%) and BPS Analysis by End Use, 2022 & 2032

Figure 117: East Asia PUR Shippers Market Y-o-Y Growth (%) Projections by End Use, 2022-2032

Figure 118: East Asia PUR Shippers Market Attractiveness by Product Type, 2022-2032

Figure 119: East Asia PUR Shippers Market Attractiveness by Application, 2022-2032

Figure 120: East Asia PUR Shippers Market Attractiveness by End Use, 2022-2032

Figure 121: East Asia PUR Shippers Market Attractiveness by Country, 2022-2032

Figure 122: South Asia PUR Shippers Market Value (US$ Mn) by Product Type, 2022-2032

Figure 123: South Asia PUR Shippers Market Value (US$ Mn) by Application, 2022-2032

Figure 124: South Asia PUR Shippers Market Value (US$ Mn) by End Use, 2022-2032

Figure 125: South Asia PUR Shippers Market Value (US$ Mn) by Country, 2022-2032

Figure 126: South Asia PUR Shippers Market Value (US$ Mn) Analysis by Country, 2015-2021

Figure 127: South Asia PUR Shippers Market Volume (Units) Analysis by Country, 2015-2032

Figure 128: South Asia PUR Shippers Market Value Share (%) and BPS Analysis by Country, 2022 & 2032

Figure 129: South Asia PUR Shippers Market Y-o-Y Growth (%) Projections by Country, 2022-2032

Figure 130: South Asia PUR Shippers Market Value (US$ Mn) Analysis by Product Type, 2015-2021

Figure 131: South Asia PUR Shippers Market Volume (Units) Analysis by Product Type, 2015-2032

Figure 132: South Asia PUR Shippers Market Value Share (%) and BPS Analysis by Product Type, 2022 & 2032

Figure 133: South Asia PUR Shippers Market Y-o-Y Growth (%) Projections by Product Type, 2022-2032

Figure 134: South Asia PUR Shippers Market Value (US$ Mn) Analysis by Application, 2015-2021

Figure 135: South Asia PUR Shippers Market Volume (Units) Analysis by Application, 2015-2032

Figure 136: South Asia PUR Shippers Market Value Share (%) and BPS Analysis by Application, 2022 & 2032

Figure 137: South Asia PUR Shippers Market Y-o-Y Growth (%) Projections by Application, 2022-2032

Figure 138: South Asia PUR Shippers Market Value (US$ Mn) Analysis by End Use, 2015-2021

Figure 139: South Asia PUR Shippers Market Volume (Units) Analysis by End Use, 2015-2032

Figure 140: South Asia PUR Shippers Market Value Share (%) and BPS Analysis by End Use, 2022 & 2032

Figure 141: South Asia PUR Shippers Market Y-o-Y Growth (%) Projections by End Use, 2022-2032

Figure 142: South Asia PUR Shippers Market Attractiveness by Product Type, 2022-2032

Figure 143: South Asia PUR Shippers Market Attractiveness by Application, 2022-2032

Figure 144: South Asia PUR Shippers Market Attractiveness by End Use, 2022-2032

Figure 145: South Asia PUR Shippers Market Attractiveness by Country, 2022-2032

Figure 146: Oceania PUR Shippers Market Value (US$ Mn) by Product Type, 2022-2032

Figure 147: Oceania PUR Shippers Market Value (US$ Mn) by Application, 2022-2032

Figure 148: Oceania PUR Shippers Market Value (US$ Mn) by End Use, 2022-2032

Figure 149: Oceania PUR Shippers Market Value (US$ Mn) by Country, 2022-2032

Figure 150: Oceania PUR Shippers Market Value (US$ Mn) Analysis by Country, 2015-2021

Figure 151: Oceania PUR Shippers Market Volume (Units) Analysis by Country, 2015-2032

Figure 152: Oceania PUR Shippers Market Value Share (%) and BPS Analysis by Country, 2022 & 2032

Figure 153: Oceania PUR Shippers Market Y-o-Y Growth (%) Projections by Country, 2022-2032

Figure 154: Oceania PUR Shippers Market Value (US$ Mn) Analysis by Product Type, 2015-2021

Figure 155: Oceania PUR Shippers Market Volume (Units) Analysis by Product Type, 2015-2032

Figure 156: Oceania PUR Shippers Market Value Share (%) and BPS Analysis by Product Type, 2022 & 2032

Figure 157: Oceania PUR Shippers Market Y-o-Y Growth (%) Projections by Product Type, 2022-2032

Figure 158: Oceania PUR Shippers Market Value (US$ Mn) Analysis by Application, 2015-2021

Figure 159: Oceania PUR Shippers Market Volume (Units) Analysis by Application, 2015-2032

Figure 160: Oceania PUR Shippers Market Value Share (%) and BPS Analysis by Application, 2022 & 2032

Figure 161: Oceania PUR Shippers Market Y-o-Y Growth (%) Projections by Application, 2022-2032

Figure 162: Oceania PUR Shippers Market Value (US$ Mn) Analysis by End Use, 2015-2021

Figure 163: Oceania PUR Shippers Market Volume (Units) Analysis by End Use, 2015-2032

Figure 164: Oceania PUR Shippers Market Value Share (%) and BPS Analysis by End Use, 2022 & 2032

Figure 165: Oceania PUR Shippers Market Y-o-Y Growth (%) Projections by End Use, 2022-2032

Figure 166: Oceania PUR Shippers Market Attractiveness by Product Type, 2022-2032

Figure 167: Oceania PUR Shippers Market Attractiveness by Application, 2022-2032

Figure 168: Oceania PUR Shippers Market Attractiveness by End Use, 2022-2032

Figure 169 Oceania PUR Shippers Market Attractiveness by Country, 2022-2032

Figure 170: MEA PUR Shippers Market Value (US$ Mn) by Product Type, 2022-2032

Figure 171: MEA PUR Shippers Market Value (US$ Mn) by Application, 2022-2032

Figure 172: MEA PUR Shippers Market Value (US$ Mn) by End Use, 2022-2032

Figure 173: MEA PUR Shippers Market Value (US$ Mn) by Country, 2022-2032

Figure 174: MEA PUR Shippers Market Value (US$ Mn) Analysis by Country, 2015-2021

Figure 175: MEA PUR Shippers Market Volume (Units) Analysis by Country, 2015-2032

Figure 176: MEA PUR Shippers Market Value Share (%) and BPS Analysis by Country, 2022 & 2032

Figure 177: MEA PUR Shippers Market Y-o-Y Growth (%) Projections by Country, 2022-2032

Figure 178: MEA PUR Shippers Market Value (US$ Mn) Analysis by Product Type, 2015-2021

Figure 179: MEA PUR Shippers Market Volume (Units) Analysis by Product Type, 2015-2032

Figure 180: MEA PUR Shippers Market Value Share (%) and BPS Analysis by Product Type, 2022 & 2032

Figure 181: MEA PUR Shippers Market Y-o-Y Growth (%) Projections by Product Type, 2022-2032

Figure 182: MEA PUR Shippers Market Value (US$ Mn) Analysis by Application, 2015-2021

Figure 183: MEA PUR Shippers Market Volume (Units) Analysis by Application, 2015-2032

Figure 184: MEA PUR Shippers Market Value Share (%) and BPS Analysis by Application, 2022 & 2032

Figure 185: MEA PUR Shippers Market Y-o-Y Growth (%) Projections by Application, 2022-2032

Figure 186: MEA PUR Shippers Market Value (US$ Mn) Analysis by End Use, 2015-2021

Figure 187: MEA PUR Shippers Market Volume (Units) Analysis by End Use, 2015-2032

Figure 188: MEA PUR Shippers Market Value Share (%) and BPS Analysis by End Use, 2022 & 2032

Figure 189: MEA PUR Shippers Market Y-o-Y Growth (%) Projections by End Use, 2022-2032

Figure 190: MEA PUR Shippers Market Attractiveness by Product Type, 2022-2032

Figure 191: MEA PUR Shippers Market Attractiveness by Application, 2022-2032

Figure 192: MEA PUR Shippers Market Attractiveness by End Use, 2022-2032

Figure 193 MEA PUR Shippers Market Attractiveness by Country, 2022-2032

Recommendations

Packaging

Bottle Shippers Market

Published : July 2023

Packaging

Vaccine Shippers Market

Published : July 2021

Packaging

Pallet Shippers Market

Published : July 2021

Explore Packaging Insights

View Reports