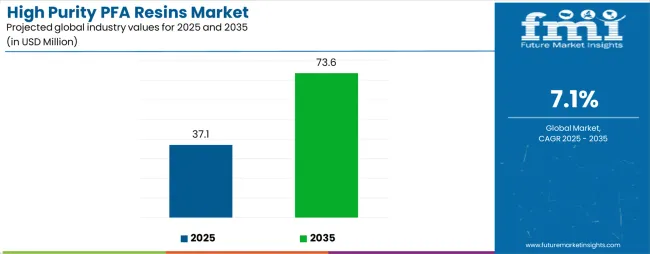
The global high purity PFA resins market stands poised for dramatic transformation, charting an extraordinary growth trajectory that will nearly double the market value over the coming decade. The first half of the decade witnesses the market expanding from its current USD 37.1 million foundation in 2025 to reach USD 52.3 million by 2030, representing a USD 15.2 million milestone addition that accounts for 41.5% of the total forecast expansion. This initial phase reflects the market's response to accelerating semiconductor manufacturing demands and stringent purity requirements in advanced electronic applications.
The latter half will witness even more pronounced acceleration, as the market surges from USD 52.3 million in 2030 to achieve the USD 73.6 million target by 2035, adding another USD 21.3 million in value creation that constitutes 58.5% of the overall ten-year growth trajectory. This 98.4% total growth over the forecast period, translating to a robust 7.1% compound annual growth rate, signals a market approaching near-doubling in size with a 1.98X expansion multiplier.
This remarkable trajectory positions high purity PFA resins as a critical enabler for next-generation semiconductor and medical device manufacturing, where contamination-free materials become increasingly essential for technological advancement and regulatory compliance.
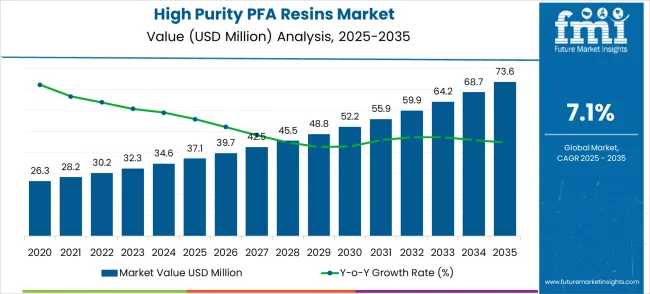
The high purity PFA resins market evolution unfolds through two distinct growth periods, each characterized by unique market dynamics and competitive landscape shifts. The initial growth phase spanning 2025-2030 establishes the market foundation through semiconductor industry expansion and medical device manufacturing sophistication, generating USD 15.2 million in new market value. This period emphasizes market penetration in established applications while companies invest in production capacity and quality certification processes to meet evolving purity standards.
The acceleration phase from 2030-2035 demonstrates market maturation as demand intensifies across emerging applications including advanced semiconductor processes and specialized medical cable manufacturing. This period contributes USD 21.3 million in market expansion, driven by technological advancement requiring ultra-high purity materials and regulatory requirements mandating contamination-free production environments. Market participants shift focus from basic capacity building to specialized product development and application-specific engineering solutions.
The competitive landscape evolution mirrors this temporal progression, with established players consolidating their technical leadership positions during the first phase while specialized manufacturers emerge to capture niche applications in the latter period. This phase transition logic reflects the market's journey from a specialized component supplier segment to a critical enabler of advanced manufacturing processes across multiple high-technology industries.
| Metric | Value |
|---|---|
| Market Value (2025) → | USD 37.1million |
| Market Forecast (2035) ↑ | USD 73.6 million |
| Growth Rate ★ | 7.1% CAGR |
| Leading Segment → | PFA Granule |
| Primary Application → | Semiconductor Cables |
These metrics demonstrate the market's transition from niche specialty segment to essential component supplier for advanced manufacturing applications requiring ultra-high purity materials.
Market expansion rests on three fundamental shifts driving sustained demand for ultra-pure fluoropolymer materials:
The growth faces headwinds from raw material supply constraints that limit production capacity expansion and cost pressures from alternative materials offering comparable performance at lower price points. These challenges require manufacturers to balance purity specifications with commercial viability across diverse application requirements.
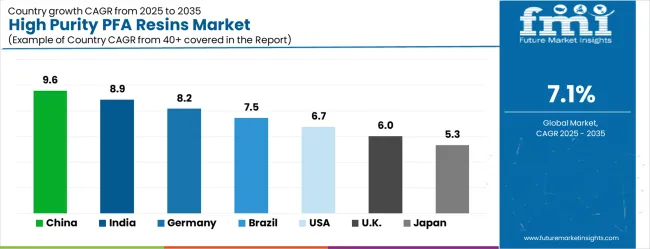
The high purity PFA resins market (USD 37.1M → 73.6M by 2035, CAGR ~7.1%) is fueled by semiconductor cable and medical cable applications where dielectric stability, ultra-low extractables, and chemical inertness are critical. Growth leadership comes from China (9.6% CAGR) and India (8.9%), followed by Germany (8.2%) and Brazil (7.5%), while the U.S., U.K., and Japan steady adoption for advanced electronics and healthcare applications. Together, these regions unlock ~USD 36.5M incremental opportunities by 2035, favoring suppliers with precision extrusion expertise, cleanroom-grade manufacturing, and validated reliability for critical infrastructure.
The high purity PFA resins market (USD 37.1M → 73.6M by 2035, CAGR ~7.1%) is fueled by semiconductor and medical cable applications where dielectric stability, ultra-low extractables, and chemical inertness are critical. Growth leadership comes from China (9.6% CAGR) and India (8.9%), followed by Germany (8.2%) and Brazil (7.5%), while the U.S., U.K., and Japan sustain adoption in advanced electronics, life sciences, and specialized industrial segments. Together, these regions unlock ~USD 36.5M incremental opportunities by 2035, with suppliers advantaged by cleanroom-grade production, precision extrusion compatibility, and validated long-term reliability.
Pathway A – Semiconductor Cables & Chipmaking Equipment High-purity PFA granules and powders for wafer fabs, cleanroom wiring, and plasma etching equipment requiring dielectric stability and zero metal contamination. Win themes: Ultra-trace contamination control, ISO cleanroom certifications, semiconductor-grade supply reliability, long service validation.
Pathway B – Medical & Life Sciences Cabling Resins for catheter wiring, surgical equipment, and diagnostic devices demanding biocompatibility and sterilization resistance. Win themes: FDA/ISO10993 compliance, gamma/EtO/autoclave sterilization durability, bio-inert builds, long-term implantation safety.
Pathway C – Eco-Friendly & Low-PFAS Formulations Re-engineered chemistries that meet tightening PFAS regulations without compromising dielectric or thermal performance. Win themes: PFAS-reduced grades, solvent-free polymerization, recyclable waste management, compliance-first branding.
Pathway D – Smart/Functional Cables PFA resins tailored for semiconductor test equipment, sensorized medical cables, and IoT-integrated electronics wiring. Win themes: EMI shielding compatibility, co-extrusion with conductive fillers, fiber-optic integration, signal fidelity guarantees.
Pathway E – Harsh-Environment & Regulated Applications Resins designed for aerospace wiring, nuclear facilities, offshore platforms, and defense electronics. Win themes: Radiation resistance, saline/humidity endurance, ATEX/UL/IEC certifications, flame-retardant properties, 20+ year service life proof.
PFA granules dominate the high purity resins market, capturing 68% of the total share in 2025. The segment’s prominence is driven by superior processability and consistent quality characteristics that ensure reliable manufacturing outcomes. Granules provide excellent flow behavior during extrusion, allowing manufacturers to achieve precise wall thickness control and superior surface finish in cable insulation layers. The uniform particle size distribution ensures consistent melt processing while minimizing contamination risks, which is critical in high-purity applications. PFA granules are widely preferred in industrial and medical cable manufacturing due to their chemical inertness, thermal stability, and ability to withstand extreme processing conditions.
The segment benefits from established supply chains and proven performance in demanding applications, creating high switching costs for manufacturers who rely on validated process parameters. Technical support infrastructure and application engineering expertise reinforce its leading position. Challenges remain from alternative resin forms like fine powders, which offer advantages in specific applications such as thin-wall coatings or specialty extrusion processes. Continuous innovation in material properties and processing characteristics is essential to maintain leadership and address evolving market requirements.
Semiconductor cable applications represent one of the most technically demanding end-use segments, driving 45% of high purity PFA resin demand. These applications require ultra-pure materials where even trace ionic contamination can compromise manufacturing yield and device reliability. Semiconductor cables must maintain electrical properties under extreme thermal cycling while preventing outgassing that could affect cleanroom environments. High purity PFA resins provide superior chemical inertness, thermal stability, and minimal ion leaching, meeting the rigorous demands of advanced semiconductor production.
Adoption is fueled by increasing complexity and miniaturization of semiconductor devices, which require cables with high-performance insulation to maintain signal integrity. The primary growth markets are concentrated in Asian semiconductor manufacturing hubs, particularly China, Taiwan, Japan, and South Korea, with secondary demand in North America and Europe. Long-term supply relationships and technical collaboration between resin manufacturers and semiconductor producers ensure consistent material quality and application-specific optimization.
The high purity PFA resins market is driven by increasing demand from advanced semiconductor and medical device applications where contamination control is critical. Semiconductor manufacturing processes require ultra-pure materials that maintain electrical properties under extreme temperature cycling and prevent ionic contamination that could compromise device performance. Miniaturization trends in chip production further increase the need for high-purity insulation materials capable of supporting next-generation technologies. In the medical sector, regulatory intensification mandates biocompatible, sterilization-resistant materials that do not compromise device functionality, particularly for implantable or diagnostic equipment. Across precision manufacturing industries, stringent quality control standards create consistent demand for PFA resins that prevent particle generation, chemical interference, and maintain process stability at microscopic scales. Manufacturers benefit from reliable performance characteristics, high thermal stability, and chemical inertness, which enhance operational efficiency and product reliability.
Despite strong demand, the market faces several constraints. Raw material supply limitations restrict production capacity expansion, while specialized purification and processing requirements reduce alternative sourcing options. High costs of high purity PFA resins relative to standard fluoropolymers create price sensitivity in cost-conscious applications. Technical barriers, including complex purification processes, quality validation, and application-specific certifications, limit market entry for new suppliers. Switching costs in established semiconductor and medical manufacturing environments slow adoption of alternative materials, as manufacturers rely on validated supply chains and proven material performance.
Market growth is particularly strong in Asia Pacific semiconductor hubs, where production volumes justify premium material investments, while North America and Europe emphasize application-specific engineering support and technical services. Design trends favor modular cable systems that simplify integration, and material innovations continue to improve purity levels and processability. Potential disruption may arise if alternative fluoropolymers achieve comparable purity at lower production costs, requiring continuous technological advancement and process optimization to sustain market leadership.
| Country | CAGR (2025 to 2035) |
|---|---|
| China | 9.6% |
| India | 8.9% |
| Germany | 8.2% |
| Brazil | 7.5% |
| USA | 6.7% |
| UK | 6.0% |
| Japan | 5.3% |
This performance distribution reflects regional manufacturing priorities, with Asian markets emphasizing capacity expansion while developed economies focus on advanced application development. The synthesis reveals China and India as primary growth drivers, while established markets provide stability through technical innovation and specialized applications requiring ultra-high purity materials.
China positions itself as the global leader in high purity PFA resins demand, driven by massive investments in semiconductor manufacturing and chemical processing industry expansion. The country demonstrates a robust CAGR of 9.6% through 2035, supported by government industrial policies promoting advanced manufacturing capabilities, domestic supply chain development, and technological self-sufficiency. Chinese semiconductor companies increasingly require contamination-free materials for advanced chip production processes, while chemical processing facilities adopt high purity resins to meet stringent export quality standards and environmental regulations. Major manufacturing hubs in Shanghai, Shenzhen, and Suzhou drive primary demand through electronics assembly operations and semiconductor fabrication facilities that rely on specialized cable materials for precision and reliability. Local and international suppliers are forging partnerships to establish production and distribution capabilities within China, catering to growing industrial needs. Quality improvement initiatives and regulatory compliance programs further support the sustained adoption of premium PFA resins across diverse applications, enabling manufacturers to maintain global competitiveness and operational efficiency.
The high purity PFA resins market in India is expanding rapidly, particularly across pharmaceutical manufacturing and electronics assembly facilities in Mumbai, Bangalore, and Hyderabad. With a projected CAGR of 8.9% through 2035, growth is fueled by pharmaceutical export development, modernization of electronics production, and rising industrial infrastructure investments. Companies are increasingly prioritizing contamination-free materials that meet international quality standards to serve domestic and overseas markets. Adoption of high purity PFA resins ensures equipment reliability, product consistency, and regulatory compliance, especially in high-precision applications such as semiconductor cables and medical device production. Indian manufacturers are integrating advanced resins into automated processes and modular systems, improving operational efficiency while supporting competitive positioning in global supply chains. Strategic initiatives include technology partnerships with global suppliers to strengthen technical capabilities and ensure consistent material performance, enabling India to meet both local production demands and international quality requirements.
Germany leads European market development for high purity PFA resins through precision manufacturing, technical expertise, and strict quality standards. With a CAGR of 8.2% through 2035, the country benefits from well-established industrial infrastructure in Munich, Hamburg, and Frankfurt, supporting automotive electronics, medical device production, and industrial automation. High purity resins are essential for applications requiring ultra-clean materials where contamination risks directly affect product performance and compliance. German manufacturers emphasize application-specific formulations tailored for demanding industrial environments, leveraging advanced material properties to achieve reliability, thermal stability, and process consistency. Precision engineering and quality control protocols allow companies to charge premium pricing while ensuring long-term operational efficiency. Regulatory standards and export requirements further strengthen adoption of certified high purity PFA resins across sectors, particularly for chemical processing and semiconductor applications. Continuous innovation and collaboration with end-users ensure Germany maintains leadership in high-performance material solutions, meeting both domestic and international demand.
The high purity PFA resins market in Brazil demonstrates steady growth, primarily driven by chemical processing infrastructure development, pharmaceutical manufacturing expansion, and modernization of industrial facilities in São Paulo, Rio de Janeiro, and Porto Alegre. While economic volatility poses challenges to capital equipment investments, companies maintain focus on industrial capability improvement through technology adoption and quality enhancement programs. Brazilian chemical and pharmaceutical manufacturers increasingly demand corrosion-resistant, ultra-pure materials that meet international export standards and regulatory compliance requirements. High purity PFA resins provide stable performance in critical processes handling aggressive chemicals, maintaining product purity and operational safety. The adoption of these resins also supports environmental initiatives, as manufacturers aim to reduce contamination risks and minimize waste during production. Market growth is further supported by government-led industrial modernization programs that emphasize quality improvement, technology transfer, and environmental compliance, creating opportunities for both domestic producers and international suppliers.
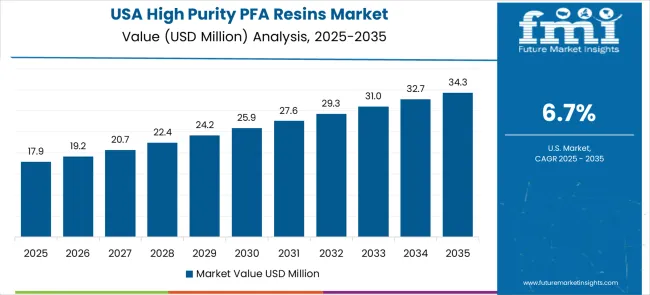
The U.S. high purity PFA resins market demonstrates consistent growth, with a focus on technical innovation and application-specific material development. Semiconductor manufacturing hubs in California, Texas, and Arizona drive demand for ultra-pure materials that prevent contamination and support advanced chip production processes. Medical device manufacturers require biocompatible resins that maintain performance during complex sterilization cycles while meeting stringent regulatory validation requirements. High purity PFA resins are critical in aerospace and defense applications, where materials must withstand extreme temperatures, maintain chemical stability, and ensure reliability under high-stress operating conditions. American companies emphasize total cost of ownership and long-term material performance rather than initial price, reflecting the strategic value of premium-quality resins. Collaboration between material suppliers and end-users fosters the development of application-specific formulations, ensuring that products meet unique performance and regulatory demands. Continuous innovation and integration into automated production lines enable U.S. manufacturers to maintain a competitive edge in high-tech and regulated industries.
The U.K. high purity PFA resins market exhibits medium growth potential, driven by specialized manufacturing applications in pharmaceutical production, precision electronics assembly, and chemical processing. Companies invest in premium materials to comply with strict quality standards and support export-oriented operations. Economic conditions influence investment pacing, but technical capabilities and regulatory compliance requirements encourage adoption of high purity PFA resins for critical processes. Advanced equipment stabilization, modular systems, and contamination-free materials enhance operational efficiency while ensuring consistent product quality. British manufacturers focus on materials that meet international hygiene standards, facilitating participation in global supply chains. Ongoing R&D and supplier partnerships support application-specific development, enabling customization for diverse industrial requirements. The market benefits from both domestic production needs and export-oriented growth, reflecting steady adoption of high-performance PFA resins in specialized, high-value applications.
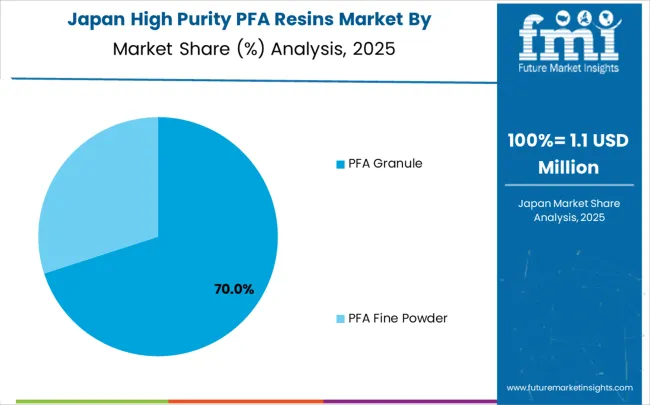
Japan continues to lead in high purity PFA resins through precision manufacturing, quality control, and technology innovation. Established industrial infrastructure supports electronics production, semiconductor fabrication, and medical device manufacturing, emphasizing ultra-clean, reliable materials. Japanese manufacturers prioritize consistent performance, contamination control, and technical support services while developing specialized applications requiring high thermal stability and chemical inertness. Cleanroom environments and semiconductor facilities drive demand for stainless steel or polymer-based high purity PFA resins, meeting stringent environmental and operational standards. Investment in continuous R&D enables the development of next-generation resins capable of handling higher loads, complex machinery, and advanced automation technologies. Japan’s focus on material innovation and industrial excellence ensures sustained competitiveness in global high-tech markets. Regulatory compliance, export quality standards, and customer-specific formulations reinforce the market’s premium positioning while promoting adoption of specialized PFA resins across electronics, medical, and industrial applications.
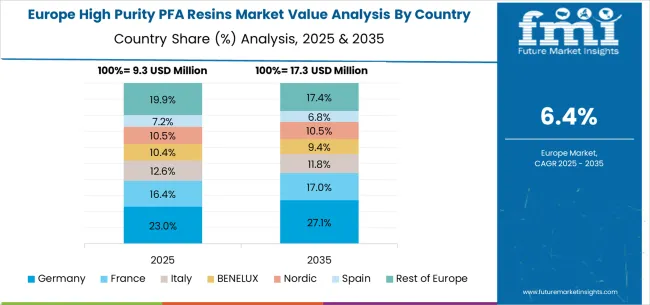
The European high purity PFA resins market reflects a mature industrial ecosystem where different countries contribute specialized capabilities to overall market dynamics. Germany anchors the region through precision engineering excellence and automotive electronics applications, while France contributes through aerospace and chemical processing expertise requiring specialized materials. The United Kingdom emphasizes pharmaceutical manufacturing and regulatory compliance applications, with Nordic countries focusing on cleanroom technologies and specialized industrial processes.
Market integration occurs through cross-border supply chains serving multinational manufacturing operations, while regulatory harmonization supports consistent quality standards across the region. Eastern European countries provide emerging growth opportunities through manufacturing facility development and industrial modernization programs. The regional market demonstrates stability through diversified industrial base and technical expertise, with growth driven by application sophistication rather than capacity expansion alone.
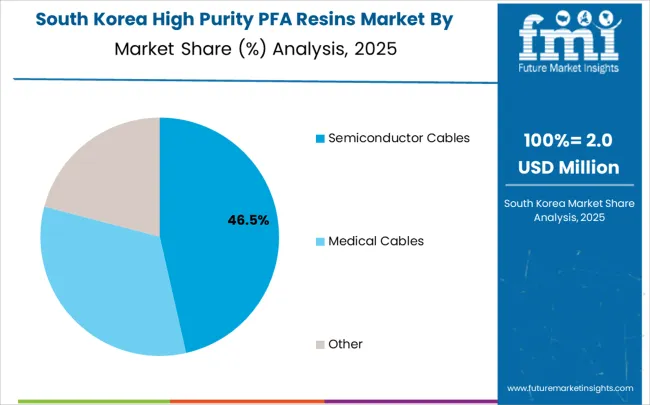
In South Korea, the market is expected to remain dominated by semiconductor cable applications, which hold a 52% share in 2025. These applications typically represent the most demanding technical requirements where material purity directly affects manufacturing yield and product quality in advanced chip production processes. Medical cable applications and specialized industrial applications each hold 24% market share, with increasing standardization in material specifications across diverse electronic manufacturing operations. Other applications account for the remaining share, but gradually gain traction in precision manufacturing development due to expanding quality requirements and contamination control needs.
Channel Insights:
| Item | Value |
|---|---|
| Quantitative Units (2025) | USD 37.1 million |
| Product Type | PFA Granule, PFA Fine Powder |
| End-Use | Semiconductor Cables, Medical Cables, Others |
| Regions Covered | North America, Latin America, Europe, East Asia, South Asia & Pacific, Middle East & Africa |
| Countries Covered | United States, Canada, United Kingdom, Germany, France, China, Japan, South Korea, India, Brazil, Australia and 40+ countries |
| Key Companies Profiled | Chemours, Daikin Industries, Solvay, AGC, Inc., 3M, Arkema Group, Zhejiang Juhua |
| Additional Attributes | Dollar sales by purity grade and processing specifications, regional demand trends across semiconductor and medical manufacturing centers, competitive landscape with established material suppliers and emerging specialty producers, adoption patterns for regulatory compliance versus performance optimization applications, integration with advanced manufacturing quality systems and contamination control protocols, innovations in purification technology and specialized processing capabilities, and development of application-specific formulations with enhanced chemical resistance and thermal stability characteristics. |
The global high purity PFA resins market is estimated to be valued at USD 37.1 million in 2025.
The market size for the high purity PFA resins market is projected to reach USD 73.6 million by 2035.
The high purity PFA resins market is expected to grow at a 7.1% CAGR between 2025 and 2035.
The key product types in high purity PFA resins market are PFA granule and PFA fine powder.
In terms of application, semiconductor cables segment to command 45.0% share in the high purity PFA resins market in 2025.


Our Research Products

The "Full Research Suite" delivers actionable market intel, deep dives on markets or technologies, so clients act faster, cut risk, and unlock growth.

The Leaderboard benchmarks and ranks top vendors, classifying them as Established Leaders, Leading Challengers, or Disruptors & Challengers.

Locates where complements amplify value and substitutes erode it, forecasting net impact by horizon

We deliver granular, decision-grade intel: market sizing, 5-year forecasts, pricing, adoption, usage, revenue, and operational KPIs—plus competitor tracking, regulation, and value chains—across 60 countries broadly.

Spot the shifts before they hit your P&L. We track inflection points, adoption curves, pricing moves, and ecosystem plays to show where demand is heading, why it is changing, and what to do next across high-growth markets and disruptive tech

Real-time reads of user behavior. We track shifting priorities, perceptions of today’s and next-gen services, and provider experience, then pace how fast tech moves from trial to adoption, blending buyer, consumer, and channel inputs with social signals (#WhySwitch, #UX).

Partner with our analyst team to build a custom report designed around your business priorities. From analysing market trends to assessing competitors or crafting bespoke datasets, we tailor insights to your needs.
Supplier Intelligence
Discovery & Profiling
Capacity & Footprint
Performance & Risk
Compliance & Governance
Commercial Readiness
Who Supplies Whom
Scorecards & Shortlists
Playbooks & Docs
Category Intelligence
Definition & Scope
Demand & Use Cases
Cost Drivers
Market Structure
Supply Chain Map
Trade & Policy
Operating Norms
Deliverables
Buyer Intelligence
Account Basics
Spend & Scope
Procurement Model
Vendor Requirements
Terms & Policies
Entry Strategy
Pain Points & Triggers
Outputs
Pricing Analysis
Benchmarks
Trends
Should-Cost
Indexation
Landed Cost
Commercial Terms
Deliverables
Brand Analysis
Positioning & Value Prop
Share & Presence
Customer Evidence
Go-to-Market
Digital & Reputation
Compliance & Trust
KPIs & Gaps
Outputs
Full Research Suite comprises of:
Market outlook & trends analysis
Interviews & case studies
Strategic recommendations
Vendor profiles & capabilities analysis
5-year forecasts
8 regions and 60+ country-level data splits
Market segment data splits
12 months of continuous data updates
DELIVERED AS:
PDF EXCEL ONLINE
High Protein Powders Market Analysis - Size, Share, and Forecast Outlook 2025 to 2035
High Performance Permanent Magnet Market Size and Share Forecast Outlook 2025 to 2035
High Airtight Storage Cabinets Market Size and Share Forecast Outlook 2025 to 2035
High Voltage Porcelain Bushing Market Size and Share Forecast Outlook 2025 to 2035
High Octane Racing Fuel Market Size and Share Forecast Outlook 2025 to 2035
High Voltage Air-cooled Battery Compartment Market Size and Share Forecast Outlook 2025 to 2035
High Temperature NiMH Battery Market Size and Share Forecast Outlook 2025 to 2035
High Current Power Supply for Electrophoresis Market Size and Share Forecast Outlook 2025 to 2035
High Voltage Cable Termination Market Size and Share Forecast Outlook 2025 to 2035
High Security Wedge Barricades Market Size and Share Forecast Outlook 2025 to 2035
High Performance Liquid Chromatography-Tandem Mass Spectrometry System Market Size and Share Forecast Outlook 2025 to 2035
High-vacuum Fiber Feedthrough Flanges Market Size and Share Forecast Outlook 2025 to 2035
High Pressure Grease Hose Market Size and Share Forecast Outlook 2025 to 2035
High Performing Matting Agent Market Size and Share Forecast Outlook 2025 to 2035
High Reliability Oscillators Market Size and Share Forecast Outlook 2025 to 2035
High-performance Dual-core Processor Market Size and Share Forecast Outlook 2025 to 2035
High Performance Magnet Market Size and Share Forecast Outlook 2025 to 2035
High-frequency RF Evaluation Board Market Size and Share Forecast Outlook 2025 to 2035
High Viscosity Mixer Market Size and Share Forecast Outlook 2025 to 2035
High Voltage Ionising Air Gun Market Size and Share Forecast Outlook 2025 to 2035

Thank you!
You will receive an email from our Business Development Manager. Please be sure to check your SPAM/JUNK folder too.
Chat With
MaRIA