The cold chain packaging market is valued at USD 18.7 billion in 2025 and is projected to reach USD 36.4 billion by 2035, advancing at a CAGR of 6.9%. Growth is driven by rising global dependence on temperature-controlled pharmaceutical distribution, expanding biologics and vaccine supply chains, and increased demand for thermal protection systems across food, clinical trial, and biotechnology logistics. Cold chain packaging plays a critical role in preventing thermal excursions, extending product stability, and ensuring regulatory-compliant transport across multi-modal distribution environments. Insulated shippers, holding 52.5% share, dominate due to their validated thermal performance and widespread use in biologics and vaccine shipments, while vacuum-insulated and PCM-integrated systems gain traction for long-duration and ultra-cold transport. Pharmaceuticals and healthcare applications account for 46.5% of total demand, supported by rising biologics penetration, expanding clinical trials, and global cold chain capacity investments.
Asia Pacific, particularly India and China, leads growth due to increasing vaccine production, strengthened biologics manufacturing, and accelerated cold chain infrastructure development. North America and Europe maintain steady, technology-heavy demand led by stringent regulatory standards, higher biologics adoption, and widespread use of reusable and IoT-enabled validated shippers. Rapid growth in Brazil and Southeast Asia reflects expanding healthcare access and temperature-sensitive import requirements. Competitive intensity remains moderate, with leading companies including Sonoco Products Company, Pelican BioThermal, Cold Chain Technologies, va-Q-tec AG, Softbox Systems, and Cryopak advancing capabilities in phase-change materials, vacuum insulation, reusable packaging formats, and real-time temperature-monitoring integration to strengthen global positioning.
A primary driver of market expansion is the growth of biopharmaceuticals and specialty pharmaceuticals. Biologics, cell therapies, gene therapies, vaccines, and injectables require precise temperature control to maintain potency and prevent spoilage. With global production of biologics intensifying in the U.S., Europe, China, South Korea, and India, manufacturers demand highly reliable packaging formats with proven thermal stability, long-duration cooling, and compatibility with controlled distribution channels. Cold boxes, passive shippers, pre-qualified thermal packaging, and phase-change materials are increasingly used to support long-distance and multi-modal pharmaceutical transport.
Regulatory frameworks reinforce adoption. Pharmaceutical agencies and food safety authorities impose strict guidelines for temperature-controlled packaging to prevent spoilage, contamination, and product degradation. Compliance with GDP (Good Distribution Practice), HACCP guidelines, and WHO cold chain standards drives manufacturers to adopt validated packaging formats that ensure temperature integrity across long transit durations.
Regionally, North America and Europe lead in adoption due to advanced pharmaceutical networks and structured cold chain regulations. Asia-Pacific is emerging rapidly due to increased biologics production, expanding cold chain logistics, and rising fresh food exports.
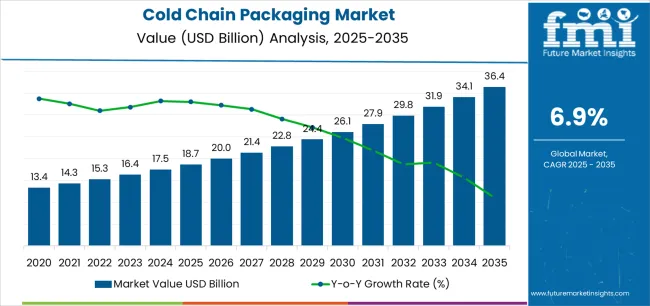
| Metric | Value |
|---|---|
| Estimated Value in (2025E) | USD 18.7 billion |
| Forecast Value in (2035F) | USD 36.4 billion |
| Forecast CAGR (2025 to 2035) | 6.9% |
Market expansion is being supported by the increasing global demand for pharmaceutical cold chain solutions and the corresponding need for packaging systems that can provide superior temperature control and thermal protection while enabling validated shipping and product integrity maintenance across various healthcare and food distribution applications. Modern pharmaceutical distribution centers and specialty logistics providers are increasingly focused on implementing packaging solutions that can protect temperature-sensitive products, prevent thermal degradation, and provide consistent thermal performance throughout complex multi-modal transportation networks. Cold chain packaging's proven ability to deliver exceptional temperature maintenance against environmental fluctuations, enable compliance with regulatory requirements, and support validated distribution make them essential packaging formats for contemporary pharmaceutical logistics and specialty food distribution operations.
The growing emphasis on biopharmaceutical protection and cold chain compliance is driving demand for cold chain packaging that can support high-value product distribution requirements, improve product stability maintenance, and enable validated packaging formats. Pharmaceutical manufacturers' preference for packaging that combines effective temperature control with performance validation and regulatory compliance is creating opportunities for innovative cold chain packaging implementations. The rising influence of cell and gene therapies and personalized medicine distribution is also contributing to increased demand for cold chain packaging that can provide ultra-low temperature protection, real-time monitoring capabilities, and reliable performance across extended transit durations.
The market is poised for rapid growth and transformation. As industries across pharmaceuticals, biotechnology, healthcare, food & beverage, and specialty chemicals seek packaging that delivers exceptional temperature control, thermal stability, and shipping validation, cold chain packaging is gaining prominence not just as logistics equipment but as strategic enablers of product integrity and regulatory compliance.
Rising biologics penetration in healthcare and expanding vaccine distribution networks globally amplify demand, while manufacturers are leveraging innovations in phase change materials, vacuum insulation panels, and IoT temperature monitoring systems.
Pathways like ultra-low temperature shipping solutions, reusable cold chain containers, and application-specific thermal validation promise strong margin uplift, especially in high-value segments. Geographic expansion and vertical integration will capture volume, particularly where local manufacturing capabilities and distribution network proximity are critical. Regulatory pressures around pharmaceutical distribution compliance, temperature monitoring requirements, food safety standards, and thermal validation protocols give structural support.
The market is segmented by product type, application, temperature range, material type, end-use industry, and region. By product type, the market is divided into insulated shippers, insulated containers, refrigerants, and others. By application, it covers pharmaceuticals & healthcare, food & beverage, chemicals, and others. By temperature range, the market is segmented into frozen (-20°C to -80°C), chilled (2°C to 8°C), ambient controlled (15°C to 25°C), and cryogenic (below -80°C). The material type includes expanded polystyrene (EPS), polyurethane (PU), vacuum insulated panels (VIP), and others. By end-use industry, it is categorized into pharmaceuticals, biotechnology, clinical trials, food processing, and others. Regionally, the market is divided into North America, Europe, East Asia, South Asia & Pacific, Latin America, and the Middle East & Africa.
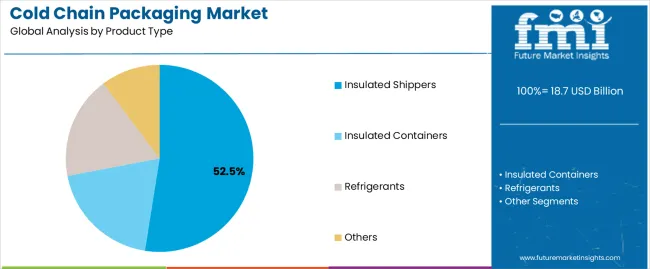
The insulated shippers segment is projected to account for 52.5% of the cold chain packaging market in 2025, reaffirming its position as the leading product category. Pharmaceutical distribution centers and specialty logistics providers increasingly utilize insulated shippers for their superior temperature maintenance properties when engineered with advanced phase change materials, excellent thermal protection characteristics, and validated performance in applications ranging from biologic transportation to vaccine distribution. Insulated shipper technology's advanced thermal barrier capabilities and consistent temperature stability directly address the pharmaceutical industry requirements for reliable cold chain protection in regulatory-compliant shipping environments.
This product segment forms the foundation of modern pharmaceutical cold chain operations, as it represents the cold chain packaging type with the greatest versatility and established market demand across multiple temperature ranges and therapeutic categories. Manufacturer investments in enhanced insulation technologies and IoT monitoring compatibility continue to strengthen adoption among pharmaceutical companies and clinical trial logistics providers. With companies prioritizing product integrity and regulatory compliance, insulated shippers align with both thermal performance requirements and validation efficiency objectives, making them the central component of comprehensive cold chain strategies.
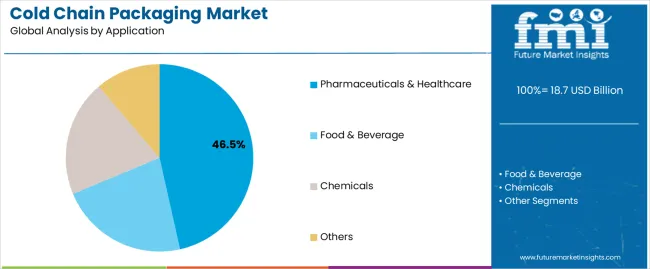
Pharmaceuticals & healthcare applications are projected to represent 46.5% of cold chain packaging demand in 2025, underscoring their critical role as the primary industrial consumers of temperature-controlled packaging solutions for biologic distribution, vaccine transportation, and specialty pharmaceutical logistics. Pharmaceutical manufacturers prefer cold chain packaging for their exceptional temperature maintenance capabilities, validated thermal performance, and ability to prevent product degradation while ensuring regulatory compliance with intact therapeutic efficacy. Positioned as essential packaging formats for modern pharmaceutical distribution operations, cold chain packaging offers both protection advantages and compliance benefits.
The segment is supported by continuous innovation in thermal validation technologies and the growing availability of specialized packaging structures that enable ultra-low temperature protection with enhanced thermal stability and real-time monitoring capabilities. Pharmaceutical operators are investing in cold chain infrastructure systems to support large-volume biologic distribution and temperature-controlled logistics efficiency. As personalized medicine demand becomes more prevalent and cell therapy distribution volumes increase, pharmaceuticals & healthcare applications will continue to dominate the end-use market while supporting advanced cold chain utilization and distribution compliance strategies.
The market is advancing rapidly due to increasing demand for pharmaceutical cold chain solutions and growing adoption of temperature-controlled packaging systems that provide superior thermal stability and validated protection while enabling compliant product distribution across diverse healthcare and food logistics applications. The market faces challenges, including high initial investment costs, complexity of thermal validation processes, and the need for specialized cold chain infrastructure investments. Innovation in reusable packaging systems and IoT monitoring integration continues to influence product development and market expansion patterns.
The growing adoption of IoT temperature sensors, cloud-connected monitoring platforms, and predictive analytics systems is enabling manufacturers to produce smart cold chain packaging with superior real-time tracking, enhanced data visibility, and automated alert functionalities. Advanced IoT systems provide improved compliance monitoring while allowing more efficient quality assurance and consistent performance across various shipping conditions and distribution networks. Pharmaceutical companies are increasingly recognizing the competitive advantages of connected cold chain capabilities for risk mitigation and regulatory compliance positioning.
Modern cold chain packaging producers are incorporating vacuum insulation panel technologies, aerogel insulation materials, and hybrid thermal barrier systems to enhance thermal performance, enable payload optimization, and deliver value-added solutions to pharmaceutical and biotechnology customers. These technologies improve temperature maintenance duration while enabling new operational capabilities, including reduced packaging weight, enhanced shipping density, and extended holding times. Advanced material integration also allows manufacturers to support ultra-cold distribution requirements and specialty therapeutic logistics beyond traditional refrigerated shipping approaches.
| Country | CAGR (2025-2035) |
|---|---|
| India | 9.4% |
| China | 8.2% |
| USA | 6.5% |
| Brazil | 7.8% |
| Germany | 6.1% |
| Japan | 5.6% |
| France | 6.4% |
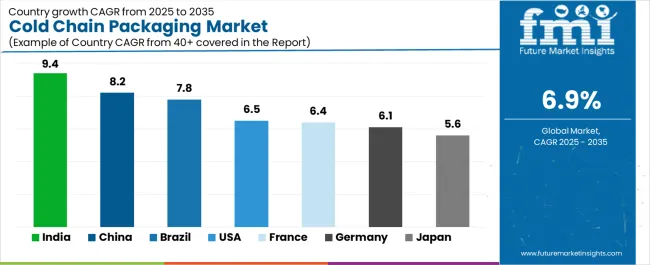
The cold chain packaging market is experiencing strong growth globally, with India leading at a 9.4% CAGR through 2035, driven by the expanding pharmaceutical manufacturing sector, growing biologics production capabilities, and significant investment in cold chain infrastructure development. China follows at 8.2%, supported by rapid biopharmaceutical growth, increasing vaccine manufacturing capacity, and growing pharmaceutical export capabilities.
The USA shows growth at 6.5%, emphasizing advanced biologics distribution and pharmaceutical logistics innovation. Brazil records 7.8%, focusing on healthcare infrastructure expansion and pharmaceutical import distribution growth. Germany demonstrates 6.1% growth, prioritizing pharmaceutical manufacturing excellence and advanced cold chain logistics standards. Japan exhibits 5.6% growth, emphasizing precision pharmaceutical production and quality cold chain packaging utilization. France shows 6.4% growth, supported by biopharmaceutical research concentration and pharmaceutical distribution infrastructure.
The report covers an in-depth analysis of 40+ countries, top-performing countries are highlighted below.
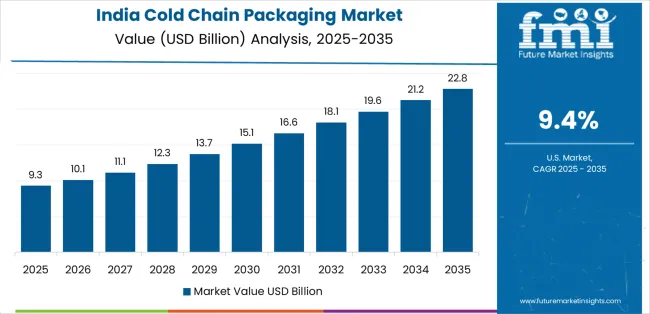
The cold chain packaging market in India is projected to exhibit exceptional growth with a CAGR of 9.4% through 2035, driven by expanding pharmaceutical manufacturing capacity and rapidly growing biologics production supported by government initiatives promoting healthcare infrastructure development. The country's strong position in vaccine manufacturing and increasing investment in cold chain logistics are creating substantial demand for temperature-controlled packaging solutions. Major pharmaceutical companies and contract manufacturing organizations are establishing comprehensive cold chain capabilities to serve both domestic distribution demand and pharmaceutical export markets.
The cold chain packaging market in China is expanding at a CAGR of 8.2%, supported by the country's massive pharmaceutical manufacturing sector, expanding biopharmaceutical research activities, and increasing adoption of advanced cold chain technologies. The country's government initiatives promoting pharmaceutical innovation and growing healthcare consumption are driving requirements for sophisticated temperature-controlled packaging capabilities. International pharmaceutical companies and domestic manufacturers are establishing extensive cold chain infrastructure to address the growing demand for biologic distribution solutions.
The cold chain packaging market in the USA is expanding at a CAGR of 6.5%, supported by the country's advanced biopharmaceutical industry, strong emphasis on pharmaceutical logistics innovation, and robust demand for high-performance cold chain packaging in specialty drug distribution applications. The nation's mature pharmaceutical sector and innovation-focused operations are driving sophisticated validated cold chain systems throughout the supply chain. Leading pharmaceutical manufacturers and logistics providers are investing extensively in IoT monitoring equipment and reusable cold chain solutions to serve both domestic and international markets.
The cold chain packaging market in Brazil is growing at a CAGR of 7.8%, driven by the country's expanding healthcare system, growing pharmaceutical import volumes, and increasing investment in cold chain infrastructure development. Brazil's large population base and commitment to healthcare access are supporting demand for temperature-controlled packaging solutions across multiple therapeutic segments. Cold chain logistics providers are establishing comprehensive distribution capabilities to serve the growing domestic pharmaceutical market and regional healthcare requirements.
The cold chain packaging market in Germany is expanding at a CAGR of 6.1%, supported by the country's pharmaceutical industry leadership, advanced cold chain capabilities, and strategic focus on high-quality temperature-controlled packaging. Germany's pharmaceutical manufacturing excellence and logistics innovation are driving demand for cold chain packaging in biopharmaceutical production, clinical trial distribution, and pharmaceutical export applications. Manufacturers are investing in comprehensive validation capabilities to serve both domestic pharmaceutical companies and international specialty markets.
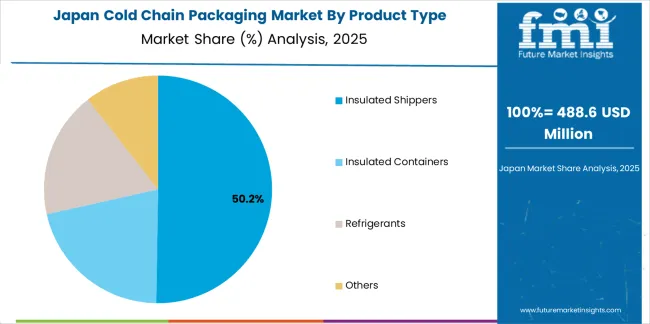
The cold chain packaging market in Japan is growing at a CAGR of 5.6%, driven by the country's expertise in pharmaceutical manufacturing, emphasis on quality assurance, and strong position in biopharmaceutical and specialty drug production. Japan's established pharmaceutical technology capabilities and commitment to regulatory excellence are supporting investment in advanced cold chain technologies throughout major pharmaceutical centers. Industry leaders are establishing comprehensive validation systems to serve domestic pharmaceutical manufacturers and international clinical trial logistics.
The cold chain packaging market in France is expanding at a CAGR of 6.4%, supported by the country's biopharmaceutical research concentration, growing pharmaceutical manufacturing sector, and strategic position in European pharmaceutical distribution networks. France's pharmaceutical innovation capabilities and integrated healthcare infrastructure are driving demand for high-quality cold chain packaging in biologic distribution, clinical trial logistics, and specialty pharmaceutical applications. Leading manufacturers are investing in specialized capabilities to serve the stringent requirements of pharmaceutical companies and biotechnology research organizations.
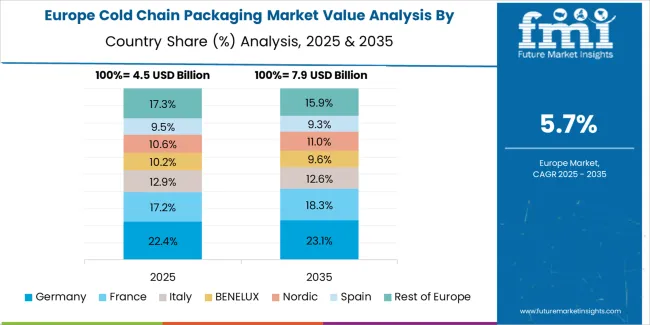
The cold chain packaging market in Europe is projected to grow from USD 5.3 billion in 2025 to USD 10.2 billion by 2035, registering a CAGR of 6.8% over the forecast period. Germany is expected to maintain its leadership position with a 29.5% market share in 2025, declining slightly to 29.0% by 2035, supported by its strong pharmaceutical manufacturing industry, advanced cold chain logistics capabilities, and comprehensive biopharmaceutical distribution sector serving diverse cold chain packaging applications across Europe.
France follows with a 21.5% share in 2025, projected to reach 22.0% by 2035, driven by robust demand for cold chain packaging in biopharmaceutical research, pharmaceutical distribution, and clinical trial logistics applications, combined with established pharmaceutical infrastructure and specialty therapeutics expertise. The United Kingdom holds a 19.5% share in 2025, expected to reach 20.0% by 2035, supported by strong biopharmaceutical sector and growing pharmaceutical logistics activities. Italy commands a 12.5% share in 2025, projected to reach 12.8% by 2035, while Spain accounts for 7.5% in 2025, expected to reach 7.8% by 2035.
Switzerland maintains a 5.0% share in 2025, growing to 5.2% by 2035. The Rest of Europe region, including Nordic countries, Eastern Europe, Belgium, Netherlands, and other nations, is anticipated to maintain momentum, with its collective share moving from 4.5% to 3.2% by 2035, attributed to increasing pharmaceutical manufacturing in Eastern Europe and growing biopharmaceutical research activities in Nordic countries implementing advanced cold chain distribution programs.
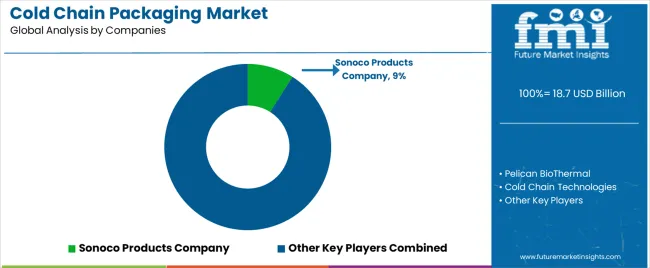
The Cold Chain Packaging Market is moderately concentrated, with roughly 25–30 participants supplying temperature-controlled solutions to pharmaceutical, biotechnology, and high-value food sectors. Market leadership is shaped less by price competition and more by demonstrated performance in thermal validation, global logistics compatibility, and regulatory compliance for GDP and GMP standards. Companies with proven capabilities in long-duration temperature stability, passive and active system integration, and end-to-end support retain the strongest customer loyalty across biopharma distribution channels.
Sonoco Products Company, Pelican BioThermal, and Cold Chain Technologies hold leading positions through robust portfolios of passive thermal shippers, PCM-based solutions, and single-use or reusable containers. Their expertise in packaging qualification, extended-duration holding times, and global service networks creates high switching costs for vaccine manufacturers, biologics producers, and specialty logistics firms. These players continue to invest in reusable assets and digital monitoring ecosystems to align with sustainability-driven procurement trends.
Specialized advanced-solution providers such as va-Q-tec AG, Softbox Systems, and CSafe Global differentiate through vacuum insulation panels, phase-change material innovation, active container technology, and IoT-enabled tracking. Their strong foothold in intercontinental biopharma shipments stems from proven thermal integrity in extreme conditions and well-developed airline partnerships.
Challenger companies including Intelsius, Cryopak, Envirotainer, and Snyder Industries compete by offering cost-effective alternatives, regional cold chain support, and customizable packaging tailored for clinical trial logistics and last-mile biologics distribution. As biologics, cell and gene therapies, and temperature-sensitive vaccines continue to expand globally, market dynamics increasingly reward suppliers capable of delivering validated, highly reliable, and sustainable cold chain packaging systems with comprehensive regulatory documentation and global servicing capacity.
| Items | Values |
|---|---|
| Quantitative Units (2025) | USD 18.7 billion |
| Product Type | Insulated Shippers, Insulated Containers, Refrigerants, Others |
| Application | Pharmaceuticals & Healthcare, Food & Beverage, Chemicals, Others |
| Temperature Range | Frozen (-20°C to -80°C), Chilled (2°C to 8°C), Ambient Controlled (15°C to 25°C), Cryogenic (Below -80°C) |
| Material Type | Expanded Polystyrene (EPS), Polyurethane (PU), Vacuum Insulated Panels (VIP), Others |
| End-Use Industry | Pharmaceuticals, Biotechnology, Clinical Trials, Food Processing, Others |
| Regions Covered | North America, Europe, East Asia, South Asia & Pacific, Latin America, Middle East & Africa |
| Countries Covered | United States, Canada, United Kingdom, Germany, France, China, Japan, South Korea, India, Brazil, Australia and 40+ countries |
| Key Companies Profiled | Sonoco Products Company, Pelican BioThermal, Cold Chain Technologies, va-Q-tec AG, Softbox Systems, Cryopak, CSafe Global, Intelsius, Envirotainer, Snyder Industries |
| Additional Attributes | Dollar sales by product type and application category, regional demand trends, competitive landscape, technological advancements in thermal insulation systems, phase change material development, IoT monitoring innovation, and pharmaceutical distribution integration |
The global cold chain packaging market is estimated to be valued at USD 18.7 billion in 2025.
The market size for the cold chain packaging market is projected to reach USD 36.4 billion by 2035.
The cold chain packaging market is expected to grow at a 6.9% CAGR between 2025 and 2035.
The key product types in cold chain packaging market are insulated shippers, insulated containers, refrigerants and others.
In terms of application, pharmaceuticals & healthcare segment to command 46.5% share in the cold chain packaging market in 2025.


Our Research Products

The "Full Research Suite" delivers actionable market intel, deep dives on markets or technologies, so clients act faster, cut risk, and unlock growth.

The Leaderboard benchmarks and ranks top vendors, classifying them as Established Leaders, Leading Challengers, or Disruptors & Challengers.

Locates where complements amplify value and substitutes erode it, forecasting net impact by horizon

We deliver granular, decision-grade intel: market sizing, 5-year forecasts, pricing, adoption, usage, revenue, and operational KPIs—plus competitor tracking, regulation, and value chains—across 60 countries broadly.

Spot the shifts before they hit your P&L. We track inflection points, adoption curves, pricing moves, and ecosystem plays to show where demand is heading, why it is changing, and what to do next across high-growth markets and disruptive tech

Real-time reads of user behavior. We track shifting priorities, perceptions of today’s and next-gen services, and provider experience, then pace how fast tech moves from trial to adoption, blending buyer, consumer, and channel inputs with social signals (#WhySwitch, #UX).

Partner with our analyst team to build a custom report designed around your business priorities. From analysing market trends to assessing competitors or crafting bespoke datasets, we tailor insights to your needs.
Supplier Intelligence
Discovery & Profiling
Capacity & Footprint
Performance & Risk
Compliance & Governance
Commercial Readiness
Who Supplies Whom
Scorecards & Shortlists
Playbooks & Docs
Category Intelligence
Definition & Scope
Demand & Use Cases
Cost Drivers
Market Structure
Supply Chain Map
Trade & Policy
Operating Norms
Deliverables
Buyer Intelligence
Account Basics
Spend & Scope
Procurement Model
Vendor Requirements
Terms & Policies
Entry Strategy
Pain Points & Triggers
Outputs
Pricing Analysis
Benchmarks
Trends
Should-Cost
Indexation
Landed Cost
Commercial Terms
Deliverables
Brand Analysis
Positioning & Value Prop
Share & Presence
Customer Evidence
Go-to-Market
Digital & Reputation
Compliance & Trust
KPIs & Gaps
Outputs
Full Research Suite comprises of:
Market outlook & trends analysis
Interviews & case studies
Strategic recommendations
Vendor profiles & capabilities analysis
5-year forecasts
8 regions and 60+ country-level data splits
Market segment data splits
12 months of continuous data updates
DELIVERED AS:
PDF EXCEL ONLINE
Market Share Breakdown for Cold Chain Packaging Market
Reusable Cold Chain Packaging Market Size and Share Forecast Outlook 2025 to 2035
Evaluating Reusable Cold Chain Packaging Market Share & Provider Insights
Pharmaceutical Cold Chain Packaging Market Size, Share & Forecast 2025 to 2035
Pharmaceutical Cold Chain Packaging Industry Analysis in United States - Size, Share, and Forecast Outlook 2025 to 2035
United States & Canada Cold Chain Packaging Market Insights- Demand and Growth Forecast 2025 to 2035
Cold Chain Logistics Transport Insulated Truck Market Size and Share Forecast Outlook 2025 to 2035
Cold-Chain Sensor Encapsulators Market Analysis - Size and Share Forecast Outlook 2025 to 2035
Cold Chain Monitoring Market Size and Share Forecast Outlook 2025 to 2035
Cold Chain Equipment Market Size and Share Forecast Outlook 2025 to 2035
Cold Chain Logistics Market Size and Share Forecast Outlook 2025 to 2035
Cold Seal Packaging Machine Market Trends & Growth Forecast 2024-2034
Cold Seal Packaging Market Trends & Industry Growth Forecast 2024-2034
IoT For Cold Chain Monitoring Market Size and Share Forecast Outlook 2025 to 2035
Healthcare Cold Chain Logistics Market Size and Share Forecast Outlook 2025 to 2035
Packaging Supply Market Size and Share Forecast Outlook 2025 to 2035
Packaging Testing Services Market Size and Share Forecast Outlook 2025 to 2035
Packaging Tubes Market Size and Share Forecast Outlook 2025 to 2035
Packaging Jar Market Forecast and Outlook 2025 to 2035
Cold Forging Machine Market Size and Share Forecast Outlook 2025 to 2035

Thank you!
You will receive an email from our Business Development Manager. Please be sure to check your SPAM/JUNK folder too.
Chat With
MaRIA