Cold Water Swelling Starch Market Forecast and Outlook 2025 to 2035

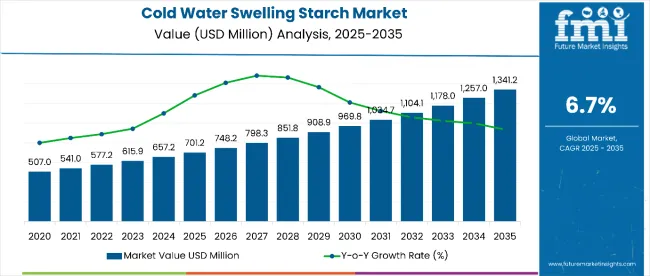
The global cold water swelling starch market is valued at USD 701.2 million in 2025 and is slated to reach approximately USD 1,341.2 million by 2035, recording an absolute increase of USD 640.0 million over the forecast period. This translates into a total growth of 91.3%, with the market forecast to expand at a compound annual growth rate (CAGR) of 6.7% between 2025 and 2035.

The overall market size is expected to grow by nearly 1.91X during the same period, supported by increasing demand for biodegradable ingredients, rising adoption of clean-label food products, and growing focus on energy-efficient processing technologies.
Quick Stats for Cold Water Swelling Starch Market

  • Cold Water Swelling Starch Market Value (2025): USD 701.2 million
  • Cold Water Swelling Starch Market Forecast Value (2035): USD 1,341.2 million
  • Cold Water Swelling Starch Market Forecast CAGR: 6.7%
  • Leading Form in Cold Water Swelling Starch Market: Granular (40%)
  • Key Growth Regions in Cold Water Swelling Starch Market: North America, Europe, and Asia Pacific
  • Key Players in Cold Water Swelling Starch Market: Cargill Inc., Ingredion Inc., AVEBE U.A., Tate & Lyle, ADM Co., KMC, Roquette, Grain Processing Corporation

Cold Water Swelling Starch Market

Cold Water Swelling Starch Market Key Takeaways

Metric Value
Estimated Value in (2025E) USD 701.2 million
Forecast Value in (2035F) USD 1,341.2 million
Forecast CAGR (2025 to 2035) 6.7%

Between 2025 and 2030, the cold water swelling starch market is projected to expand from USD 701.2 million to USD 998.7 million, resulting in a value increase of USD 297.5 million, which represents 46.5% of the total forecast growth for the decade.

This phase of growth will be shaped by rising consumer demand for instant-use products, increasing adoption of sustainable processing methods, and growing penetration of convenience food products in emerging markets. Food processing companies are expanding their cold water swelling starch product portfolios to address the growing demand for multifunctional ingredient solutions.

From 2030 to 2035, the market is forecast to grow from USD 998.7 million to USD 1,341.2 million, adding another USD 342.5 million, which constitutes 53.5% of the overall ten-year expansion. This period is expected to be characterized by expansion of sustainable sourcing practices, integration of advanced processing technologies, and development of specialized formulations for industrial applications. The growing adoption of biodegradable materials and clean-label ingredients will drive demand for premium cold water swelling starch with enhanced functionality and environmental compatibility.

Between 2020 and 2025, the cold water swelling starch market experienced steady expansion, driven by increasing consumer focus on convenience foods and growing awareness of energy-efficient processing methods. The market developed as food manufacturers recognized the need for instant-use ingredients to meet demand for ready-to-eat products and reduced processing costs. Industrial applications began emphasizing the importance of cold water swelling starch in textile sizing and adhesive manufacturing for maintaining production efficiency.
Opportunity Pathways-Cold Water Swelling Starch Market

Cold Water Swelling Starch Market Opportunity Pathways

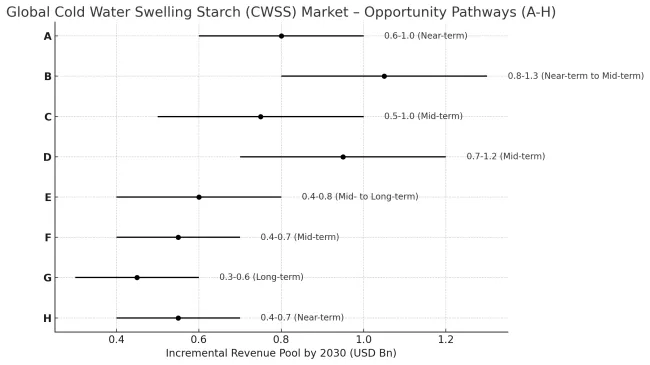
The coming years are transformative for cold water swelling starch. Manufacturers, food formulators, and industrial users are converging on one theme: functional, clean, and energy-efficient ingredients. As consumers demand instant-use, minimally processed, clean-label products, and industries seek sustainable formulations with lower heat / energy demand, CWSS becomes a key enabler. Innovations in source, modification, and regionally localized production further amplify opportunity. Altogether, these eight pathways may unlock around USD 3.5-6.0 billion in incremental revenue by 2033-35.

  • Pathway A - Clean-Label & Native Source Premiumisation. Native, minimally processed starches with non-GMO / allergen-free credentials fetch premiums, especially in clean-label markets. Expected incremental revenue: USD 0.6-1.0 billion.z
  • Pathway B - Convenience Food & Ready-to-Eat Expansion. Because CWSS dissolves/swells in cold water, it’s ideal for instant cakes, sauces, pudding, dessert mixes, dry drink mixes etc. As lifestyles favour quick meals, demand here grows sharply. Opportunity: USD 0.8-1.3 billion.
  • Pathway C - Modified Functional Varieties & Application Innovation. Modified versions with higher binding/stabilizing/film-forming properties open up new uses: pharmaceuticals (tablet disintegrants), cosmetics, coatings, adhesives. Margin enhancing. Pool: USD 0.5-1.0 billion.
  • Pathway D - Regional Penetration & Local Production. Asia-Pacific, Latin America among fastest growing; establishing local extraction/processing reduces cost, supply chain risk, and enables presence in regional formulations. Potential: USD 0.7-1.2 billion.
  • Pathway E - Sustainability & ESG-Driven Claims. Lower energy vs heat-processed starch; organic / sustainably sourced raw materials; biodegradable or bio-based uses. A smaller but meaningful premium: USD 0.4-0.8 billion.
  • Pathway F - Industrial / Non-Food Application Growth. Textiles, paper, packaging, adhesives, cosmetics — uses as binder, coating, etc. These sectors value CWSS for its film forming, binding, and stabilizing in low-temperature processes. Pool: USD 0.4-0.7 billion.
  • Pathway G - Digital & Value-Add Platformization. Offering customized formulations, blending with other functional ingredients, technical service, possibly subscription supply or product as a service models. Smaller early but good leverage: USD 0.3-0.6 billion.
  • Pathway H - Regulatory & Health-Driven Tailwinds. Clean-label laws, health commitments to reduce additives or heat in processing, consumer interest in “cold process” and low energy foods, labeling regulation favoring simpler ingredient lists. Impact: USD 0.4-0.7 billion.

Why is the Cold Water Swelling Starch Market Growing?

Market expansion is being supported by the increasing demand for biodegradable and energy-efficient processing solutions across food and industrial applications. Modern manufacturers are increasingly focused on cost-effective ingredients that can reduce energy consumption during production while maintaining product quality and functionality. Cold water swelling starch's proven efficacy in eliminating heat treatment requirements and supporting instant product preparation makes it a preferred ingredient in convenience food formulations.

The growing emphasis on clean-label and sustainable ingredients is driving demand for cold water swelling starch derived from natural sources such as potato, corn, and cassava. Consumer preference for instant and ready-to-eat products that combine convenience with natural ingredient profiles is creating opportunities for innovative formulations. The rising adoption of sustainable manufacturing practices and environmental regulations is also contributing to increased product adoption across food processing and industrial applications.

  • North America: Spending is high, driven by reformulation in packaged snacks, beverages, and dairy alternatives to meet clean-label expectations.
  • Europe: Investment is steady, shaped by stricter regulations and consumer preference for natural, minimally processed formulations.

Segmental Analysis

The market is segmented by form, source, application, process, and region. By form, the market is divided into granular, pregelatinized, and powder. Based on source, the market is categorized into banana starch, chickpeas starch, potato starch, corn starch, cassava starch, tapioca starch, rice starch, wheat starch, and other sources. In terms of application, the market is segmented into food, clinical nursing homes to thicken foods, dairy, bakery, convenience, ready-to-eat or instant dessert, snacks, edible fillings, pharmaceutical, textile sizing, adhesive making, and other applications. By process, the market is classified into spray cooking and drum-dried. Regionally, the market is divided into North America, Europe, Asia Pacific, Latin America, and Middle East & Africa.
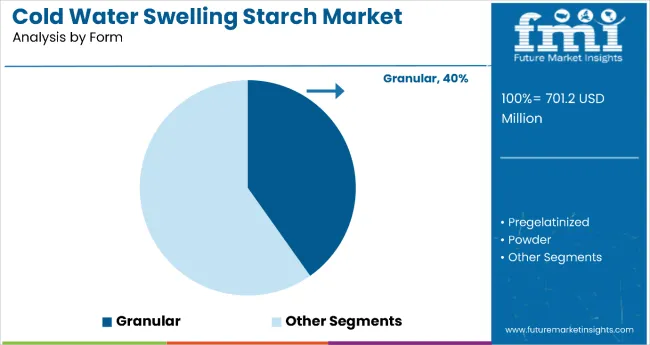
By Form, Granular Segment Accounts for 40% Market Share

Cold Water Swelling Starch Market Analysis By Form

The granular form is projected to account for 40% of the cold water swelling starch market in 2025, reaffirming its position as the category's preferred format. Consumers and manufacturers increasingly understand the benefits of granular starch, including superior dispersibility, excellent texturizing properties, and streamlined processing without heat treatment requirements. Granular cold water swelling starch directly addresses processing efficiency concerns by providing immediate functionality upon mixing with cold water.

This form represents the foundation of most industrial applications, as it offers the most versatile and cost-effective solution for manufacturers seeking instant functionality. The granular segment is projected to grow at a CAGR of 7.4% through 2035, driven by its compatibility with automated processing systems and ability to maintain product stability. With manufacturing processes demanding greater efficiency and reduced energy consumption, granular form aligns with both operational and sustainability goals, making it the central growth driver of cold water swelling starch demand.
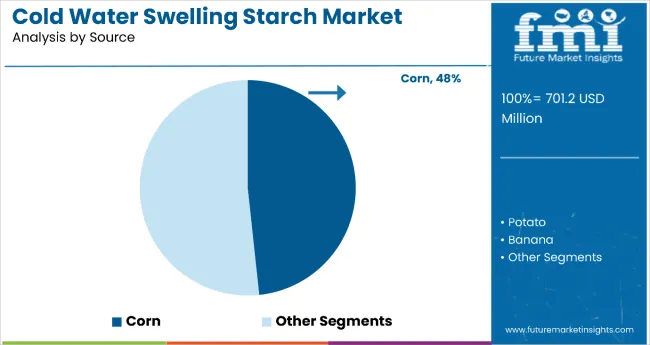
By Source, Corn Starch Segment Accounts for 48% Market Share

Cold Water Swelling Starch Market Analysis By Source

Corn starch is projected to represent 48% of cold water swelling starch demand in 2025, underscoring its role as the dominant raw material source for instant starch production. Manufacturers gravitate toward corn-based starch for its wide availability, cost-effectiveness, and neutral taste profile that works across diverse food applications. Positioned as a reliable and scalable ingredient, corn starch offers both functional benefits, such as excellent thickening properties, and economic advantages, including established supply chains and consistent quality.

The segment is supported by corn's superior processing characteristics and compatibility with various modification processes. Additionally, manufacturers are increasingly combining corn-based cold water swelling starch with other functional ingredients to enhance performance in specific applications like instant desserts and convenience foods. As ingredient-conscious manufacturers prioritize reliability and cost-efficiency, corn-based cold water swelling starch will continue to dominate supply chains, reinforcing its leadership position within the global starch ingredients market.

What are the Drivers, Restraints, and Key Trends of the Cold Water Swelling Starch Market?

The cold water swelling starch market is advancing rapidly due to increasing demand for energy-efficient processing solutions and growing adoption of convenience food products. However, the market faces challenges including limited raw material availability in certain regions, competition from conventional heat-processed starches, and fluctuating agricultural commodity prices. Innovation in sustainable sourcing practices and specialized formulation development continue to influence product advancement and market expansion patterns.

Expansion of Clean-Label and Natural Ingredient Trends

The growing consumer preference for clean-label products is driving demand for cold water swelling starch derived from natural sources. Manufacturers are responding by developing transparent ingredient profiles and sustainable sourcing practices. This trend is particularly strong in food applications where consumers seek recognizable ingredients with minimal processing. Clean-label positioning also supports premium pricing strategies and brand differentiation in competitive markets.

Integration of Sustainable Processing Technologies and Cost Optimization

Modern cold water swelling starch manufacturers are adopting sustainable processing methods that reduce energy consumption and waste generation during production. These technologies improve operational efficiency while meeting environmental sustainability goals. Advanced processing techniques also enable the development of specialized formulations for specific industrial applications, enhancing product performance and expanding market opportunities across food, textile, and adhesive industries.
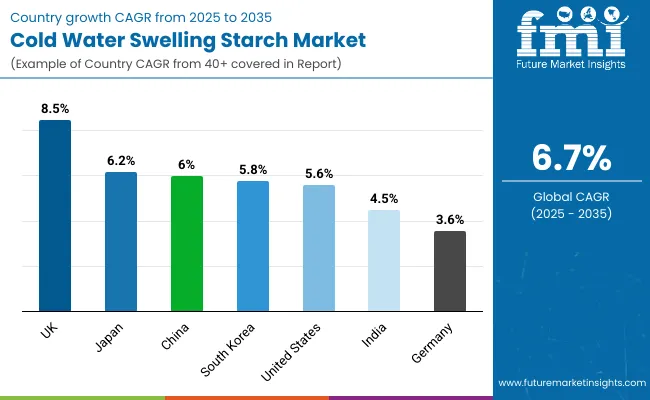
Analysis of Cold Water Swelling Starch Market by Key Country

Cold Water Swelling Starch Market Country Wise Analysis

Country CAGR (2025 to 2035)
United Kingdom 8.5%
Japan 6.2%
China 6.0%
South Korea 5.8%
United States 5.6%
India 4.5%
Germany 3.6%

The cold water swelling starch market is experiencing robust growth globally, with the United Kingdom leading at an 8.5% CAGR through 2035, driven by rising adoption of clean-label ingredients, expanding convenience food sector, and growing emphasis on energy-efficient processing technologies. Japan follows with 6.2% growth, supported by advanced food processing infrastructure and consumer preference for instant food products.

China shows steady growth at 6.0%, driven by expanding food processing industry and increasing demand for cost-effective ingredient solutions. South Korea records 5.8% growth, focusing on innovative food applications and technological advancement in processing methods. The United States exhibits 5.6% growth, emphasizing sustainable processing and biodegradable ingredient solutions.

The report covers an in-depth analysis of 40+ countries; seven top-performing countries are highlighted below.

United Kingdom Leads European Market Growth with Clean-Label Innovation

Revenue from cold water swelling starch in the United Kingdom is projected to exhibit strong growth with a CAGR of 8.5% through 2035, driven by surging adoption of clean-label food ingredients and innovative processed food products. The country's advanced food processing sector and consumer preference for sustainable ingredients are creating significant demand for energy-efficient starch solutions. Major food manufacturers are establishing comprehensive supply chains to serve the growing population of convenience-focused consumers across urban markets.

  • Government support for sustainable manufacturing practices and clean-label initiatives is driving demand for environmentally responsible ingredient solutions throughout major food processing centers.
  • Rising emphasis on reduced energy consumption and waste reduction in food manufacturing is supporting adoption of cold water swelling starch technologies nationwide.

Japan Demonstrates Strong Market Potential with Advanced Processing Technology

Revenue from cold water swelling starch in Japan is expanding at a CAGR of 6.2%, supported by advanced food processing infrastructure, consumer preference for convenience products, and growing adoption of energy-efficient manufacturing practices. The country's sophisticated food industry and focus on quality formulations are driving demand for specialized cold water swelling starch solutions. Japanese manufacturers are establishing innovative production methods to serve the demand for instant food products.

  • Rising investment in sustainable processing technologies is creating opportunities for advanced cold water swelling starch applications across food and industrial sectors.
  • Growing consumer awareness about convenience and quality in food preparation is driving product education and adoption among manufacturers seeking efficient ingredient solutions.

China Focuses on Industrial Scale Production and Cost Efficiency

Demand for cold water swelling starch in China is projected to grow at a CAGR of 6.0%, supported by expanding food processing industry, cost-effective manufacturing practices, and growing adoption of instant food products. Chinese manufacturers are increasingly focused on scalable production methods and supply chain optimization. The market is characterized by strong demand for affordable formulations that combine functionality with economic advantages.

  • Rapid industrialization and expanding food processing capacity are driving demand for efficient starch ingredients derived from domestic agricultural sources.
  • Investment in processing technology and quality improvement is supporting product development and enhancing competitiveness in both domestic and export markets.

South Korea Maintains Leadership with Technology Integration

Revenue from cold water swelling starch in South Korea is projected to grow at a CAGR of 5.8% through 2035, driven by the country's focus on food technology innovation, premium product development, and consumer preference for convenient food solutions. Korean manufacturers consistently invest in advanced processing methods that deliver superior functionality while maintaining cost efficiency.

  • Ongoing research and development in food science is supporting next-generation cold water swelling starch formulations that combine instant preparation with enhanced nutritional profiles.
  • Collaboration between food technology companies and agricultural processors is enhancing product innovation, reinforcing South Korea's position as a leader in advanced starch ingredient solutions.

United States Strengthens Market with Sustainable Processing Adoption

Revenue from cold water swelling starch in the United States is projected to grow at a CAGR of 5.6% through 2035, supported by advanced food processing infrastructure, emphasis on sustainable manufacturing, and growing demand for biodegradable ingredients. American manufacturers value processing efficiency, environmental responsibility, and proven performance, positioning cold water swelling starch as a core component of sustainable food production.

  • Growth in clean-label food trends and environmental consciousness is increasing demand for cold water swelling starch across diverse food processing applications.
  • Rising investment in energy-efficient processing technologies and sustainable sourcing is encouraging manufacturers to integrate environmentally responsible starch solutions into their product lines.

India Anchors Growth with Expanding Food Processing Industry

Revenue from cold water swelling starch in India is projected to grow at a CAGR of 4.5% through 2035, supported by expanding food processing sector, increasing urbanization, and growing demand for convenient food products. Indian manufacturers are focusing on cost-effective solutions and scalable production methods to serve the large domestic market.

  • Rising disposable income and changing lifestyle patterns are driving demand for instant and convenient food products throughout urban and semi-urban markets.
  • Government initiatives supporting food processing industry development and agricultural value addition are enhancing market opportunities for specialized starch ingredient applications.

Germany Maintains Stability with Quality-Focused Manufacturing

Revenue from cold water swelling starch in Germany is projected to grow at a CAGR of 3.6% through 2035, supported by the country's emphasis on quality manufacturing, sustainable processing practices, and established food industry infrastructure. German manufacturers prioritize product quality, environmental compliance, and technical innovation, making cold water swelling starch a trusted component in premium food applications.

  • Strict EU quality standards and environmental regulations are driving manufacturers to adopt sustainable sourcing and processing methods for cold water swelling starch production.
  • Strong industrial manufacturing base and technical expertise are supporting development of specialized formulations for both food and industrial applications across European markets.

Europe Market Split by Country

The cold water swelling starch market in Europe is projected to grow from USD 105.2 million in 2025 to USD 201.2 million by 2035, registering a CAGR of 6.7% over the forecast period. The United Kingdom is expected to strengthen its position, rising from 24.0% market share in 2025 to 28.0% by 2035, supported by accelerating clean-label ingredient adoption and strong innovation in instant/ready-to-eat food formulations. Germany follows with 21.0% in 2025, moderating to 19.0% by 2035 as growth there remains steady but below the UK’s pace due to more mature manufacturing adoption.

France accounts for 15.0% in 2025, easing slightly to 14.0% by 2035 as market expansion is steady but incremental. Italy holds 10.0% in 2025, moving to 9.0% by 2035, with growth concentrated in convenience food and specialty industrial applications. Spain represents 8.0% in 2025, declining modestly to 7.0% by 2035 as neighboring markets attract incremental investment.

The Rest of Europe (including Nordic countries, Eastern Europe, BENELUX, and other markets) collectively contributes 22.0% in 2025, expanding to 23.0% by 2035, driven by rising adoption in emerging processing hubs and increasing demand from textile, paper & packaging applications.
Competitive Landscape of Cold Water Swelling Starch Market

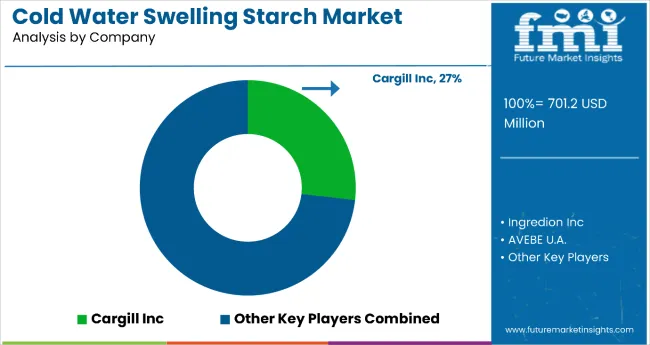
Cold Water Swelling Starch Market Analysis By Company

The cold water swelling starch market is characterized by competition among established ingredient suppliers, specialty starch manufacturers, and emerging sustainable processing companies. Companies are investing in advanced processing technologies, sustainable sourcing practices, innovative formulations, and market expansion strategies to deliver effective, reliable, and cost-efficient starch solutions. Product quality, supply chain optimization, and application development are central to strengthening product portfolios and market presence.

Cargill Inc., USA-based, leads the market with significant global presence, offering comprehensive cold water swelling starch solutions with focus on food applications and industrial uses. Ingredion Inc., USA, provides innovative starch formulations with emphasis on functionality and processing efficiency. AVEBE U.A., Netherlands, delivers specialized potato-based starch products with focus on natural sourcing and sustainability. Tate & Lyle, UK, focuses on high-performance ingredients that combine functionality with clean-label positioning.

ADM Co. and KMC, operating globally, provide comprehensive starch product ranges across multiple applications and processing methods. Roquette, France, emphasizes natural ingredient solutions and sustainable processing practices. Grain Processing Corporation, USA, offers specialized formulations with focus on specific industrial applications and customized solutions for diverse manufacturing requirements.

Global Cold Water Swelling Starch Market - Stakeholder Contribution Framework

The success of cold water swelling starches, driven by convenience food demand, clean-label requirements, and cost-efficient processing, will not only enhance food and beverage functionality but also strengthen supply chain resilience. It will consolidate emerging markets as hubs for modified and functional starch production while aligning advanced economies with sustainable, high-performance food ingredients. This calls for a concerted effort by all stakeholders: governments, industry bodies, suppliers, OEMs, and investors. Each can be a crucial enabler in preparing the market for its next phase of growth.

How Governments Could Spur Local Production and Adoption?

  • Targeted Incentives: Offer subsidies and tax benefits for food processors using starches derived from sustainable raw materials such as corn, potato, and tapioca.
  • Trade Agreements: Classify cold water swelling starch as a functional food input in international trade agreements and harmonize labeling rules across regions.
  • Facilitate Innovation: Fund R&D into clean-label modification methods, non-chemical swelling technologies, and circular utilization of starch-rich agricultural by-products.

How Industry Bodies Could Support Market Development?

  • Foster Connectivity: Build alliances between starch processors, food companies, and nutrition research institutes to align adoption with health and sustainability standards.
  • Promote Exports: Position cold water swelling starch as a versatile ingredient for instant foods, dairy alternatives, and gluten-free bakery applications. Organize international exhibitions to connect producers with global buyers.
  • Upskilling Programs: Train suppliers and distributors on functional benefits, regulatory compliance, and clean-label formulation opportunities.

How OEMs and Food-Tech Players Could Strengthen the Ecosystem?

  • Drive Integration: Develop processing equipment optimized for energy-efficient starch modification and instant dispersibility.
  • Forge Partnerships: Co-develop new formulations with food manufacturers, focusing on low-sugar, gluten-free, and fortified snack segments. Collaborate on digital monitoring systems for starch quality and consistency.

How Suppliers Could Navigate the Shift?

  • Capture Exports: Leverage government support and regional demand growth to expand into international markets where instant and convenience foods are accelerating.
  • Invest in Research: Collaborate with startups and universities to develop novel starch blends with enhanced viscosity, mouthfeel, and stability.
  • Build Capabilities: Train sales teams and food technologists to demonstrate performance and ROI to food and beverage manufacturers.

How Investors Could Catalyze Growth?

  • Deploy Capital: Finance scale-up of starch processing facilities with sustainable and non-chemical modification capabilities.
  • Support Branding: Invest in ingredient brands positioned as clean-label, non-GMO, and functional starch solutions.
  • De-Risk Supply Chains: Provide funding for raw material sourcing diversification across corn, potato, cassava, and rice to ensure resilience.

Key Players in the Cold Water Swelling Starch Market

  • Cargill Inc.
  • Ingredion Inc.
  • AVEBE U.A.
  • Tate & Lyle
  • ADM Co.
  • KMC
  • Roquette
  • Grain Processing Corporation

Scope of the Report

Items Values
Quantitative Units (2025) USD 701.2 Million
Form Granular, Pregelatinized, Powder
Source Banana Starch, Chickpeas Starch, Potato Starch, Corn Starch, Cassava Starch, Tapioca Starch, Rice Starch, Wheat Starch, Other Sources
Application Food, Clinical Nursing Homes to Thicken Foods, Dairy, Bakery, Convenience, Ready-to-eat or Instant Dessert, Snacks, Edible Fillings, Pharmaceutical, Textile Sizing, Adhesive Making, Other Applications
Process Spray cooking, Drum-Dried
Regions Covered North America, Europe, Asia Pacific, Latin America, Middle East & Africa
Countries Covered United States, Germany, United Kingdom, India, China, South Korea, Japan, Canada, France, Italy, Brazil, Australia and 40+ countries
Key Companies Profiled Cargill Inc., Ingredion Inc., AVEBE U.A., Tate & Lyle, ADM Co., KMC, Roquette, and Grain Processing Corporation
Additional Attributes Product innovation by processing method, regional supply chain dynamics, competitive landscape analysis, sustainability initiatives in sourcing, integration with clean-label positioning, innovations in energy-efficient processing, and sustainable agricultural sourcing practices

Key Segments

By Form:

  • Granular
  • Pregelatinized
  • Powder

By Source:

  • Banana Starch
  • Chickpeas Starch
  • Potato Starch
  • Corn Starch
  • Cassava Starch
  • Tapioca Starch
  • Rice Starch
  • Wheat Starch
  • Other Sources

By Application:

  • Food
  • Clinical Nursing Homes to Thicken Foods
  • Dairy
  • Bakery
  • Convenience
  • Ready-to-eat or Instant Dessert
  • Snacks
  • Edible Fillings
  • Pharmaceutical
  • Textile Sizing
  • Adhesive Making
  • Other Applications

By Process:

  • Spray cooking
  • Drum-Dried

By Region:

  • North America
    • United States
    • Canada
    • Mexico
  • Europe
    • Germany
    • United Kingdom
    • France
    • Italy
    • Spain
    • Nordic
    • BENELUX
    • Rest of Europe
  • Asia Pacific
    • China
    • Japan
    • South Korea
    • India
    • ASEAN
    • Australia & New Zealand
    • Rest of Asia Pacific
  • Latin America
    • Brazil
    • Chile
    • Rest of Latin America
  • Middle East & Africa
    • Kingdom of Saudi Arabia
    • Other GCC Countries
    • Turkiye
    • South Africa
    • Other African Union
    • Rest of Middle East & Africa

Frequently Asked Questions

What is the projected growth rate of the cold water swelling starch market between 2025 and 2035?

The market is projected to grow at a CAGR of 6.7% from 2025 to 2035, rising from USD 701.2 million in 2025 to USD 1,341.2 million by 2035.

Which country is the largest consumer of cold water swelling starch?

The United States is the largest consumer, driven by its advanced food processing industry, strong adoption of instant starches, and emphasis on clean-label and biodegradable ingredients.

What makes potato starch the most lucrative source in the cold water swelling starch market?

Potato starch offers superior cold-water solubility, high yield, and cost-efficiency. It holds the largest share among sources, contributing 56.5% of the market in 2025, and is projected to grow at a CAGR of 7.2%.

Why is drum-dried starch gaining popularity in cold water swelling starch applications in industrial settings?

Drum-dried starch provides high uniformity, fast solubility, and is cost-effective at scale. It is ideal for use in instant food mixes, adhesives, and coatings, with a projected CAGR of 7.1%, making it the fastest-growing process segment.

Which application segment is expected to lead the cold water swelling starch market by 2035?

Ready-to-eat/instant desserts are expected to lead, with strong demand for convenience and cold-processed foods. The segment is projected to grow at a CAGR of 7.3%, reaching USD 353.1 million by 2035.

Table of Content

  • 1. Executive Summary
  • 2. Market Overview
  • 3. Market Background
  • 4. Global Market Analysis 2020 to 2024 and Forecast, 2025 to 2035
  • 5. Global Market Analysis 2020 to 2024 and Forecast 2025 to 2035, By Form
    • 5.1. Granular
    • 5.2. Pregelatinized
    • 5.3. Powder
  • 6. Global Market Analysis 2020 to 2024 and Forecast 2025 to 2035, By Source
    • 6.1. Banana
    • 6.2. Chickpeas
    • 6.3. Potato
    • 6.4. Corn
    • 6.5. Cassava
    • 6.6. Tapioca
    • 6.7. Rice
    • 6.8. Wheat
  • 7. Global Market Analysis 2020 to 2024 and Forecast 2025 to 2035, By End Use
    • 7.1. Food
    • 7.2. Dairy
    • 7.3. Bakery
    • 7.4. Ready-to-Eat/ Instant
    • 7.5. Snacks
    • 7.6. Fillings
    • 7.7. Pharmaceutical
    • 7.8. Textile
    • 7.9. Adhesive
  • 8. Global Market Analysis 2020 to 2024 and Forecast 2025 to 2035, By Process
    • 8.1. Spray Cooking
    • 8.2. Drum-Dried
  • 9. Global Market Analysis 2020 to 2024 and Forecast 2025 to 2035, By Region
    • 9.1. North America
    • 9.2. Latin America
    • 9.3. Western Europe
    • 9.4. Eastern Europe
    • 9.5. South Asia and Pacific
    • 9.6. East Asia
    • 9.7. Middle East and Africa
  • 10. North America Market Analysis 2020 to 2024 and Forecast 2025 to 2035, By Country
  • 11. Latin America Market Analysis 2020 to 2024 and Forecast 2025 to 2035, By Country
  • 12. Western Europe Market Analysis 2020 to 2024 and Forecast 2025 to 2035, By Country
  • 13. Eastern Europe Market Analysis 2020 to 2024 and Forecast 2025 to 2035, By Country
  • 14. South Asia and Pacific Market Analysis 2020 to 2024 and Forecast 2025 to 2035, By Country
  • 15. East Asia Market Analysis 2020 to 2024 and Forecast 2025 to 2035, By Country
  • 16. Middle East and Africa Market Analysis 2020 to 2024 and Forecast 2025 to 2035, By Country
  • 17. Key Countries Market Analysis
  • 18. Market Structure Analysis
  • 19. Competition Analysis
    • 19.1. Cargill Inc
    • 19.2. Ingredion Inc
    • 19.3. AVEBE U. A
    • 19.4. Tate & Lyle
    • 19.5. ADM Co
    • 19.6. KMC
    • 19.7. Roquette
    • 19.8. Grain Processing Corporation
    • 19.9. Tereos Group
    • 19.10. Emsland Group
  • 20. Assumptions & Acronyms Used
  • 21. Research Methodology

List of Tables

  • Table 1: Global Market Value (USD Billion) Forecast by Region, 2020-2035
  • Table 2: Global Market Volume (Units) Forecast by Region, 2020-2035
  • Table 3: Global Market Value (USD Billion) Forecast by Form, 2020-2035
  • Table 4: Global Market Volume (Units) Forecast by Form, 2020-2035
  • Table 5: Global Market Value (USD Billion) Forecast by Source, 2020-2035
  • Table 6: Global Market Volume (Units) Forecast by Source, 2020-2035
  • Table 7: Global Market Value (USD Billion) Forecast by Application, 2020-2035
  • Table 8: Global Market Volume (Units) Forecast by Application, 2020-2035
  • Table 9: Global Market Value (USD Billion) Forecast by Process, 2020-2035
  • Table 10: Global Market Volume (Units) Forecast by Process, 2020-2035
  • Table 11: North America Market Value (USD Billion) Forecast by Country, 2020-2035
  • Table 12: North America Market Volume (Units) Forecast by Country, 2020-2035
  • Table 13: North America Market Value (USD Billion) Forecast by Form, 2020-2035
  • Table 14: North America Market Volume (Units) Forecast by Form, 2020-2035
  • Table 15: North America Market Value (USD Billion) Forecast by Source, 2020-2035
  • Table 16: North America Market Volume (Units) Forecast by Source, 2020-2035
  • Table 17: North America Market Value (USD Billion) Forecast by Application, 2020-2035
  • Table 18: North America Market Volume (Units) Forecast by Application, 2020-2035
  • Table 19: North America Market Value (USD Billion) Forecast by Process, 2020-2035
  • Table 20: North America Market Volume (Units) Forecast by Process, 2020-2035
  • Table 21: Latin America Market Value (USD Billion) Forecast by Country, 2020-2035
  • Table 22: Latin America Market Volume (Units) Forecast by Country, 2020-2035
  • Table 23: Latin America Market Value (USD Billion) Forecast by Form, 2020-2035
  • Table 24: Latin America Market Volume (Units) Forecast by Form, 2020-2035
  • Table 25: Latin America Market Value (USD Billion) Forecast by Source, 2020-2035
  • Table 26: Latin America Market Volume (Units) Forecast by Source, 2020-2035
  • Table 27: Latin America Market Value (USD Billion) Forecast by Application, 2020-2035
  • Table 28: Latin America Market Volume (Units) Forecast by Application, 2020-2035
  • Table 29: Latin America Market Value (USD Billion) Forecast by Process, 2020-2035
  • Table 30: Latin America Market Volume (Units) Forecast by Process, 2020-2035
  • Table 31: East Asia Market Value (USD Billion) Forecast by Country, 2020-2035
  • Table 32: East Asia Market Volume (Units) Forecast by Country, 2020-2035
  • Table 33: East Asia Market Value (USD Billion) Forecast by Form, 2020-2035
  • Table 34: East Asia Market Volume (Units) Forecast by Form, 2020-2035
  • Table 35: East Asia Market Value (USD Billion) Forecast by Source, 2020-2035
  • Table 36: East Asia Market Volume (Units) Forecast by Source, 2020-2035
  • Table 37: East Asia Market Value (USD Billion) Forecast by Application, 2020-2035
  • Table 38: East Asia Market Volume (Units) Forecast by Application, 2020-2035
  • Table 39: East Asia Market Value (USD Billion) Forecast by Process, 2020-2035
  • Table 40: East Asia Market Volume (Units) Forecast by Process, 2020-2035
  • Table 41: South Asia & Pacific Market Value (USD Billion) Forecast by Country, 2020-2035
  • Table 42: South Asia & Pacific Market Volume (Units) Forecast by Country, 2020-2035
  • Table 43: South Asia & Pacific Market Value (USD Billion) Forecast by Form, 2020-2035
  • Table 44: South Asia & Pacific Market Volume (Units) Forecast by Form, 2020-2035
  • Table 45: South Asia & Pacific Market Value (USD Billion) Forecast by Source, 2020-2035
  • Table 46: South Asia & Pacific Market Volume (Units) Forecast by Source, 2020-2035
  • Table 47: South Asia & Pacific Market Value (USD Billion) Forecast by Application, 2020-2035
  • Table 48: South Asia & Pacific Market Volume (Units) Forecast by Application, 2020-2035
  • Table 49: South Asia & Pacific Market Value (USD Billion) Forecast by Process, 2020-2035
  • Table 50: South Asia & Pacific Market Volume (Units) Forecast by Process, 2020-2035
  • Table 51: Western Europe Market Value (USD Billion) Forecast by Country, 2020-2035
  • Table 52: Western Europe Market Volume (Units) Forecast by Country, 2020-2035
  • Table 53: Western Europe Market Value (USD Billion) Forecast by Form, 2020-2035
  • Table 54: Western Europe Market Volume (Units) Forecast by Form, 2020-2035
  • Table 55: Western Europe Market Value (USD Billion) Forecast by Source, 2020-2035
  • Table 56: Western Europe Market Volume (Units) Forecast by Source, 2020-2035
  • Table 57: Western Europe Market Value (USD Billion) Forecast by Application, 2020-2035
  • Table 58: Western Europe Market Volume (Units) Forecast by Application, 2020-2035
  • Table 59: Western Europe Market Value (USD Billion) Forecast by Process, 2020-2035
  • Table 60: Western Europe Market Volume (Units) Forecast by Process, 2020-2035
  • Table 61: Eastern Europe Market Value (USD Billion) Forecast by Country, 2020-2035
  • Table 62: Eastern Europe Market Volume (Units) Forecast by Country, 2020-2035
  • Table 63: Eastern Europe Market Value (USD Billion) Forecast by Form, 2020-2035
  • Table 64: Eastern Europe Market Volume (Units) Forecast by Form, 2020-2035
  • Table 65: Eastern Europe Market Value (USD Billion) Forecast by Source, 2020-2035
  • Table 66: Eastern Europe Market Volume (Units) Forecast by Source, 2020-2035
  • Table 67: Eastern Europe Market Value (USD Billion) Forecast by Application, 2020-2035
  • Table 68: Eastern Europe Market Volume (Units) Forecast by Application, 2020-2035
  • Table 69: Eastern Europe Market Value (USD Billion) Forecast by Process, 2020-2035
  • Table 70: Eastern Europe Market Volume (Units) Forecast by Process, 2020-2035
  • Table 71: Middle East & Africa Market Value (USD Billion) Forecast by Country, 2020-2035
  • Table 72: Middle East & Africa Market Volume (Units) Forecast by Country, 2020-2035
  • Table 73: Middle East & Africa Market Value (USD Billion) Forecast by Form, 2020-2035
  • Table 74: Middle East & Africa Market Volume (Units) Forecast by Form, 2020-2035
  • Table 75: Middle East & Africa Market Value (USD Billion) Forecast by Source, 2020-2035
  • Table 76: Middle East & Africa Market Volume (Units) Forecast by Source, 2020-2035
  • Table 77: Middle East & Africa Market Value (USD Billion) Forecast by Application, 2020-2035
  • Table 78: Middle East & Africa Market Volume (Units) Forecast by Application, 2020-2035
  • Table 79: Middle East & Africa Market Value (USD Billion) Forecast by Process, 2020-2035
  • Table 80: Middle East & Africa Market Volume (Units) Forecast by Process, 2020-2035

List of Figures

  • Figure 1: Global Market Value (USD Billion) by Form, 2025-2035
  • Figure 2: Global Market Value (USD Billion) by Source, 2025-2035
  • Figure 3: Global Market Value (USD Billion) by Application, 2025-2035
  • Figure 4: Global Market Value (USD Billion) by Process, 2025-2035
  • Figure 5: Global Market Value (USD Billion) by Region, 2025-2035
  • Figure 6: Global Market Value (USD Billion) Analysis by Region, 2020-2035
  • Figure 7: Global Market Volume (Units) Analysis by Region, 2020-2035
  • Figure 8: Global Market Value Share (%) and BPS Analysis by Region, 2025-2035
  • Figure 9: Global Market Y-o-Y Growth (%) Projections by Region, 2025-2035
  • Figure 10: Global Market Value (USD Billion) Analysis by Form, 2020-2035
  • Figure 11: Global Market Volume (Units) Analysis by Form, 2020-2035
  • Figure 12: Global Market Value Share (%) and BPS Analysis by Form, 2025-2035
  • Figure 13: Global Market Y-o-Y Growth (%) Projections by Form, 2025-2035
  • Figure 14: Global Market Value (USD Billion) Analysis by Source, 2020-2035
  • Figure 15: Global Market Volume (Units) Analysis by Source, 2020-2035
  • Figure 16: Global Market Value Share (%) and BPS Analysis by Source, 2025-2035
  • Figure 17: Global Market Y-o-Y Growth (%) Projections by Source, 2025-2035
  • Figure 18: Global Market Value (USD Billion) Analysis by Application, 2020-2035
  • Figure 19: Global Market Volume (Units) Analysis by Application, 2020-2035
  • Figure 20: Global Market Value Share (%) and BPS Analysis by Application, 2025-2035
  • Figure 21: Global Market Y-o-Y Growth (%) Projections by Application, 2025-2035
  • Figure 22: Global Market Value (USD Billion) Analysis by Process, 2020-2035
  • Figure 23: Global Market Volume (Units) Analysis by Process, 2020-2035
  • Figure 24: Global Market Value Share (%) and BPS Analysis by Process, 2025-2035
  • Figure 25: Global Market Y-o-Y Growth (%) Projections by Process, 2025-2035
  • Figure 26: Global Market Attractiveness by Form, 2025-2035
  • Figure 27: Global Market Attractiveness by Source, 2025-2035
  • Figure 28: Global Market Attractiveness by Application, 2025-2035
  • Figure 29: Global Market Attractiveness by Process, 2025-2035
  • Figure 30: Global Market Attractiveness by Region, 2025-2035
  • Figure 31: North America Market Value (USD Billion) by Form, 2025-2035
  • Figure 32: North America Market Value (USD Billion) by Source, 2025-2035
  • Figure 33: North America Market Value (USD Billion) by Application, 2025-2035
  • Figure 34: North America Market Value (USD Billion) by Process, 2025-2035
  • Figure 35: North America Market Value (USD Billion) by Country, 2025-2035
  • Figure 36: North America Market Value (USD Billion) Analysis by Country, 2020-2035
  • Figure 37: North America Market Volume (Units) Analysis by Country, 2020-2035
  • Figure 38: North America Market Value Share (%) and BPS Analysis by Country, 2025-2035
  • Figure 39: North America Market Y-o-Y Growth (%) Projections by Country, 2025-2035
  • Figure 40: North America Market Value (USD Billion) Analysis by Form, 2020-2035
  • Figure 41: North America Market Volume (Units) Analysis by Form, 2020-2035
  • Figure 42: North America Market Value Share (%) and BPS Analysis by Form, 2025-2035
  • Figure 43: North America Market Y-o-Y Growth (%) Projections by Form, 2025-2035
  • Figure 44: North America Market Value (USD Billion) Analysis by Source, 2020-2035
  • Figure 45: North America Market Volume (Units) Analysis by Source, 2020-2035
  • Figure 46: North America Market Value Share (%) and BPS Analysis by Source, 2025-2035
  • Figure 47: North America Market Y-o-Y Growth (%) Projections by Source, 2025-2035
  • Figure 48: North America Market Value (USD Billion) Analysis by Application, 2020-2035
  • Figure 49: North America Market Volume (Units) Analysis by Application, 2020-2035
  • Figure 50: North America Market Value Share (%) and BPS Analysis by Application, 2025-2035
  • Figure 51: North America Market Y-o-Y Growth (%) Projections by Application, 2025-2035
  • Figure 52: North America Market Value (USD Billion) Analysis by Process, 2020-2035
  • Figure 53: North America Market Volume (Units) Analysis by Process, 2020-2035
  • Figure 54: North America Market Value Share (%) and BPS Analysis by Process, 2025-2035
  • Figure 55: North America Market Y-o-Y Growth (%) Projections by Process, 2025-2035
  • Figure 56: North America Market Attractiveness by Form, 2025-2035
  • Figure 57: North America Market Attractiveness by Source, 2025-2035
  • Figure 58: North America Market Attractiveness by Application, 2025-2035
  • Figure 59: North America Market Attractiveness by Process, 2025-2035
  • Figure 60: North America Market Attractiveness by Country, 2025-2035
  • Figure 61: Latin America Market Value (USD Billion) by Form, 2025-2035
  • Figure 62: Latin America Market Value (USD Billion) by Source, 2025-2035
  • Figure 63: Latin America Market Value (USD Billion) by Application, 2025-2035
  • Figure 64: Latin America Market Value (USD Billion) by Process, 2025-2035
  • Figure 65: Latin America Market Value (USD Billion) by Country, 2025-2035
  • Figure 66: Latin America Market Value (USD Billion) Analysis by Country, 2020-2035
  • Figure 67: Latin America Market Volume (Units) Analysis by Country, 2020-2035
  • Figure 68: Latin America Market Value Share (%) and BPS Analysis by Country, 2025-2035
  • Figure 69: Latin America Market Y-o-Y Growth (%) Projections by Country, 2025-2035
  • Figure 70: Latin America Market Value (USD Billion) Analysis by Form, 2020-2035
  • Figure 71: Latin America Market Volume (Units) Analysis by Form, 2020-2035
  • Figure 72: Latin America Market Value Share (%) and BPS Analysis by Form, 2025-2035
  • Figure 73: Latin America Market Y-o-Y Growth (%) Projections by Form, 2025-2035
  • Figure 74: Latin America Market Value (USD Billion) Analysis by Source, 2020-2035
  • Figure 75: Latin America Market Volume (Units) Analysis by Source, 2020-2035
  • Figure 76: Latin America Market Value Share (%) and BPS Analysis by Source, 2025-2035
  • Figure 77: Latin America Market Y-o-Y Growth (%) Projections by Source, 2025-2035
  • Figure 78: Latin America Market Value (USD Billion) Analysis by Application, 2020-2035
  • Figure 79: Latin America Market Volume (Units) Analysis by Application, 2020-2035
  • Figure 80: Latin America Market Value Share (%) and BPS Analysis by Application, 2025-2035
  • Figure 81: Latin America Market Y-o-Y Growth (%) Projections by Application, 2025-2035
  • Figure 82: Latin America Market Value (USD Billion) Analysis by Process, 2020-2035
  • Figure 83: Latin America Market Volume (Units) Analysis by Process, 2020-2035
  • Figure 84: Latin America Market Value Share (%) and BPS Analysis by Process, 2025-2035
  • Figure 85: Latin America Market Y-o-Y Growth (%) Projections by Process, 2025-2035
  • Figure 86: Latin America Market Attractiveness by Form, 2025-2035
  • Figure 87: Latin America Market Attractiveness by Source, 2025-2035
  • Figure 88: Latin America Market Attractiveness by Application, 2025-2035
  • Figure 89: Latin America Market Attractiveness by Process, 2025-2035
  • Figure 90: Latin America Market Attractiveness by Country, 2025-2035
  • Figure 91: East Asia Market Value (USD Billion) by Form, 2025-2035
  • Figure 92: East Asia Market Value (USD Billion) by Source, 2025-2035
  • Figure 93: East Asia Market Value (USD Billion) by Application, 2025-2035
  • Figure 94: East Asia Market Value (USD Billion) by Process, 2025-2035
  • Figure 95: East Asia Market Value (USD Billion) by Country, 2025-2035
  • Figure 96: East Asia Market Value (USD Billion) Analysis by Country, 2020-2035
  • Figure 97: East Asia Market Volume (Units) Analysis by Country, 2020-2035
  • Figure 98: East Asia Market Value Share (%) and BPS Analysis by Country, 2025-2035
  • Figure 99: East Asia Market Y-o-Y Growth (%) Projections by Country, 2025-2035
  • Figure 100: East Asia Market Value (USD Billion) Analysis by Form, 2020-2035
  • Figure 101: East Asia Market Volume (Units) Analysis by Form, 2020-2035
  • Figure 102: East Asia Market Value Share (%) and BPS Analysis by Form, 2025-2035
  • Figure 103: East Asia Market Y-o-Y Growth (%) Projections by Form, 2025-2035
  • Figure 104: East Asia Market Value (USD Billion) Analysis by Source, 2020-2035
  • Figure 105: East Asia Market Volume (Units) Analysis by Source, 2020-2035
  • Figure 106: East Asia Market Value Share (%) and BPS Analysis by Source, 2025-2035
  • Figure 107: East Asia Market Y-o-Y Growth (%) Projections by Source, 2025-2035
  • Figure 108: East Asia Market Value (USD Billion) Analysis by Application, 2020-2035
  • Figure 109: East Asia Market Volume (Units) Analysis by Application, 2020-2035
  • Figure 110: East Asia Market Value Share (%) and BPS Analysis by Application, 2025-2035
  • Figure 111: East Asia Market Y-o-Y Growth (%) Projections by Application, 2025-2035
  • Figure 112: East Asia Market Value (USD Billion) Analysis by Process, 2020-2035
  • Figure 113: East Asia Market Volume (Units) Analysis by Process, 2020-2035
  • Figure 114: East Asia Market Value Share (%) and BPS Analysis by Process, 2025-2035
  • Figure 115: East Asia Market Y-o-Y Growth (%) Projections by Process, 2025-2035
  • Figure 116: East Asia Market Attractiveness by Form, 2025-2035
  • Figure 117: East Asia Market Attractiveness by Source, 2025-2035
  • Figure 118: East Asia Market Attractiveness by Application, 2025-2035
  • Figure 119: East Asia Market Attractiveness by Process, 2025-2035
  • Figure 120: East Asia Market Attractiveness by Country, 2025-2035
  • Figure 121: South Asia & Pacific Market Value (USD Billion) by Form, 2025-2035
  • Figure 122: South Asia & Pacific Market Value (USD Billion) by Source, 2025-2035
  • Figure 123: South Asia & Pacific Market Value (USD Billion) by Application, 2025-2035
  • Figure 124: South Asia & Pacific Market Value (USD Billion) by Process, 2025-2035
  • Figure 125: South Asia & Pacific Market Value (USD Billion) by Country, 2025-2035
  • Figure 126: South Asia & Pacific Market Value (USD Billion) Analysis by Country, 2020-2035
  • Figure 127: South Asia & Pacific Market Volume (Units) Analysis by Country, 2020-2035
  • Figure 128: South Asia & Pacific Market Value Share (%) and BPS Analysis by Country, 2025-2035
  • Figure 129: South Asia & Pacific Market Y-o-Y Growth (%) Projections by Country, 2025-2035
  • Figure 130: South Asia & Pacific Market Value (USD Billion) Analysis by Form, 2020-2035
  • Figure 131: South Asia & Pacific Market Volume (Units) Analysis by Form, 2020-2035
  • Figure 132: South Asia & Pacific Market Value Share (%) and BPS Analysis by Form, 2025-2035
  • Figure 133: South Asia & Pacific Market Y-o-Y Growth (%) Projections by Form, 2025-2035
  • Figure 134: South Asia & Pacific Market Value (USD Billion) Analysis by Source, 2020-2035
  • Figure 135: South Asia & Pacific Market Volume (Units) Analysis by Source, 2020-2035
  • Figure 136: South Asia & Pacific Market Value Share (%) and BPS Analysis by Source, 2025-2035
  • Figure 137: South Asia & Pacific Market Y-o-Y Growth (%) Projections by Source, 2025-2035
  • Figure 138: South Asia & Pacific Market Value (USD Billion) Analysis by Application, 2020-2035
  • Figure 139: South Asia & Pacific Market Volume (Units) Analysis by Application, 2020-2035
  • Figure 140: South Asia & Pacific Market Value Share (%) and BPS Analysis by Application, 2025-2035
  • Figure 141: South Asia & Pacific Market Y-o-Y Growth (%) Projections by Application, 2025-2035
  • Figure 142: South Asia & Pacific Market Value (USD Billion) Analysis by Process, 2020-2035
  • Figure 143: South Asia & Pacific Market Volume (Units) Analysis by Process, 2020-2035
  • Figure 144: South Asia & Pacific Market Value Share (%) and BPS Analysis by Process, 2025-2035
  • Figure 145: South Asia & Pacific Market Y-o-Y Growth (%) Projections by Process, 2025-2035
  • Figure 146: South Asia & Pacific Market Attractiveness by Form, 2025-2035
  • Figure 147: South Asia & Pacific Market Attractiveness by Source, 2025-2035
  • Figure 148: South Asia & Pacific Market Attractiveness by Application, 2025-2035
  • Figure 149: South Asia & Pacific Market Attractiveness by Process, 2025-2035
  • Figure 150: South Asia & Pacific Market Attractiveness by Country, 2025-2035
Dashboard
Dashboard
Dashboard
Dashboard
Dashboard
Dashboard

Full Research Suite comprises of:

Market outlook & trends analysis

Market outlook & trends analysis

Interviews & case studies

Interviews & case studies

Strategic recommendations

Strategic recommendations

Vendor profiles & capabilities analysis

Vendor profiles & capabilities analysis

5-year forecasts

5-year forecasts

8 regions and 60+ country-level data splits

8 regions and 60+ country-level data splits

Market segment data splits

Market segment data splits

12 months of continuous data updates

12 months of continuous data updates

DELIVERED AS:

PDF EXCEL ONLINE

Full Research Suite


$3500

$5000

$6500

Buy Report Now
Similar Industry Reports

Similar Industry Reports

Cold Forging Machine Market

Cold Forging Machine Market Size and Share Forecast Outlook 2025 to 2035

Cold-pressed Oil Market

Cold-Pressed Oil Market Size and Share Forecast Outlook 2025 to 2035

Cold Chain Packaging Market

Cold Chain Packaging Market Size and Share Forecast Outlook 2025 to 2035

Cold Plates Market
Cold Plates Market

Cold Plates Market Size and Share Forecast Outlook 2025 to 2035

Cold-Chain Sensor Encapsulators Market

Cold-Chain Sensor Encapsulators Market Analysis - Size and Share Forecast Outlook 2025 to 2035

Cold-Pressed Fruit Extracts Market

Cold-Pressed Fruit Extracts Market Size and Share Forecast Outlook 2025 to 2035

Cold Heading Wire Market

Cold Heading Wire Market Size and Share Forecast Outlook 2025 to 2035

Cold Insulation Materials Market

Cold Insulation Materials Market Size and Share Forecast Outlook 2025 to 2035

Cold Chain Monitoring Market

Cold Chain Monitoring Market Size and Share Forecast Outlook 2025 to 2035

Cold Finished Iron and Steel Bars and Bar Size Shapes Market

Cold Finished Iron and Steel Bars and Bar Size Shapes Market Size and Share Forecast Outlook 2025 to 2035

Cold Storage Equipment Market

Cold Storage Equipment Market Size and Share Forecast Outlook 2025 to 2035

Cold Laser Therapy Market

Cold Laser Therapy Market Analysis - Size, Share & Forecast 2025 to 2035

Cold Mix Asphalt Market

Cold Mix Asphalt Market Size and Share Forecast Outlook 2025 to 2035

Cold Cuts Market
Cold Cuts Market

Cold Cuts Market Analysis - Size, Share, and Forecast 2025 to 2035

Cold Seal Paper Market

Cold Seal Paper Market Size and Share Forecast Outlook 2025 to 2035

Cold Pain Therapy Market

Cold Pain Therapy Market Size and Share Forecast Outlook 2025 to 2035

Cold Chain Equipment Market

Cold Chain Equipment Market Size and Share Forecast Outlook 2025 to 2035

Cold Chain Logistics Market

Cold Chain Logistics Market Size and Share Forecast Outlook 2025 to 2035

Cold Formed Blister Foil Market

Cold Formed Blister Foil Market Growth - Demand & Forecast 2025 to 2035

Cold Waxed Paper Cups Market

Cold Waxed Paper Cups Market Size and Share Forecast Outlook 2025 to 2035

Future Market Insights

Cold Water Swelling Starch Market

Chat With MaRIA

Chat With

MaRIA

Hi There, I am MaRIA, Your Market Research Intelligence Assistant. How may I help you?