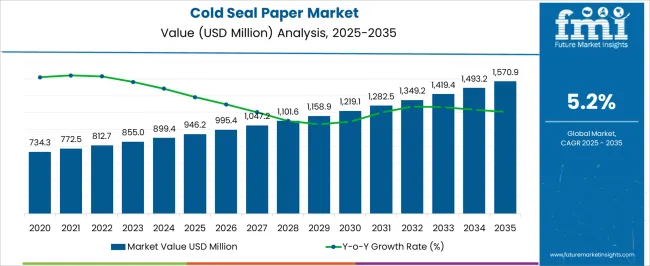
The global cold seal paper market is set to reach a valuation of USD 812.7 Million in 2022, and register a CAGR of 5.2% in the forecast period from 2022 to 2032.
The market is anticipated to be valued at USD 1,349.2 Million by the end of 2032. The top 5 companies are projected to hold around 20 to 25% of the global market share by the end of 2022.
Cold seal paper is a type of paper with a special coating on one side that allows it to be sealed without heat. This type of paper is often used for packaging and mailing applications, as it is easy to use and does not require any special equipment.
Increasing demand for convenient packaging is driving sales of wrapping paper such as cold seal paper by providing a cost-effective and efficient way to package products. Cold seal paper is a packaging material used to create a protective barrier for products.
This type of packaging is ideal for products that require a secure seal such as food, beverages, pharmaceuticals, and others. The convenience of cold seal paper makes it an attractive option for businesses looking to reduce costs and increase efficiency.
Additionally, cold seal paper is recyclable, making it an environmentally friendly choice. Thus, these numerous benefits and increasing demand for convenient packaging are set to propel sales of cold seal paper. The market is projected to grow at a fast pace during the forecast period.
According to a recent FMI report, the global market revenue totaled USD 773.7 Million in 2021. The market is estimated to experience a positive growth outlook during the forecast period with propelling demand from various end-use industries. Thus, the market is projected to create an absolute incremental growth opportunity of USD 575.5 Million during the evaluation period.
The significantly changing food industry has increased the demand for cold seal papers in both developed and developing economies. The market is anticipated to expand 1.7 times the current value during the forecast period.
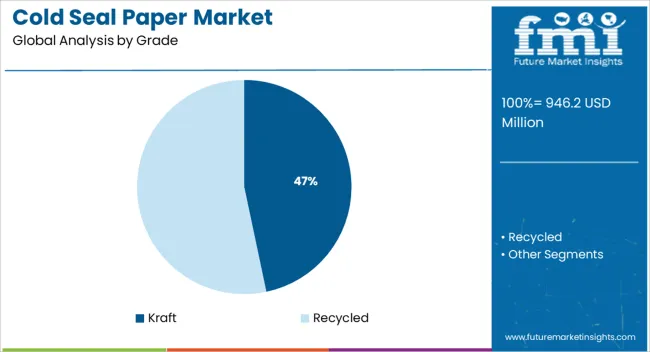
FMI mentions that based on grade, the kraft segment is projected to remain at the forefront among the other grades used for the manufacturing of cold seal paper. The reason behind the same is its superior strength and high durability. The kraft segment is estimated to showcase a CAGR of 5.4% from 2022 to 2032.
Attributes | Key Insights |
---|---|
Cold Seal Paper Market Estimated Size (2022E) | USD 812.7 Million |
Projected Market Valuation (2032F) | USD 1,349.2 Million |
Value-based CAGR (2022 to 2032) | 5.2% |
Collective Value Share: Top 3 Countries (2022E) | 25 to 30% |
The global cold seal paper market witnessed a CAGR of 4.7% during the historical period and reached a valuation of USD 773.7 Million in 2021. Cold seal paper is a type of packaging paper that is used to create a self-adhesive seal.
It is utilized in a wide variety of applications and is especially useful for shipping items that need to remain sealed from dust, water, and other environmental contaminants. Cold seal paper has a waxy or sticky texture which helps it to create a tight seal and is designed to be used without the need for heat or other forms of energy.
The continuously growing food & beverage and food service industries are projected to drive the demand for cold seal papers. Also, increasing demand for convenience and on-the-go packaging solutions is set to aid sales.
Cold seal paper is extensively used to pack a wide variety of food and beverage products, including snacks, sandwiches, salads, and other prepared foods. Overall, the global market is predicted to boost at a faster pace during the forecast period, as compared to the historical period.
A number of influential factors have been identified to stir the soup in the market. Apart from the proliferating aspects prevailing in the market, analysts at FMI have also analyzed the restraining elements, lucrative opportunities, and upcoming threats that can pose a challenge to the progression of the market.
The drivers, restraints, opportunities, and threats (DROTs) identified are as follows:
DRIVERS
RESTRAINTS
OPPORTUNITIES
THREATS
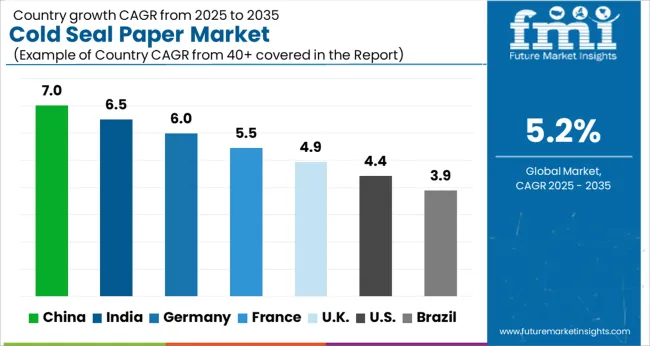
Need for Cohesive Pharmaceutical Packaging Solutions to Fuel Sales in India
The market for cold seal papers in India is projected to expand at a CAGR of 5.7% during the forecast period, finds FMI. India’s pharmaceutical industry is expected to drive the demand for cold seal papers due to the increasing need for such packaging solutions for pharmaceutical products.
According to the Government of India’s Department of Pharmaceuticals, the pharmaceutical industry of India has grown rapidly in recent years. India currently ranks third in the world in terms of volume of production and fourteenth in terms of value, accounting for roughly 10% of the global production in terms of volume and 1.5% in terms of value.
India is also considered to be the world's fourth-largest manufacturer of generic drugs and the seventeenth-largest exporter in terms of the value of bulk actives and dosage forms. Thus, the market for cold seal papers in India is expected to benefit from the increasing demand for cohesive packaging solutions in the pharmaceutical industry.
Expansion of E-commerce in the USA to Propel Demand for Cohesive Cold Seal Packaging
FMI states that the USA market for cold seal papers is anticipated to grow 1.5 times the current market value during the forecast period. The USA is considered to be the most attractive market for cold seal papers due to its large population, high disposable income, and strong demand for convenience products.
Additionally, the USA has a large and growing e-commerce sector, which is driving the demand for cold seal papers. These papers are extensively used to package and ship products across the country. Thus, the USA is expected to develop at a rapid pace in the next ten years.
Sales of Kraft Grade Cold Seal Blister Packs to Surge among Companies Worldwide by 2032
The kraft grade segment is set to lead the global cold seal paper market due to its superior strength and high durability. The segment is expected to witness high growth and generate a share of 76% by the end of 2022. Kraft paper is made from wood pulp and is highly resistant to tearing and puncturing. It is also highly resistant to moisture, making it ideal for use in cold seal applications.
Kraft paper is cost-effective and can be easily customized to meet specific needs. According to the European Federation (EUROSAC), kraft paper is a great fiber source for the recycling industry. Its long, strong fibers are recyclable multiple times.
In the paper industry, these are commonly used as secondary raw materials. Thus, the kraft grade segment is set to dominate the market for cold seal papers and is predicted to get a boost during the forecast period owing to its various benefits.
Food and Beverage Companies Extensively Use Cold Seal Blister Packaging to Prevent Contaminants
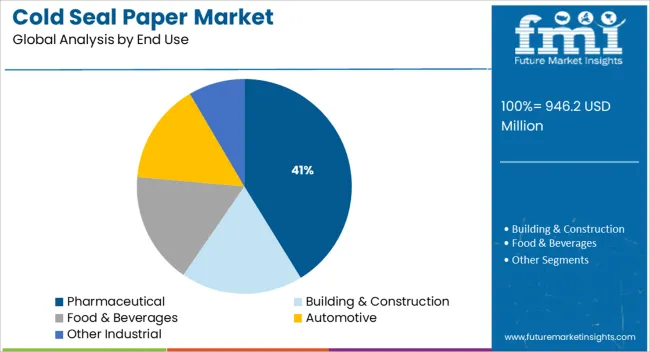
Based on end use, the food & beverage segment is estimated to grow at a fast pace in the global market. It is projected to create an incremental growth opportunity of USD 249 Million during the forecast period.
Cold seal paper is a cost-effective and efficient packaging solution that provides superior protection against moisture, oxygen, and other contaminants. Additionally, this type is recyclable and biodegradable, thereby making it an environmentally friendly packaging solution.
As a result, the food and beverage end-use industry is increasingly turning to cold seal paper to meet its sustainable packaging needs. This would help to create a lucrative growth opportunity for the cold seal paper market share.
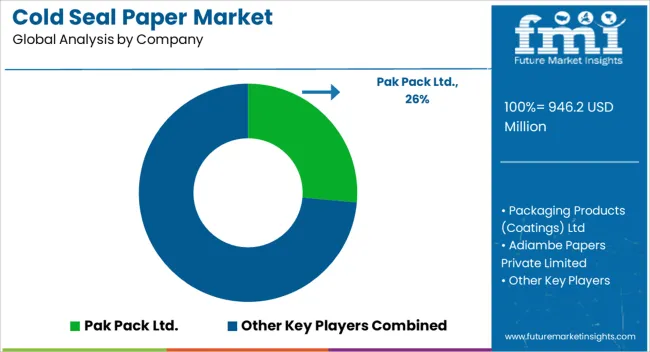
Key players operating in the global cold seal paper market are trying to focus on increasing their sales and revenues by expanding their capabilities to meet the growing demand. These key players are trying to adopt the merger & acquisition strategy to expand their resources.
A few other companies are developing new products to meet the rising customer needs. Also, some of the renowned players are focusing on upgrading their facilities to cater to the surging demand.
Some of the recent key developments by leading players are as follows -
Attribute | Details |
---|---|
Estimated Market Size (2022) | USD 812.7 Million |
Projected Market Valuation (2032) | USD 1,349.2 Million |
Value-based CAGR (2022 to 2032) | 5.2% |
Historical Data | 2015 to 2021 |
Forecast Period | 2022 to 2032 |
Market Analysis | Value (USD Million) and Volume (Tons) |
Report Coverage | Revenue Forecast, Volume Forecast, Company Ranking, Competitive Landscape, Growth Factors, Trends, and Pricing Analysis |
Segments Covered | Grade, Thickness, End Use, Region |
Regions Covered | North America; Latin America; Europe; East Asia; South Asia; Middle East and Africa; Oceania |
Key Countries Covered | USA, Canada, Mexico, Brazil, Germany, United Kingdom, France, Italy, Spain,Russia, China, Japan, India, GCC countries, Australia |
Key Companies Profiled | Pak Pack Ltd; Packaging Products (Coatings) Ltd; Adiambe Papers Private Limited; Angloscand Limited; FFP Packaging Ltd.; Roberts Mart & Co Ltd.; GRAVURE PACKAGING PRODUCTS; American Printpak Inc.; TekniPlex; KOEHLER PAPER; Pregis LLC; Zekun Packaging Technology Co., Ltd.; Artinova Speciality Papers AB |
Table 01: Global Market Value (US$ Million) Forecast by Region, 2015 to 2032
Table 02: Global Market Volume (Tons) Forecast by Region, 2015 to 2032
Table 03: Global Market Value (US$ Million) Forecast by Grade, 2015 to 2032
Table 04: Global Market Volume (Tons) Forecast by Grade, 2015 to 2032
Table 05: Global Market Value (US$ Million) Forecast by Thickness, 2015 to 2032
Table 06: Global Market Volume (Tons) Forecast by Thickness, 2015 to 2032
Table 07: Global Market Value (US$ Million) Forecast by End Use, 2015 to 2032
Table 08: Global Market Volume (Tons) Forecast by End Use, 2015 to 2032
Table 09: North America Market Value (US$ Million) Forecast by Country, 2015 to 2032
Table 10: North America Market Volume (Tons) Forecast by Country, 2015 to 2032
Table 11: North America Market Value (US$ Million) Forecast by Grade, 2015 to 2032
Table 12: North America Market Volume (Tons) Forecast by Grade, 2015 to 2032
Table 13: North America Market Value (US$ Million) Forecast by Thickness, 2015 to 2032
Table 14: North America Market Volume (Tons) Forecast by Thickness, 2015 to 2032
Table 15: North America Market Value (US$ Million) Forecast by End Use, 2015 to 2032
Table 16: North America Market Volume (Tons) Forecast by End Use, 2015 to 2032
Table 17: Latin America Market Value (US$ Million) Forecast by Country, 2015 to 2032
Table 18: Latin America Market Volume (Tons) Forecast by Country, 2015 to 2032
Table 19: Latin America Market Value (US$ Million) Forecast by Grade, 2015 to 2032
Table 20: Latin America Market Volume (Tons) Forecast by Grade, 2015 to 2032
Table 21: Latin America Market Value (US$ Million) Forecast by Thickness, 2015 to 2032
Table 22: Latin America Market Volume (Tons) Forecast by Thickness, 2015 to 2032
Table 23: Latin America Market Value (US$ Million) Forecast by End Use, 2015 to 2032
Table 24: Latin America Market Volume (Tons) Forecast by End Use, 2015 to 2032
Table 25: Europe Market Value (US$ Million) Forecast by Country, 2015 to 2032
Table 26: Europe Market Volume (Tons) Forecast by Country, 2015 to 2032
Table 27: Europe Market Value (US$ Million) Forecast by Grade, 2015 to 2032
Table 28: Europe Market Volume (Tons) Forecast by Grade, 2015 to 2032
Table 29: Europe Market Value (US$ Million) Forecast by Thickness, 2015 to 2032
Table 30: Europe Market Volume (Tons) Forecast by Thickness, 2015 to 2032
Table 31: Europe Market Value (US$ Million) Forecast by End Use, 2015 to 2032
Table 32: Europe Market Volume (Tons) Forecast by End Use, 2015 to 2032
Table 33: East Asia Market Value (US$ Million) Forecast by Country, 2015 to 2032
Table 34: East Asia Market Volume (Tons) Forecast by Country, 2015 to 2032
Table 35: East Asia Market Value (US$ Million) Forecast by Grade, 2015 to 2032
Table 36: East Asia Market Volume (Tons) Forecast by Grade, 2015 to 2032
Table 37: East Asia Market Value (US$ Million) Forecast by Thickness, 2015 to 2032
Table 38: East Asia Market Volume (Tons) Forecast by Thickness, 2015 to 2032
Table 39: East Asia Market Value (US$ Million) Forecast by End Use, 2015 to 2032
Table 40: East Asia Market Volume (Tons) Forecast by End Use, 2015 to 2032
Table 41: South Asia Market Value (US$ Million) Forecast by Country, 2015 to 2032
Table 42: South Asia Market Volume (Tons) Forecast by Country, 2015 to 2032
Table 43: South Asia Market Value (US$ Million) Forecast by Grade, 2015 to 2032
Table 44: South Asia Market Volume (Tons) Forecast by Grade, 2015 to 2032
Table 45: South Asia Market Value (US$ Million) Forecast by Thickness, 2015 to 2032
Table 46: South Asia Market Volume (Tons) Forecast by Thickness, 2015 to 2032
Table 47: South Asia Market Value (US$ Million) Forecast by End Use, 2015 to 2032
Table 48: South Asia Market Volume (Tons) Forecast by End Use, 2015 to 2032
Table 49: Oceania Market Value (US$ Million) Forecast by Country, 2015 to 2032
Table 50: Oceania Market Volume (Tons) Forecast by Country, 2015 to 2032
Table 51: Oceania Market Value (US$ Million) Forecast by Grade, 2015 to 2032
Table 52: Oceania Market Volume (Tons) Forecast by Grade, 2015 to 2032
Table 53: Oceania Market Value (US$ Million) Forecast by Thickness, 2015 to 2032
Table 54: Oceania Market Volume (Tons) Forecast by Thickness, 2015 to 2032
Table 55: Oceania Market Value (US$ Million) Forecast by End Use, 2015 to 2032
Table 56: Oceania Market Volume (Tons) Forecast by End Use, 2015 to 2032
Table 57: MEA Market Value (US$ Million) Forecast by Country, 2015 to 2032
Table 58: MEA Market Volume (Tons) Forecast by Country, 2015 to 2032
Table 59: MEA Market Value (US$ Million) Forecast by Grade, 2015 to 2032
Table 60: MEA Market Volume (Tons) Forecast by Grade, 2015 to 2032
Table 61: MEA Market Value (US$ Million) Forecast by Thickness, 2015 to 2032
Table 62: MEA Market Volume (Tons) Forecast by Thickness, 2015 to 2032
Table 63: MEA Market Value (US$ Million) Forecast by End Use, 2015 to 2032
Table 64: MEA Market Volume (Tons) Forecast by End Use, 2015 to 2032
Table 65: U.S. Market Value (US$ Million) Forecast by Grade, Thickness, and End Use (2022(E) & 2032(F))
Table 66: Canada Market Value (US$ Million) Forecast by Grade, Thickness, and End Use (2022(E) & 2032(F))
Table 67: Brazil Market Value (US$ Million) Forecast by Grade, Thickness, and End Use (2022(E) & 2032(F))
Table 68: Mexico Market Value (US$ Million) Forecast by Grade, Thickness, and End Use (2022(E) & 2032(F))
Table 69: Germany Market Value (US$ Million) Forecast by Grade, Thickness, and End Use (2022(E) & 2032(F))
Table 70: Italy Market Value (US$ Million) Forecast by Grade, Thickness, and End Use (2022(E) & 2032(F))
Table 71: France Market Value (US$ Million) Forecast by Grade, Thickness, and End Use (2022(E) & 2032(F))
Table 72: Spain Market Value (US$ Million) Forecast by Grade, Thickness, and End Use (2022(E) & 2032(F))
Table 73: U.K. Market Value (US$ Million) Forecast by Grade, Thickness, and End Use (2022(E) & 2032(F))
Table 74: Russia Market Value (US$ Million) Forecast by Grade, Thickness, and End Use (2022(E) & 2032(F))
Table 75: China Market Value (US$ Million) Forecast by Grade, Thickness, and End Use (2022(E) & 2032(F))
Table 76: Japan Market Value (US$ Million) Forecast by Grade, Thickness, and End Use (2022(E) & 2032(F))
Table 77: India Market Value (US$ Million) Forecast by Grade, Thickness, and End Use (2022(E) & 2032(F))
Table 78: GCC Countries Market Value (US$ Million) Forecast by Grade, Thickness, and End Use (2022(E) & 2032(F))
Table 79: Australia Market Value (US$ Million) Forecast by Grade, Thickness, and End Use (2022(E) & 2032(F))
Figure 01: Global Market Value (US$ Million) by Grade, 2022 to 2032
Figure 02: Global Market Value (US$ Million) by Thickness, 2022 to 2032
Figure 03: Global Market Value (US$ Million) by End Use, 2022 to 2032
Figure 04: Global Market Value (US$ Million) by Region, 2022 to 2032
Figure 05: Global Market Value (US$ Million) Analysis by Region, 2015 to 2021
Figure 06: Global Market Volume (Tons) Analysis by Region, 2015 to 2032
Figure 07: Global Market Value Share (%) and BPS Analysis by Region, 2022 & 2032
Figure 08: Global Market Y-o-Y Growth (%) Projections by Region, 2022 to 2032
Figure 09: Global Market Value (US$ Million) Analysis by Grade, 2015 to 2021
Figure 10: Global Market Volume (Tons) Analysis by Grade, 2015 to 2032
Figure 11: Global Market Value Share (%) and BPS Analysis by Grade, 2022 & 2032
Figure 12: Global Market Y-o-Y Growth (%) Projections by Grade, 2022 to 2032
Figure 13: Global Market Value (US$ Million) Analysis by Thickness, 2015 to 2021
Figure 14: Global Market Volume (Tons) Analysis by Thickness, 2015 to 2032
Figure 15: Global Market Value Share (%) and BPS Analysis by Thickness, 2022 & 2032
Figure 16: Global Market Y-o-Y Growth (%) Projections by Thickness, 2022 to 2032
Figure 17: Global Market Value (US$ Million) Analysis by End Use, 2015 to 2021
Figure 18: Global Market Volume (Tons) Analysis by End Use, 2015 to 2032
Figure 19: Global Market Value Share (%) and BPS Analysis by End Use, 2022 & 2032
Figure 20: Global Market Y-o-Y Growth (%) Projections by End Use, 2022 to 2032
Figure 21: Global Market Attractiveness by Grade, 2022 to 2032
Figure 22: Global Market Attractiveness by Thickness, 2022 to 2032
Figure 23: Global Market Attractiveness by Application, 2022 to 2032
Figure 24: Global Market Attractiveness by End Use, 2022 to 2032
Figure 25: Global Market Attractiveness by Region, 2022 to 2032
Figure 26: North America Market Value (US$ Million) by Grade, 2022 to 2032
Figure 27: North America Market Value (US$ Million) by Thickness, 2022 to 2032
Figure 28: North America Market Value (US$ Million) by End Use, 2022 to 2032
Figure 29: North America Market Value (US$ Million) by Country, 2022 to 2032
Figure 30: North America Market Value (US$ Million) Analysis by Country, 2015 to 2021
Figure 31: North America Market Volume (Tons) Analysis by Country, 2015 to 2032
Figure 32: North America Market Value Share (%) and BPS Analysis by Country, 2022 & 2032
Figure 33: North America Market Y-o-Y Growth (%) Projections by Country, 2022 to 2032
Figure 34: North America Market Value (US$ Million) Analysis by Grade, 2015 to 2021
Figure 35: North America Market Volume (Tons) Analysis by Grade, 2015 to 2032
Figure 36: North America Market Value Share (%) and BPS Analysis by Grade, 2022 & 2032
Figure 37: North America Market Y-o-Y Growth (%) Projections by Grade, 2022 to 2032
Figure 38: North America Market Value (US$ Million) Analysis by Thickness, 2015 to 2021
Figure 39: North America Market Volume (Tons) Analysis by Thickness, 2015 to 2032
Figure 40: North America Market Value Share (%) and BPS Analysis by Thickness, 2022 & 2032
Figure 41: North America Market Y-o-Y Growth (%) Projections by Thickness, 2022 to 2032
Figure 42: North America Market Value (US$ Million) Analysis by End Use, 2015 to 2021
Figure 43: North America Market Volume (Tons) Analysis by End Use, 2015 to 2032
Figure 44: North America Market Value Share (%) and BPS Analysis by End Use, 2022 & 2032
Figure 45: North America Market Y-o-Y Growth (%) Projections by End Use, 2022 to 2032
Figure 46: North America Market Attractiveness by Grade, 2022 to 2032
Figure 47: North America Market Attractiveness by Thickness, 2022 to 2032
Figure 48: North America Market Attractiveness by End Use, 2022 to 2032
Figure 49: North America Market Attractiveness by Country, 2022 to 2032
Figure 50: Latin America Market Value (US$ Million) by Grade, 2022 & 2032
Figure 51: Latin America Market Value (US$ Million) by Thickness, 2022 to 2032
Figure 52: Latin America Market Value (US$ Million) by End Use, 2022 to 2032
Figure 53: Latin America Market Value (US$ Million) by Country, 2022 to 2032
Figure 54: Latin America Market Value (US$ Million) Analysis by Country, 2015 to 2021
Figure 55: Latin America Market Volume (Tons) Analysis by Country, 2015 to 2032
Figure 56: Latin America Market Value Share (%) and BPS Analysis by Country, 2022 & 2032
Figure 57: Latin America Market Y-o-Y Growth (%) Projections by Country, 2022 to 2032
Figure 58: Latin America Market Value (US$ Million) Analysis by Grade, 2015 to 2021
Figure 59: Latin America Market Volume (Tons) Analysis by Grade, 2015 to 2032
Figure 60: Latin America Market Value Share (%) and BPS Analysis by Grade, 2022 & 2032
Figure 61: Latin America Market Y-o-Y Growth (%) Projections by Grade, 2022 to 2032
Figure 62: Latin America Market Value (US$ Million) Analysis by Thickness, 2015 to 2021
Figure 63: Latin America Market Volume (Tons) Analysis by Thickness, 2015 to 2032
Figure 64: Latin America Market Value Share (%) and BPS Analysis by Thickness, 2022 & 2032
Figure 65: Latin America Market Y-o-Y Growth (%) Projections by Thickness, 2022 to 2032
Figure 66: Latin America Market Value (US$ Million) Analysis by End Use, 2015 to 2021
Figure 67: Latin America Market Volume (Tons) Analysis by End Use, 2015 to 2032
Figure 68: Latin America Market Value Share (%) and BPS Analysis by End Use, 2022 & 2032
Figure 69: Latin America Market Y-o-Y Growth (%) Projections by End Use, 2022 to 2032
Figure 70: Latin America Market Attractiveness by Grade, 2022 to 2032
Figure 71: Latin America Market Attractiveness by Thickness, 2022 to 2032
Figure 72: Latin America Market Attractiveness by End Use, 2022 to 2032
Figure 73: Latin America Market Attractiveness by Country, 2022 to 2032
Figure 74: Europe Market Value (US$ Million) by Grade, 2022 to 2032
Figure 75: Europe Market Value (US$ Million) by Thickness, 2022 to 2032
Figure 76: Europe Market Value (US$ Million) by End Use, 2022 to 2032
Figure 77: Europe Market Value (US$ Million) by Country, 2022 to 2032
Figure 78: Europe Market Value (US$ Million) Analysis by Country, 2015 to 2021
Figure 79: Europe Market Volume (Tons) Analysis by Country, 2015 to 2032
Figure 80: Europe Market Value Share (%) and BPS Analysis by Country, 2022 & 2032
Figure 81: Europe Market Y-o-Y Growth (%) Projections by Country, 2022 to 2032
Figure 82: Europe Market Value (US$ Million) Analysis by Grade, 2015 to 2021
Figure 83: Europe Market Volume (Tons) Analysis by Grade, 2015 to 2032
Figure 84: Europe Market Value Share (%) and BPS Analysis by Grade, 2022 & 2032
Figure 85: Europe Market Y-o-Y Growth (%) Projections by Grade, 2022 to 2032
Figure 86: Europe Market Value (US$ Million) Analysis by Thickness, 2015 to 2021
Figure 87: Europe Market Volume (Tons) Analysis by Thickness, 2015 to 2032
Figure 88: Europe Market Value Share (%) and BPS Analysis by Thickness, 2022 & 2032
Figure 89: Europe Market Y-o-Y Growth (%) Projections by Thickness, 2022 to 2032
Figure 90: Europe Market Value (US$ Million) Analysis by End Use, 2015 to 2021
Figure 91: Europe Market Volume (Tons) Analysis by End Use, 2015 to 2032
Figure 92: Europe Market Value Share (%) and BPS Analysis by End Use, 2022 & 2032
Figure 93: Europe Market Y-o-Y Growth (%) Projections by End Use, 2022 to 2032
Figure 94: Europe Market Attractiveness by Grade, 2022 to 2032
Figure 95: Europe Market Attractiveness by Thickness, 2022 to 2032
Figure 96: Europe Market Attractiveness by End Use, 2022 to 2032
Figure 97: Europe Market Attractiveness by Country, 2022 to 2032
Figure 98: East Asia Market Value (US$ Million) by Grade, 2022 to 2032
Figure 99: East Asia Market Value (US$ Million) by Thickness, 2022 to 2032
Figure 100: East Asia Market Value (US$ Million) by End Use, 2022 to 2032
Figure 101: East Asia Market Value (US$ Million) by Country, 2022 to 2032
Figure 102: East Asia Market Value (US$ Million) Analysis by Country, 2015 to 2021
Figure 103: East Asia Market Volume (Tons) Analysis by Country, 2015 to 2032
Figure 104: East Asia Market Value Share (%) and BPS Analysis by Country, 2022 & 2032
Figure 105: East Asia Market Y-o-Y Growth (%) Projections by Country, 2022 to 2032
Figure 106: East Asia Market Value (US$ Million) Analysis by Grade, 2015 to 2021
Figure 107: East Asia Market Volume (Tons) Analysis by Grade, 2015 to 2032
Figure 108: East Asia Market Value Share (%) and BPS Analysis by Grade, 2022 & 2032
Figure 109: East Asia Market Y-o-Y Growth (%) Projections by Grade, 2022 to 2032
Figure 110: East Asia Market Value (US$ Million) Analysis by Thickness, 2015 to 2021
Figure 111: East Asia Market Volume (Tons) Analysis by Thickness, 2015 to 2032
Figure 112: East Asia Market Value Share (%) and BPS Analysis by Thickness, 2022 & 2032
Figure 113: East Asia Market Y-o-Y Growth (%) Projections by Thickness, 2022 to 2032
Figure 114: East Asia Market Value (US$ Million) Analysis by End Use, 2015 to 2021
Figure 115: East Asia Market Volume (Tons) Analysis by End Use, 2015 to 2032
Figure 116: East Asia Market Value Share (%) and BPS Analysis by End Use, 2022 & 2032
Figure 117: East Asia Market Y-o-Y Growth (%) Projections by End Use, 2022 to 2032
Figure 118: East Asia Market Attractiveness by Grade, 2022 to 2032
Figure 119: East Asia Market Attractiveness by Thickness, 2022 to 2032
Figure 120: East Asia Market Attractiveness by End Use, 2022 to 2032
Figure 121: East Asia Market Attractiveness by Country, 2022 to 2032
Figure 122: South Asia Market Value (US$ Million) by Grade, 2022 to 2032
Figure 123: South Asia Market Value (US$ Million) by Thickness, 2022 to 2032
Figure 124: South Asia Market Value (US$ Million) by End Use, 2022 to 2032
Figure 125: South Asia Market Value (US$ Million) by Country, 2022 to 2032
Figure 126: South Asia Market Value (US$ Million) Analysis by Country, 2015 to 2021
Figure 127: South Asia Market Volume (Tons) Analysis by Country, 2015 to 2032
Figure 128: South Asia Market Value Share (%) and BPS Analysis by Country, 2022 & 2032
Figure 129: South Asia Market Y-o-Y Growth (%) Projections by Country, 2022 to 2032
Figure 130: South Asia Market Value (US$ Million) Analysis by Grade, 2015 to 2021
Figure 131: South Asia Market Volume (Tons) Analysis by Grade, 2015 to 2032
Figure 132: South Asia Market Value Share (%) and BPS Analysis by Grade, 2022 & 2032
Figure 133: South Asia Market Y-o-Y Growth (%) Projections by Grade, 2022 to 2032
Figure 134: South Asia Market Value (US$ Million) Analysis by Thickness, 2015 to 2021
Figure 135: South Asia Market Volume (Tons) Analysis by Thickness, 2015 to 2032
Figure 136: South Asia Market Value Share (%) and BPS Analysis by Thickness, 2022 & 2032
Figure 137: South Asia Market Y-o-Y Growth (%) Projections by Thickness, 2022 to 2032
Figure 138: South Asia Market Value (US$ Million) Analysis by End Use, 2015 to 2021
Figure 139: South Asia Market Volume (Tons) Analysis by End Use, 2015 to 2032
Figure 140: South Asia Market Value Share (%) and BPS Analysis by End Use, 2022 & 2032
Figure 141: South Asia Market Y-o-Y Growth (%) Projections by End Use, 2022 to 2032
Figure 142: South Asia Market Attractiveness by Grade, 2022 to 2032
Figure 143: South Asia Market Attractiveness by Thickness, 2022 to 2032
Figure 144: South Asia Market Attractiveness by End Use, 2022 to 2032
Figure 145: South Asia Market Attractiveness by Country, 2022 to 2032
Figure 146: Oceania Market Value (US$ Million) by Grade, 2022 to 2032
Figure 147: Oceania Market Value (US$ Million) by Thickness, 2022 to 2032
Figure 148: Oceania Market Value (US$ Million) by End Use, 2022 to 2032
Figure 149: Oceania Market Value (US$ Million) by Country, 2022 to 2032
Figure 150: Oceania Market Value (US$ Million) Analysis by Country, 2015 to 2021
Figure 151: Oceania Market Volume (Tons) Analysis by Country, 2015 to 2032
Figure 152: Oceania Market Value Share (%) and BPS Analysis by Country, 2022 & 2032
Figure 153: Oceania Market Y-o-Y Growth (%) Projections by Country, 2022 to 2032
Figure 154: Oceania Market Value (US$ Million) Analysis by Grade, 2015 to 2021
Figure 155: Oceania Market Volume (Tons) Analysis by Grade, 2015 to 2032
Figure 156: Oceania Market Value Share (%) and BPS Analysis by Grade, 2022 & 2032
Figure 157: Oceania Market Y-o-Y Growth (%) Projections by Grade, 2022 to 2032
Figure 158: Oceania Market Value (US$ Million) Analysis by Thickness, 2015 to 2021
Figure 159: Oceania Market Volume (Tons) Analysis by Thickness, 2015 to 2032
Figure 160: Oceania Market Value Share (%) and BPS Analysis by Thickness, 2022 & 2032
Figure 161: Oceania Market Y-o-Y Growth (%) Projections by Thickness, 2022 to 2032
Figure 162: Oceania Market Value (US$ Million) Analysis by End Use, 2015 to 2021
Figure 163: Oceania Market Volume (Tons) Analysis by End Use, 2015 to 2032
Figure 164: Oceania Market Value Share (%) and BPS Analysis by End Use, 2022 & 2032
Figure 165: Oceania Market Y-o-Y Growth (%) Projections by End Use, 2022 to 2032
Figure 166: Oceania Market Attractiveness by Grade, 2022 to 2032
Figure 167: Oceania Market Attractiveness by Thickness, 2022 to 2032
Figure 168: Oceania Market Attractiveness by End Use, 2022 to 2032
Figure 169 Oceania Market Attractiveness by Country, 2022 to 2032
Figure 170: MEA Market Value (US$ Million) by Grade, 2022 to 2032
Figure 171: MEA Market Value (US$ Million) by Thickness, 2022 to 2032
Figure 172: MEA Market Value (US$ Million) by End Use, 2022 to 2032
Figure 173: MEA Market Value (US$ Million) by Country, 2022 to 2032
Figure 174: MEA Market Value (US$ Million) Analysis by Country, 2015 to 2021
Figure 175: MEA Market Volume (Tons) Analysis by Country, 2015 to 2032
Figure 176: MEA Market Value Share (%) and BPS Analysis by Country, 2022 & 2032
Figure 177: MEA Market Y-o-Y Growth (%) Projections by Country, 2022 to 2032
Figure 178: MEA Market Value (US$ Million) Analysis by Grade, 2015 to 2021
Figure 179: MEA Market Volume (Tons) Analysis by Grade, 2015 to 2032
Figure 180: MEA Market Value Share (%) and BPS Analysis by Grade, 2022 & 2032
Figure 181: MEA Market Y-o-Y Growth (%) Projections by Grade, 2022 to 2032
Figure 182: MEA Market Value (US$ Million) Analysis by Thickness, 2015 to 2021
Figure 183: MEA Market Volume (Tons) Analysis by Thickness, 2015 to 2032
Figure 184: MEA Market Value Share (%) and BPS Analysis by Thickness, 2022 & 2032
Figure 185: MEA Market Y-o-Y Growth (%) Projections by Thickness, 2022 to 2032
Figure 186: MEA Market Value (US$ Million) Analysis by End Use, 2015 to 2021
Figure 187: MEA Market Volume (Tons) Analysis by End Use, 2015 to 2032
Figure 188: MEA Market Value Share (%) and BPS Analysis by End Use, 2022 & 2032
Figure 189: MEA Market Y-o-Y Growth (%) Projections by End Use, 2022 to 2032
Figure 190: MEA Market Attractiveness by Grade, 2022 to 2032
Figure 191: MEA Market Attractiveness by Thickness, 2022 to 2032
Figure 192: MEA Market Attractiveness by End Use, 2022 to 2032
Figure 193 MEA Market Attractiveness by Country, 2022 to 2032
In 2021, the value of the global market for cold seal papers was USD 773.7 Million.
During the forecast period, the global market for cold seal papers is anticipated to expand at a CAGR of 5.2%.
The global market for cold seal papers is expected to reach USD 1,349.2 Million by the end of 2032.
During the forecast period, the kraft grade segment is likely to dominate the global market for cold seal papers.
The increasing need for self-sealing packaging solutions is set to drive the demand for cold seal papers across the globe.
Pak Pack Ltd, Packaging Products (Coatings) Ltd, Adiambe Papers Private Limited, Pregis LLC, Angloscand Limited, and FFP Packaging Ltd. are the top players supplementing the sales of cold seal papers.
As per the FMI analysis, the demand for cold seal papers is projected to expand at a CAGR of 5.7% from 2022 to 2032 in India.
Explore Similar Insights
Thank you!
You will receive an email from our Business Development Manager. Please be sure to check your SPAM/JUNK folder too.