Cold Form Foil Market Size and Share Forecast Outlook 2025 to 2035

The global cold form foil market is projected to expand from USD 3.2 billion in 2025 to USD 5.7 billion by 2035, registering a CAGR of 6.1% over the forecast period. Demand is concentrated in barrier-grade pharmaceutical packaging, where aluminum-based foils dominate on account of moisture resistance and dosage integrity.
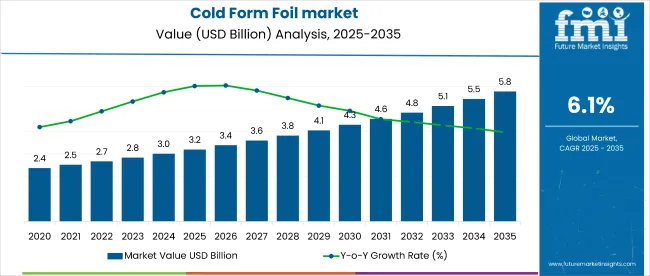
Quick Stats for Cold Form Foil market

  • Market Value (2025): USD 3.2 billion
  • Market Value (2035): USD 5.7 billion
  • CAGR (2025 to 2035): 6.1%
  • Largest Product Type: Aluminum - 64% share
  • Leading Technology: Cold Forming - 71% share
  • Top Application: Pharmaceuticals - 58% share

Cold Form Foil Market

Metric Value
Estimated Size (2025E) USD 3.2 billion
Projected Value (2035F) USD 5.7 billion
CAGR (2025 to 2035) 6.1%

In 2025, the cold form foil market accounts for approximately 3.4% of the global pharmaceutical packaging market, estimated at USD 94 billion, reflecting its niche yet critical role in primary packaging security.

Market expansion is driven by stringent pharmaceutical serialization mandates and increased demand for unit-dose packaging both contributing to a 12.5% rise in cold form foil usage in regulated markets between 2020 and 2025. However, high raw material dependency on aluminum and its price volatility up 9.3% YoY in 2024 continues to restrain profitability across mid-tier converters.

The market also reflects a visible shift toward multi-layer laminate design and high-barrier structures with predictive seal integrity testing, a trend that has seen adoption rates increase 2.1x since 2021 among large-scale pharmaceutical packagers.

From 2025 onward, regulatory scrutiny is expected to intensify, particularly in pharmaceutical packaging compliance. The USA FDA’s final DSCSA enforcement phase requires full unit-level traceability, prompting a shift toward tamper-evident and serialized cold form foil blisters.

In the EU, Annex 1 revisions to GMP for sterile products now emphasize container closure integrity testing boosting demand for multilayer foil formats. Meanwhile, India’s Ministry of Health has mandated QR coding on top-selling drug formulations starting April 2026, accelerating serialization investments by over 18% across domestic manufacturers.

Analyzing Cold Form Foil Market by Top Investment Segments

The cold form foil market has been segmented by Product Type (Aluminum, Plastic Film, Others) by Technology (Thermoforming, Cold Forming) and by Application (Food, Pharmaceuticals, Consumer Products, Industrial Goods, Others). Regional analysis covers North America, Latin America, Western Europe, Eastern Europe, East Asia, South Asia & Pacific, and Middle East & Africa.
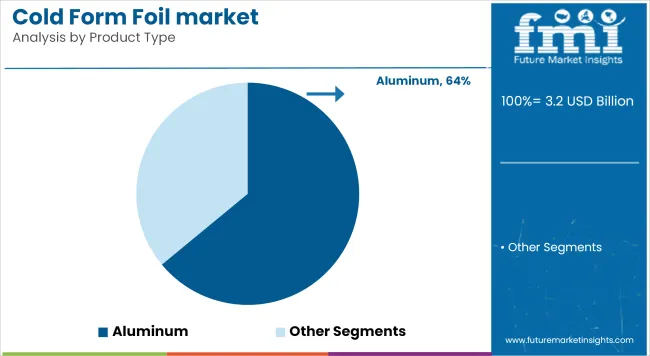
By Product Type - Aluminum to Lead with 64% Share in 2025

Cold Form Foil Market Analysis By Product Type

In 2025, Aluminum holds the dominant share of 64% in the cold form foil market, supported by its superior barrier properties and compatibility with pharmaceutical-grade laminates. Its edge lies in extending shelf life for high-sensitivity formulations and reducing oxygen ingress below 0.001 cc/m²/day.

Growth is driven by:
  • Regulatory preference for non-permeable primary packaging in critical drugs.
  • Expansion of aluminum foil rolling capacity-particularly a 15 KT annual bump announced in India and China by 2026.

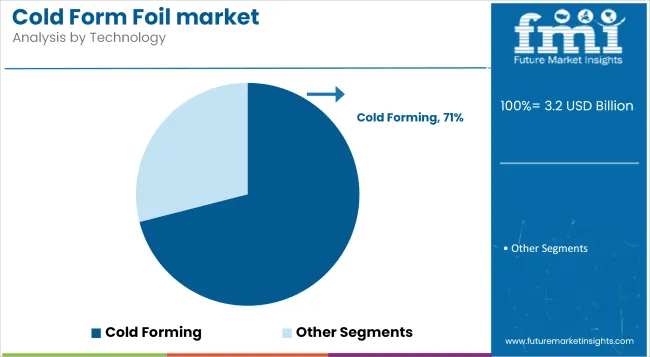
By Technology - Cold Forming Dominates with 71% Share in 2025

Cold Form Foil Market Analysis By Technology

Cold forming accounts for 71% of the technology segment in 2025, owing to its superior protection against moisture, oxygen, and light-critical for highly sensitive pharmaceutical actives. This method ensures zero thermal stress, preserving drug stability during blister formation.

Two growth levers are accelerating adoption:
  • Surge in unit-dose prescription packaging-up 17% in hospital settings between 2020-2024.
  • Regulatory emphasis on container-closure integrity (CCI), especially post-EU GMP Annex 1 revision.
  • Yet, one friction point persists-tooling costs for precision die sets, which rose by 12-14% globally in 2024 due to increased demand and limited OEM supply capacity. For contract packagers, this deters frequent format changes.

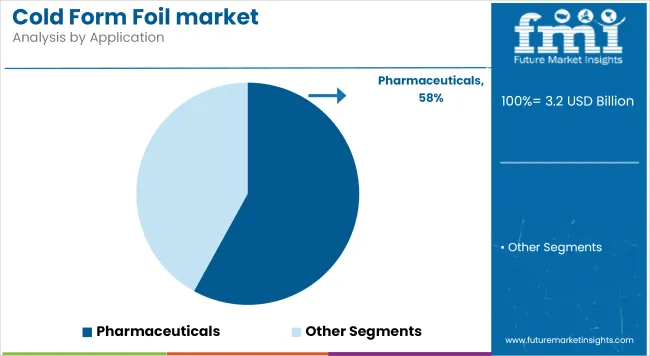
By Application - Pharmaceuticals to Hold 58% Share in 2025

Cold Form Foil Market Analysis By Application

In 2025, Pharmaceuticals dominate the application segment with a commanding 58% share, led by blister packaging for solid oral dosage forms. Its lead stems from regulatory-driven serialization and tamper-evident mandates, particularly in the USA, EU, and India.

A structural challenge lies in disposal logistics:
  • laminated foils pose recycling issues due to bonded aluminum-plastic layers. As a result, European regulators are pushing for redesign-France’s eco-modulation scheme has already penalized non-recyclable formats by 5-10% in 2025.
  • Pharmaceuticals contribute 58% to cold form foil demand (FMI, 2025)

Global Cold Form Foil Market - Country-wise Analysis

Country Wise Analysis Of Cold Form Foil Market

Country-level dynamics in the cold form foil market are shaped by healthcare expenditure intensity, pharmaceutical manufacturing maturity, and national packaging compliance regimes. Markets such as the USA, Germany, and Japan are regulation-led, with higher per capita drug packaging output and earlier adoption of cold form foil for stability-critical drugs.

In contrast, China and India exhibit volume-driven growth, fueled by contract manufacturing scale, government incentives, and expanding domestic generics markets. Meanwhile, the UK and South Korea are transitioning toward traceable, tamper-proof formats in retail and institutional channels alike. Across these economies, growth rates vary, but the pivot to foil-based, barrier-grade pharma packaging is consistent.

United States Cold Form Foil Market Analysis

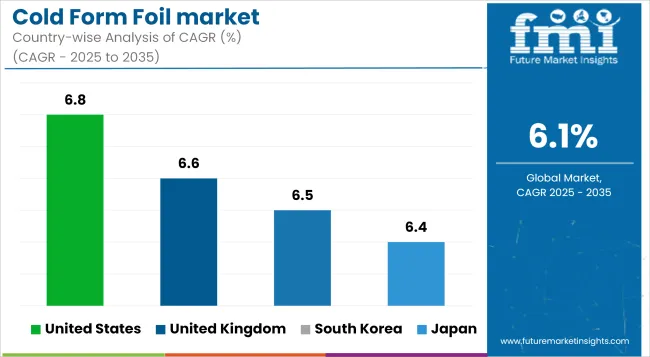
The USA market is projected to grow at a CAGR of 6.8% between 2025 and 2035, driven by DSCSA enforcement mandating serialized, tamper-evident packaging across the pharmaceutical supply chain. Demand is primarily concentrated in solid-dose blister formats, with uptake accelerating in chronic care and specialty drugs.

Margins are supported by mass-scale foil laminate production and high private-label penetration, but a friction point remains in tooling retrofits for small-batch CMOs-raising costs by up to 14% per line in 2024. Regulatory alignment has increased serialization compliance to over 92% among branded pharma firms.

Consumer data shows 72% of Americans consider traceability a marker of medicine quality (HDA Survey, 2025), supporting continued cold-form foil adoption in retail and mail-order channels.

  • DSCSA implementation deadline fully active in 2025
  • Serialization adoption in USA branded pharma: 92%

United Kingdom Cold Form Foil Demand Analysis

The UK cold form foil market is expected to expand at a CAGR of 6.6% through 2035, with stability-led packaging dominating post-Brexit regulatory transitions. NHS procurement now favors serialized, recyclable blister packs, especially in high-volume generics.

While margin gains are seen in multilayer barrier formats, firms face drag from compliance costs with MHRA traceability rules-up 18% YoY in 2024. Direct-to-pharmacy distribution models also require real-time pack-level tracking infrastructure.

  • MHRA-compliant serialization costs up 18% YoY
  • 68% of patients equate foil packs with dosing accuracy
  • Recyclable foil adoption in NHS tenders reached 44% in 2024

South Korea Cold Form Foil Market - 2025 Snapshot & Outlook

South Korea is poised to grow at a CAGR of 6.5%, supported by universal health coverage and strict pharmaceutical stability standards under MFDS oversight. Cold form foil is heavily used in prescription retail packs and hospital-dose formats.

Margins improve via localized foil conversion operations, but dependency on imported base foil stock raises input costs-averaging USD 2,420/ton in 2024. Korea's “Safe Packaging” directive, updated in 2025, mandates multilayer barrier protection for sensitive APIs.

Japan Cold Form Foil Market - 2025 Snapshot & Outlook

Japan’s cold form foil market is projected to rise at a 6.4% CAGR from 2025 to 2035, driven by a high share of elderly population and increased demand for patient-compliance packaging formats. Reimbursement-linked packaging innovation has incentivized use of foil-based unit-dose packs.

Margins are pressured by high labor and tooling costs, with automated blistering lines requiring retrofits exceeding USD 75,000 per site in 2024. Nonetheless, regulation is supportive PMDA mandates now require moisture transmission rates under 0.001 g/m²/day for several drug classes.
  • PMDA tightens MTR thresholds for key APIs
  • Retrofit costs for automation exceed USD 75,000/site
  • 66% consumer preference for foil-based packaging

Cold Form Foil Market Players and Strategies

Cold Form Foil Market Analysis By Company

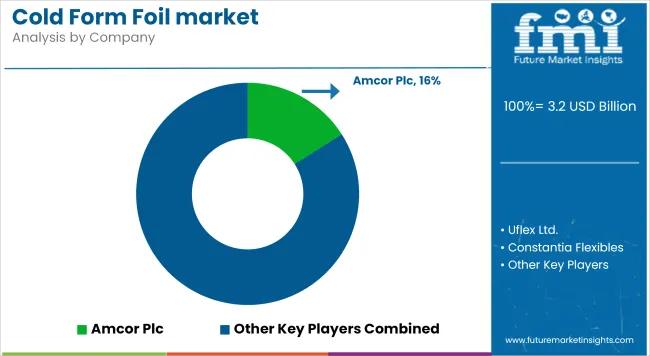
The players in the cold form foil market are focusing on high-barrier laminate innovation and sustainability-aligned designs to meet tightening pharmaceutical packaging regulations. Amcor Plc has prioritized recyclable cold-form laminates and reportedly filed over 12 structural design patents since 2023.

Uflex Ltd. expanded its medical-grade lamination capacity by 22% in 2024, targeting EU- and USA-based CDMOs. Constantia Flexibles continues investing in Europe-based GMP-certified plants, while Tekni-Plex is enhancing foil-to-paper barrier combinations for dual-layer blister packs.

Recent moves reflect near-term cost and capacity recalibration. Tooling upgrades by Winpak Ltd. in Canada and the USA have reduced die-change downtime by 15%, while Huhtamaki Oyj has entered contract agreements with large generics producers in India for dedicated foil runs. Meanwhile, Essentra Plc and Bilcare Limited are aligning with serialization tech vendors to integrate smart-code features into cold-form structures.

Players integrating flexible foil capabilities with serialization infrastructure and recyclability compliance are expected to outpace laggards by capturing both regulatory and brand-driven pharma clients.

Leading Players

  • Amcor Plc
  • Uflex Ltd.
  • Constantia Flexibles
  • Winpak Ltd.
  • Tekni-Plex Inc.
  • Essentra Plc
  • Rollprint Packaging Products
  • Carcano Antonio S.p.A
  • Bilcare Limited
  • Huhtamaki Oyj

Report Scope

Attribute Details
Market Size 2025 USD 3.2 Billion
Market Size 2035 USD 5.7 Billion
CAGR (2025 to 2035) 6.1%
Base Year 2024
Historical Period 2020 to 2024
Forecast Period 2025 to 2035
Units Value (USD Billion)
Segments Covered Product Type, Technology, Application
Product Type Aluminum, Plastic Film, Others
Technology Thermoforming, Cold Forming
Application Food, Pharmaceuticals, Consumer Products, Industrial Goods, Others
Regions Covered North America, Latin America, Western Europe, Eastern Europe, East Asia, South Asia & Pacific, Middle East & Africa
Key Countries Profiled United States, United Kingdom, South Korea, Japan
Key Companies Amcor Plc, Uflex Ltd., Constantia Flexibles, Winpak Ltd., Tekni-Plex Inc., Essentra Plc, Rollprint Packaging Products, Carcano Antonio S.p.A, Bilcare Limited, Huhtamaki Oyj

Key Segments

By Product Type:

  • Aluminum
  • Plastic Film
  • Others

By Technology:

  • Thermoforming
  • Cold Forming

By Application:

  • Food
  • Pharmaceuticals
  • Consumer Products
  • Industrial Goods
  • Others

By Region:

  • North America
  • Latin America
  • East Asia
  • South Asia & Pacific
  • Eastern Europe
  • Western Europe
  • Middle East & Africa

Table of Content

  1. Executive Summary
    • Global Market Outlook
    • Demand-side Trends
    • Supply-side Trends
    • Technology Roadmap Analysis
    • Analysis and Recommendations
  2. Market Overview
    • Market Coverage/Taxonomy
    • Market Definition/Scope/Limitations
  3. Market Background
    • Market Dynamics
      • Drivers
      • Restraints
      • Opportunity
      • Trends
    • Scenario Forecast
      • Demand in Optimistic Scenario
      • Demand in Likely Scenario
      • Demand in Conservative Scenario
    • Opportunity Map Analysis
    • Product Life Cycle Analysis
    • Supply Chain Analysis
      • Supply Side Participants and their Roles
        • Producers
        • Mid-Level Participants (Traders/ Agents/ Brokers)
        • Wholesalers and Distributors
      • Value Added and Value Created at Node in the Supply Chain
      • List of Raw Material Suppliers
      • List of Existing and Potential Buyer’s
    • Investment Feasibility Matrix
    • Value Chain Analysis
      • Profit Margin Analysis
      • Wholesalers and Distributors
      • Retailers
    • PESTLE and Porter’s Analysis
    • Regulatory Landscape
      • By Key Regions
      • By Key Countries
    • Regional Parent Market Outlook
    • Production and Consumption Statistics
    • Import and Export Statistics
  4. Global Market Analysis 2020 to 2024 and Forecast, 2025 to 2035
    • Historical Market Size Value (USD Billion) & Volume (Metric Tons) Analysis, 2020 to 2024
    • Current and Future Market Size Value (USD Billion) & Volume (Metric Tons) Projections, 2025 to 2035
      • Y-o-Y Growth Trend Analysis
      • Absolute $ Opportunity Analysis
  5. Global Market Pricing Analysis 2020 to 2024 and Forecast 2025 to 2035
  6. Global Market Analysis 2020 to 2024 and Forecast 2025 to 2035, By Product Type
    • Introduction/Key Findings
    • Historical Market Size Value (USD Billion) & Volume (Metric Tons) Analysis By Product Type, 2020 to 2024
    • Current and Future Market Size Value (USD Billion) & Volume (Metric Tons) Analysis and Forecast By Product Type, 2025 to 2035
      • Aluminum
      • Plastic Film
  7. 6.3.2.4. Ask ChatGPT
      • Others
    • Y-o-Y Growth Trend Analysis By Product Type, 2020 to 2024
    • Absolute $ Opportunity Analysis By Product Type, 2025 to 2035
  8. Global Market Analysis 2020 to 2024 and Forecast 2025 to 2035, By Technology
    • Introduction/Key Findings
    • Historical Market Size Value (USD Billion) & Volume (Metric Tons) Analysis By Technology, 2020 to 2024
    • Current and Future Market Size Value (USD Billion) & Volume (Metric Tons) Analysis and Forecast By Technology, 2025 to 2035
      • Thermoforming
      • Cold Forming
    • Y-o-Y Growth Trend Analysis By Technology, 2020 to 2024
    • Absolute $ Opportunity Analysis By Technology, 2025 to 2035
  9. Global Market Analysis 2020 to 2024 and Forecast 2025 to 2035, By Application
    • Introduction/Key Findings
    • Historical Market Size Value (USD Billion) & Volume (Metric Tons) Analysis By Application, 2020 to 2024
    • Current and Future Market Size Value (USD Billion) & Volume (Metric Tons) Analysis and Forecast By Application, 2025 to 2035
      • Food
      • Pharmaceuticals
      • Consumer Products
      • Industrial Goods
      • Others
    • Y-o-Y Growth Trend Analysis By Application, 2020 to 2024
    • Absolute $ Opportunity Analysis By Application, 2025 to 2035
  10. Global Market Analysis 2020 to 2024 and Forecast 2025 to 2035, By Region
    • Introduction
    • Historical Market Size Value (USD Billion) & Volume (Metric Tons) Analysis By Region, 2020 to 2024
    • Current Market Size Value (USD Billion) & Volume (Metric Tons) Analysis and Forecast By Region, 2025 to 2035
      • North America
      • Latin America
      • Western Europe
      • Eastern Europe
      • East Asia
      • South Asia & Pacific
      • Middle East and Africa
    • Market Attractiveness Analysis By Region
  11. North America Market Analysis 2020 to 2024 and Forecast 2025 to 2035, By Country
    • Historical Market Size Value (USD Billion) & Volume (Metric Tons) Trend Analysis By Market Taxonomy, 2020 to 2024
    • Market Size Value (USD Billion) & Volume (Metric Tons) Forecast By Market Taxonomy, 2025 to 2035
      • By Country
        • USA
        • Canada
        • Mexico
      • By Product Type
      • By Technology
      • By Application
    • Market Attractiveness Analysis
      • By Country
      • By Product Type
      • By Technology
      • By Application
    • Key Takeaways
  12. Latin America Market Analysis 2020 to 2024 and Forecast 2025 to 2035, By Country
    • Historical Market Size Value (USD Billion) & Volume (Metric Tons) Trend Analysis By Market Taxonomy, 2020 to 2024
    • Market Size Value (USD Billion) & Volume (Metric Tons) Forecast By Market Taxonomy, 2025 to 2035
      • By Country
        • Brazil
        • Argentina
        • Rest of LATAM
      • By Product Type
      • By Technology
      • By Application
    • Market Attractiveness Analysis
      • By Country
      • By Product Type
      • By Technology
      • By Application
    • Key Takeaways
  13. Western Europe Market Analysis 2020 to 2024 and Forecast 2025 to 2035, By Country
    • Historical Market Size Value (USD Billion) & Volume (Metric Tons) Trend Analysis By Market Taxonomy, 2020 to 2024
    • Market Size Value (USD Billion) & Volume (Metric Tons) Forecast By Market Taxonomy, 2025 to 2035
      • By Country
        • Germany
        • Italy
        • France
        • UK
        • Spain
        • BENELUX
        • Nordic
        • Rest of W.Europe
      • By Product Type
      • By Technology
      • By Application
    • Market Attractiveness Analysis
      • By Country
      • By Product Type
      • By Technology
      • By Application
    • Key Takeaways
  14. Eastern Europe Market Analysis 2020 to 2024 and Forecast 2025 to 2035, By Country
    • Historical Market Size Value (USD Billion) & Volume (Metric Tons) Trend Analysis By Market Taxonomy, 2020 to 2024
    • Market Size Value (USD Billion) & Volume (Metric Tons) Forecast By Market Taxonomy, 2025 to 2035
      • By Country
        • Russia
        • Hungary
        • Poland
        • Balkan & Baltics
        • Rest of E. Europe
      • By Product Type
      • By Technology
      • By Application
    • Market Attractiveness Analysis
      • By Country
      • By Product Type
      • By Technology
      • By Application
    • Key Takeaways
  15. East Asia Market Analysis 2020 to 2024 and Forecast 2025 to 2035, By Country
    • Historical Market Size Value (USD Billion) & Volume (Metric Tons) Trend Analysis By Market Taxonomy, 2020 to 2024
    • Market Size Value (USD Billion) & Volume (Metric Tons) Forecast By Market Taxonomy, 2025 to 2035
      • By Country
        • China
        • Japan
        • South Korea
      • By Product Type
      • By Technology
      • By Application
    • Market Attractiveness Analysis
      • By Country
      • By Product Type
      • By Technology
      • By Application
    • Key Takeaways
  16. South Asia & Pacific Market Analysis 2020 to 2024 and Forecast 2025 to 2035, By Country
    • Historical Market Size Value (USD Billion) & Volume (Metric Tons) Trend Analysis By Market Taxonomy, 2020 to 2024
    • Market Size Value (USD Billion) & Volume (Metric Tons) Forecast By Market Taxonomy, 2025 to 2035
      • By Country
        • India
        • Australia & New Zealand
        • ASEAN
        • Rest of SAP
      • By Product Type
      • By Technology
      • By Application
    • Market Attractiveness Analysis
      • By Country
      • By Product Type
      • By Technology
      • By Application
    • Key Takeaways
  17. Middle East and Africa Market Analysis 2020 to 2024 and Forecast 2025 to 2035, By Country
    • Historical Market Size Value (USD Billion) & Volume (Metric Tons) Trend Analysis By Market Taxonomy, 2020 to 2024
    • Market Size Value (USD Billion) & Volume (Metric Tons) Forecast By Market Taxonomy, 2025 to 2035
      • By Country
        • GCC Countries
        • Northern Africa
        • South Africa
        • Turkiye
        • Rest of MEA
      • By Product Type
      • By Technology
      • By Application
    • Market Attractiveness Analysis
      • By Country
      • By Product Type
      • By Technology
      • By Application
    • Key Takeaways
  18. Key Countries Market Analysis
    • USA
      • Pricing Analysis
      • Market Share Analysis, 2024
        • By Product Type
        • By Technology
        • By Application
    • Canada
      • Pricing Analysis
      • Market Share Analysis, 2024
        • By Product Type
        • By Technology
        • By Application
    • Brazil
      • Pricing Analysis
      • Market Share Analysis, 2024
        • By Product Type
        • By Technology
        • By Application
    • Mexico
      • Pricing Analysis
      • Market Share Analysis, 2024
        • By Product Type
        • By Technology
        • By Application
    • Argentina
      • Pricing Analysis
      • Market Share Analysis, 2024
        • By Product Type
        • By Technology
        • By Application
  19. Market Structure Analysis
    • Competition Dashboard
    • Competition Benchmarking
    • Market Share Analysis of Top Players
      • By Regional
      • By Product Type
      • By Technology
      • By Application
  20. Competition Analysis
    • Competition Deep Dive
      • Amcor Plc
        • Overview
        • Product Portfolio
        • Profitability by Market Segments (Product/Age /Sales Channel/Region)
        • Sales Footprint
        • Strategy Overview
          • Marketing Strategy
          • Product Strategy
          • Channel Strategy
      • Uflex Ltd.
        • Overview
        • Product Portfolio
        • Profitability by Market Segments (Product/Age /Sales Channel/Region)
        • Sales Footprint
        • Strategy Overview
          • Marketing Strategy
          • Product Strategy
          • Channel Strategy
      • Constantia Flexibles
        • Overview
        • Product Portfolio
        • Profitability by Market Segments (Product/Age /Sales Channel/Region)
        • Sales Footprint
        • Strategy Overview
          • Marketing Strategy
          • Product Strategy
          • Channel Strategy
      • Winpak Ltd.
        • Overview
        • Product Portfolio
        • Profitability by Market Segments (Product/Age /Sales Channel/Region)
        • Sales Footprint
        • Strategy Overview
          • Marketing Strategy
          • Product Strategy
          • Channel Strategy
      • Tekni-Plex Inc.
        • Overview
        • Product Portfolio
        • Profitability by Market Segments (Product/Age /Sales Channel/Region)
        • Sales Footprint
        • Strategy Overview
          • Marketing Strategy
          • Product Strategy
          • Channel Strategy
      • Essentra Plc
        • Overview
        • Product Portfolio
        • Profitability by Market Segments (Product/Age /Sales Channel/Region)
        • Sales Footprint
        • Strategy Overview
          • Marketing Strategy
          • Product Strategy
          • Channel Strategy
      • Rollprint Packaging Products
        • Overview
        • Product Portfolio
        • Profitability by Market Segments (Product/Age /Sales Channel/Region)
        • Sales Footprint
        • Strategy Overview
          • Marketing Strategy
          • Product Strategy
          • Channel Strategy
      • Carcano Antonio S.p.A
        • Overview
        • Product Portfolio
        • Profitability by Market Segments (Product/Age /Sales Channel/Region)
        • Sales Footprint
        • Strategy Overview
          • Marketing Strategy
          • Product Strategy
          • Channel Strategy
      • Bilcare Limited
        • Overview
        • Product Portfolio
        • Profitability by Market Segments (Product/Age /Sales Channel/Region)
        • Sales Footprint
        • Strategy Overview
          • Marketing Strategy
          • Product Strategy
          • Channel Strategy
      • Huhtamaki Oyj
        • Overview
        • Product Portfolio
        • Profitability by Market Segments (Product/Age /Sales Channel/Region)
        • Sales Footprint
        • Strategy Overview
          • Marketing Strategy
          • Product Strategy
          • Channel Strategy
  21. Assumptions & Acronyms Used
  22. Research Methodology

List of Tables

  • Table 1: Global Market Value (USD Billion) Forecast by Region, 2020-2035
  • Table 2: Global Market Volume (Metric Tons) Forecast by Region, 2020-2035
  • Table 3: Global Market Value (USD Billion) Forecast by Product Type, 2020-2035
  • Table 4: Global Market Volume (Metric Tons) Forecast by Product Type, 2020-2035
  • Table 5: Global Market Value (USD Billion) Forecast by Technology, 2020-2035
  • Table 6: Global Market Volume (Metric Tons) Forecast by Technology, 2020-2035
  • Table 7: Global Market Value (USD Billion) Forecast by Application, 2020-2035
  • Table 8: Global Market Volume (Metric Tons) Forecast by Application, 2020-2035
  • Table 9: North America Market Value (USD Billion) Forecast by Country, 2020-2035
  • Table 10: North America Market Volume (Metric Tons) Forecast by Country, 2020-2035
  • Table 11: North America Market Value (USD Billion) Forecast by Product Type, 2020-2035
  • Table 12: North America Market Volume (Metric Tons) Forecast by Product Type, 2020-2035
  • Table 13: North America Market Value (USD Billion) Forecast by Technology, 2020-2035
  • Table 14: North America Market Volume (Metric Tons) Forecast by Technology, 2020-2035
  • Table 15: North America Market Value (USD Billion) Forecast by Application, 2020-2035
  • Table 16: North America Market Volume (Metric Tons) Forecast by Application, 2020-2035
  • Table 17: Latin America Market Value (USD Billion) Forecast by Country, 2020-2035
  • Table 18: Latin America Market Volume (Metric Tons) Forecast by Country, 2020-2035
  • Table 19: Latin America Market Value (USD Billion) Forecast by Product Type, 2020-2035
  • Table 20: Latin America Market Volume (Metric Tons) Forecast by Product Type, 2020-2035
  • Table 21: Latin America Market Value (USD Billion) Forecast by Technology, 2020-2035
  • Table 22: Latin America Market Volume (Metric Tons) Forecast by Technology, 2020-2035
  • Table 23: Latin America Market Value (USD Billion) Forecast by Application, 2020-2035
  • Table 24: Latin America Market Volume (Metric Tons) Forecast by Application, 2020-2035
  • Table 25: Western Europe Market Value (USD Billion) Forecast by Country, 2020-2035
  • Table 26: Western Europe Market Volume (Metric Tons) Forecast by Country, 2020-2035
  • Table 27: Western Europe Market Value (USD Billion) Forecast by Product Type, 2020-2035
  • Table 28: Western Europe Market Volume (Metric Tons) Forecast by Product Type, 2020-2035
  • Table 29: Western Europe Market Value (USD Billion) Forecast by Technology, 2020-2035
  • Table 30: Western Europe Market Volume (Metric Tons) Forecast by Technology, 2020-2035
  • Table 31: Western Europe Market Value (USD Billion) Forecast by Application, 2020-2035
  • Table 32: Western Europe Market Volume (Metric Tons) Forecast by Application, 2020-2035
  • Table 33: Eastern Europe Market Value (USD Billion) Forecast by Country, 2020-2035
  • Table 34: Eastern Europe Market Volume (Metric Tons) Forecast by Country, 2020-2035
  • Table 35: Eastern Europe Market Value (USD Billion) Forecast by Product Type, 2020-2035
  • Table 36: Eastern Europe Market Volume (Metric Tons) Forecast by Product Type, 2020-2035
  • Table 37: Eastern Europe Market Value (USD Billion) Forecast by Technology, 2020-2035
  • Table 38: Eastern Europe Market Volume (Metric Tons) Forecast by Technology, 2020-2035
  • Table 39: Eastern Europe Market Value (USD Billion) Forecast by Application, 2020-2035
  • Table 40: Eastern Europe Market Volume (Metric Tons) Forecast by Application, 2020-2035
  • Table 41: East Asia Market Value (USD Billion) Forecast by Country, 2020-2035
  • Table 42: East Asia Market Volume (Metric Tons) Forecast by Country, 2020-2035
  • Table 43: East Asia Market Value (USD Billion) Forecast by Product Type, 2020-2035
  • Table 44: East Asia Market Volume (Metric Tons) Forecast by Product Type, 2020-2035
  • Table 45: East Asia Market Value (USD Billion) Forecast by Technology, 2020-2035
  • Table 46: East Asia Market Volume (Metric Tons) Forecast by Technology, 2020-2035
  • Table 47: East Asia Market Value (USD Billion) Forecast by Application, 2020-2035
  • Table 48: East Asia Market Volume (Metric Tons) Forecast by Application, 2020-2035
  • Table 49: South Asia & Pacific Market Value (USD Billion) Forecast by Country, 2020-2035
  • Table 50: South Asia & Pacific Market Volume (Metric Tons) Forecast by Country, 2020-2035
  • Table 51: South Asia & Pacific Market Value (USD Billion) Forecast by Product Type, 2020-2035
  • Table 52: South Asia & Pacific Market Volume (Metric Tons) Forecast by Product Type, 2020-2035
  • Table 53: South Asia & Pacific Market Value (USD Billion) Forecast by Technology, 2020-2035
  • Table 54: South Asia & Pacific Market Volume (Metric Tons) Forecast by Technology, 2020-2035
  • Table 55: South Asia & Pacific Market Value (USD Billion) Forecast by Application, 2020-2035
  • Table 56: South Asia & Pacific Market Volume (Metric Tons) Forecast by Application, 2020-2035
  • Table 57: Middle East and Africa Market Value (USD Billion) Forecast by Country, 2020-2035
  • Table 58: Middle East and Africa Market Volume (Metric Tons) Forecast by Country, 2020-2035
  • Table 59: Middle East and Africa Market Value (USD Billion) Forecast by Product Type, 2020-2035
  • Table 60: Middle East and Africa Market Volume (Metric Tons) Forecast by Product Type, 2020-2035
  • Table 61: Middle East and Africa Market Value (USD Billion) Forecast by Technology, 2020-2035
  • Table 62: Middle East and Africa Market Volume (Metric Tons) Forecast by Technology, 2020-2035
  • Table 63: Middle East and Africa Market Value (USD Billion) Forecast by Application, 2020-2035
  • Table 64: Middle East and Africa Market Volume (Metric Tons) Forecast by Application, 2020-2035

List of Figures

  • Figure 1: Global Market Volume (Metric Tons) Forecast 2020-2035
  • Figure 2: Global Market Pricing Analysis
  • Figure 3: Global Market Value (USD Billion) Forecast 2020-2035
  • Figure 4: Global Market Value Share and BPS Analysis by Product Type, 2025 and 2035
  • Figure 5: Global Market Y-o-Y Growth Comparison by Product Type, 2025-2035
  • Figure 6: Global Market Attractiveness Analysis by Product Type
  • Figure 7: Global Market Value Share and BPS Analysis by Technology, 2025 and 2035
  • Figure 8: Global Market Y-o-Y Growth Comparison by Technology, 2025-2035
  • Figure 9: Global Market Attractiveness Analysis by Technology
  • Figure 10: Global Market Value Share and BPS Analysis by Application, 2025 and 2035
  • Figure 11: Global Market Y-o-Y Growth Comparison by Application, 2025-2035
  • Figure 12: Global Market Attractiveness Analysis by Application
  • Figure 13: Global Market Value (USD Billion) Share and BPS Analysis by Region, 2025 and 2035
  • Figure 14: Global Market Y-o-Y Growth Comparison by Region, 2025-2035
  • Figure 15: Global Market Attractiveness Analysis by Region
  • Figure 16: North America Market Incremental $ Opportunity, 2025-2035
  • Figure 17: Latin America Market Incremental $ Opportunity, 2025-2035
  • Figure 18: Western Europe Market Incremental $ Opportunity, 2025-2035
  • Figure 19: Eastern Europe Market Incremental $ Opportunity, 2025-2035
  • Figure 20: East Asia Market Incremental $ Opportunity, 2025-2035
  • Figure 21: South Asia & Pacific Market Incremental $ Opportunity, 2025-2035
  • Figure 22: Middle East and Africa Market Incremental $ Opportunity, 2025-2035
  • Figure 23: North America Market Value Share and BPS Analysis by Country, 2025 and 2035
  • Figure 24: North America Market Value Share and BPS Analysis by Product Type, 2025 and 2035
  • Figure 25: North America Market Y-o-Y Growth Comparison by Product Type, 2025-2035
  • Figure 26: North America Market Attractiveness Analysis by Product Type
  • Figure 27: North America Market Value Share and BPS Analysis by Technology, 2025 and 2035
  • Figure 28: North America Market Y-o-Y Growth Comparison by Technology, 2025-2035
  • Figure 29: North America Market Attractiveness Analysis by Technology
  • Figure 30: North America Market Value Share and BPS Analysis by Application, 2025 and 2035
  • Figure 31: North America Market Y-o-Y Growth Comparison by Application, 2025-2035
  • Figure 32: North America Market Attractiveness Analysis by Application
  • Figure 33: Latin America Market Value Share and BPS Analysis by Country, 2025 and 2035
  • Figure 34: Latin America Market Value Share and BPS Analysis by Product Type, 2025 and 2035
  • Figure 35: Latin America Market Y-o-Y Growth Comparison by Product Type, 2025-2035
  • Figure 36: Latin America Market Attractiveness Analysis by Product Type
  • Figure 37: Latin America Market Value Share and BPS Analysis by Technology, 2025 and 2035
  • Figure 38: Latin America Market Y-o-Y Growth Comparison by Technology, 2025-2035
  • Figure 39: Latin America Market Attractiveness Analysis by Technology
  • Figure 40: Latin America Market Value Share and BPS Analysis by Application, 2025 and 2035
  • Figure 41: Latin America Market Y-o-Y Growth Comparison by Application, 2025-2035
  • Figure 42: Latin America Market Attractiveness Analysis by Application
  • Figure 43: Western Europe Market Value Share and BPS Analysis by Country, 2025 and 2035
  • Figure 44: Western Europe Market Value Share and BPS Analysis by Product Type, 2025 and 2035
  • Figure 45: Western Europe Market Y-o-Y Growth Comparison by Product Type, 2025-2035
  • Figure 46: Western Europe Market Attractiveness Analysis by Product Type
  • Figure 47: Western Europe Market Value Share and BPS Analysis by Technology, 2025 and 2035
  • Figure 48: Western Europe Market Y-o-Y Growth Comparison by Technology, 2025-2035
  • Figure 49: Western Europe Market Attractiveness Analysis by Technology
  • Figure 50: Western Europe Market Value Share and BPS Analysis by Application, 2025 and 2035
  • Figure 51: Western Europe Market Y-o-Y Growth Comparison by Application, 2025-2035
  • Figure 52: Western Europe Market Attractiveness Analysis by Application
  • Figure 53: Eastern Europe Market Value Share and BPS Analysis by Country, 2025 and 2035
  • Figure 54: Eastern Europe Market Value Share and BPS Analysis by Product Type, 2025 and 2035
  • Figure 55: Eastern Europe Market Y-o-Y Growth Comparison by Product Type, 2025-2035
  • Figure 56: Eastern Europe Market Attractiveness Analysis by Product Type
  • Figure 57: Eastern Europe Market Value Share and BPS Analysis by Technology, 2025 and 2035
  • Figure 58: Eastern Europe Market Y-o-Y Growth Comparison by Technology, 2025-2035
  • Figure 59: Eastern Europe Market Attractiveness Analysis by Technology
  • Figure 60: Eastern Europe Market Value Share and BPS Analysis by Application, 2025 and 2035
  • Figure 61: Eastern Europe Market Y-o-Y Growth Comparison by Application, 2025-2035
  • Figure 62: Eastern Europe Market Attractiveness Analysis by Application
  • Figure 63: East Asia Market Value Share and BPS Analysis by Country, 2025 and 2035
  • Figure 64: East Asia Market Value Share and BPS Analysis by Product Type, 2025 and 2035
  • Figure 65: East Asia Market Y-o-Y Growth Comparison by Product Type, 2025-2035
  • Figure 66: East Asia Market Attractiveness Analysis by Product Type
  • Figure 67: East Asia Market Value Share and BPS Analysis by Technology, 2025 and 2035
  • Figure 68: East Asia Market Y-o-Y Growth Comparison by Technology, 2025-2035
  • Figure 69: East Asia Market Attractiveness Analysis by Technology
  • Figure 70: East Asia Market Value Share and BPS Analysis by Application, 2025 and 2035
  • Figure 71: East Asia Market Y-o-Y Growth Comparison by Application, 2025-2035
  • Figure 72: East Asia Market Attractiveness Analysis by Application
  • Figure 73: South Asia & Pacific Market Value Share and BPS Analysis by Country, 2025 and 2035
  • Figure 74: South Asia & Pacific Market Value Share and BPS Analysis by Product Type, 2025 and 2035
  • Figure 75: South Asia & Pacific Market Y-o-Y Growth Comparison by Product Type, 2025-2035
  • Figure 76: South Asia & Pacific Market Attractiveness Analysis by Product Type
  • Figure 77: South Asia & Pacific Market Value Share and BPS Analysis by Technology, 2025 and 2035
  • Figure 78: South Asia & Pacific Market Y-o-Y Growth Comparison by Technology, 2025-2035
  • Figure 79: South Asia & Pacific Market Attractiveness Analysis by Technology
  • Figure 80: South Asia & Pacific Market Value Share and BPS Analysis by Application, 2025 and 2035
  • Figure 81: South Asia & Pacific Market Y-o-Y Growth Comparison by Application, 2025-2035
  • Figure 82: South Asia & Pacific Market Attractiveness Analysis by Application
  • Figure 83: Middle East and Africa Market Value Share and BPS Analysis by Country, 2025 and 2035
  • Figure 84: Middle East and Africa Market Value Share and BPS Analysis by Product Type, 2025 and 2035
  • Figure 85: Middle East and Africa Market Y-o-Y Growth Comparison by Product Type, 2025-2035
  • Figure 86: Middle East and Africa Market Attractiveness Analysis by Product Type
  • Figure 87: Middle East and Africa Market Value Share and BPS Analysis by Technology, 2025 and 2035
  • Figure 88: Middle East and Africa Market Y-o-Y Growth Comparison by Technology, 2025-2035
  • Figure 89: Middle East and Africa Market Attractiveness Analysis by Technology
  • Figure 90: Middle East and Africa Market Value Share and BPS Analysis by Application, 2025 and 2035
  • Figure 91: Middle East and Africa Market Y-o-Y Growth Comparison by Application, 2025-2035
  • Figure 92: Middle East and Africa Market Attractiveness Analysis by Application
  • Figure 93: Global Market - Tier Structure Analysis
  • Figure 94: Global Market - Company Share Analysis

Frequently Asked Questions

How big is the cold form foil market in 2025?

The cold form foil market is estimated at USD 3.2 billion in 2025.

What is the projected size of the cold form foil market by 2035?

It is expected to reach USD 5.7 billion by 2035.

What is the CAGR for the cold form foil market from 2025 to 2035?

The market is projected to grow at a 6.1% CAGR during the forecast period.

Which product type holds the largest share in cold form foil market in 2025?

Aluminum, with a 64% share of the market leads product type segment.

What is the dominant application segment by end use?

Pharmaceuticals, accounting for 58% of market demand in 2025.

Who are the key players in the market?

Top players include Amcor Plc, Uflex Ltd., Constantia Flexibles, and Winpak Ltd., among others.

Which country is the most lucrative market?

The United States, with a CAGR of 6.8% between 2025 and 2035.

Explore Similar Insights

Future Market Insights

Cold Form Foil market