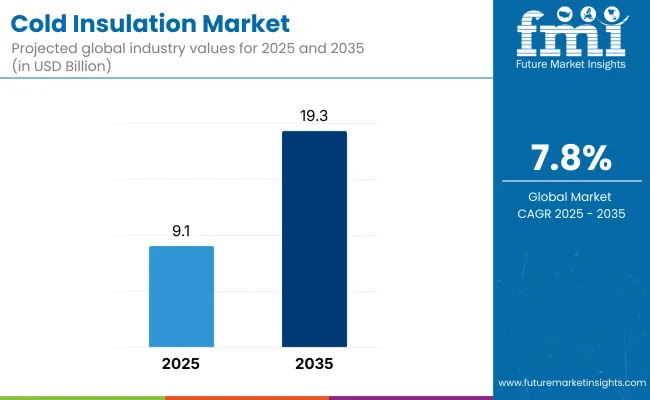
The global cold insulation market is anticipated to reach USD 9.1 billion in 2025 and is projected to expand at a CAGR of 7.8%, attaining a value of USD 19.3 billion by 2035. Rising demand from industrial refrigeration, LNG transport, and temperature-controlled infrastructure continues to support market growth.
Quick Stats for the Cold Insulation Market

| Attributes | Key Insights |
|---|---|
| Market Value, 2025 | USD 9.1 billion |
| Market Value, 2035 | USD 19.3 billion |
| Value CAGR (2025 to 2035) | 7.8% |
Cold insulation refers to specialized materials designed to prevent heat transfer in systems operating at low temperatures. These materials are essential for maintaining thermal stability, improving energy efficiency, and minimizing condensation or freezing in applications such as refrigeration, HVAC systems, and cryogenics. End-use sectors such as oil and gas, food processing, and pharmaceuticals rely heavily on these systems to ensure operational continuity and regulatory compliance.
Common materials used include fiberglass, mineral wool, polyurethane (PU) foam, and elastomeric foam. Fiberglass remains popular for its durability and cost-effectiveness, while mineral wool provides high fire resistance. Polyurethane foam delivers excellent thermal insulation properties, and elastomeric foam offers flexibility and resistance to moisture, making it suitable for complex piping and confined spaces.
Advanced material innovation is reshaping cold insulation performance. Manufacturers are introducing solutions such as vacuum-insulated panels (VIPs), aerogel blankets, and enhanced foam composites. These technologies improve thermal resistance while reducing thickness and bulk, supporting compact design requirements in HVAC and industrial refrigeration systems. Additional developments in anti-condensation coatings and moisture barriers are further enhancing the reliability and lifespan of insulation systems.
Cryogenic applications represent a key growth area, particularly in liquefied natural gas (LNG) storage and transport. At temperatures below –150°C, effective insulation is critical to maintaining cryogenic integrity, preventing frost formation, and minimizing boil-off losses. Materials such as PU foam, expanded polystyrene (EPS), and fiberglass are widely deployed in cryogenic pipelines and tanks to reduce heat ingress and ensure safe handling.
In industrial settings, cold insulation is applied to compressors, chillers, and process pipelines to prevent thermal gain, avoid condensation-related corrosion, and improve operational efficiency. These installations are particularly vital in petrochemical plants, dairy and food processing units, and pharmaceutical manufacturing, where precise temperature control and energy conservation are operational imperatives.

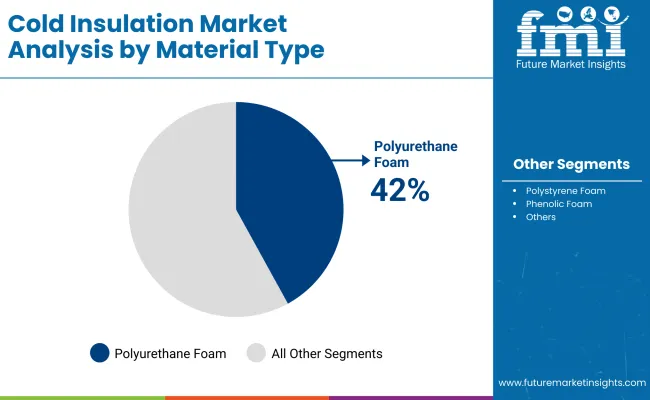
Polyurethane foam is estimated to dominate the cold insulation material market in 2025, accounting for nearly 42% of total consumption and expanding at a CAGR of 8.1% through 2035. Its widespread adoption is being driven by superior thermal resistance, moisture control, and structural stability across refrigeration, cryogenic, and HVAC systems.
It is widely integrated into pipelines, storage tanks, and insulation panels used in LNG terminals and food-grade cold chain logistics. Growth is also supported by green building regulations and industrial retrofitting initiatives in Europe and North America. The incorporation of low-global-warming blowing agents and compatibility with varying climatic conditions have reinforced polyurethane foam's utility in temperature-critical applications, especially in pharmaceuticals and industrial manufacturing.

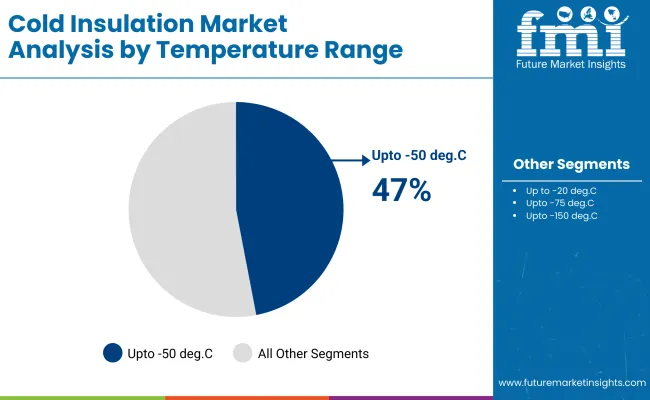
Cold insulation systems rated for up to -150°C are estimated to represent 47% share in 2025 and grow at a CAGR of 7.9% through 2035. The segment’s expansion is supported by increasing deployment in LNG storage, aerospace systems, and biopharma logistics where precise sub-zero containment is essential. Materials such as polyurethane foam and polyisocyanurate foam are preferred for their consistent thermal barrier performance, ease of installation, and compliance with cryogenic safety standards.
Demand is further rising from next-generation cold storage units and gas liquefaction plants, where thermal efficiency directly impacts energy costs and regulatory compliance. Multilayer configurations and prefabricated systems tailored for this temperature band are also gaining traction across industrial retrofit and greenfield projects.
The table below presents the annual growth rates of the global cold insulation market from 2025 to 2035. With a base year of 2024 extending to 2025, the report explores how the market's growth trajectory develops from the first half of the year (January to June, H1) to the second half (July to December, H2).
This analysis offers stakeholders a comprehensive view of the industry’s performance, focusing on key developments and shifts that may shape the market moving forward. The market is expected to grow at a CAGR of 7.8% from 2025 to 2035. In H2, the growth rate is anticipated to increase slightly.
| Particular | Value CAGR |
|---|---|
| H1 2024 | 7.5% (2024 to 2034) |
| H2 2024 | 7.7% (2024 to 2034) |
| H1 2025 | 7.8% (2025 to 2035) |
| H2 2025 | 8.0% (2025 to 2035) |
From H1 2025 to H2 2025, the CAGR is expected to show a modest increase, moving from 7.8% in the first half to 8.0% in the second half. In H1, the sector is expected to see an increase of 30 BPS, with a further 30 BPS rise in the second half. This semi-annual update highlights the cold insulation market's growth potential, driven by demand for energy-efficient solutions, technological advancements, and rising adoption across industries such as oil, gas, and construction.
Growing Refrigeration Demand Fuel the Cold Insulation Market
The growing demand for refrigeration, particularly in the food and beverage sector, is a significant driver of the cold insulation market. As global food distribution networks expand, the need for effective cold storage and transportation has become essential to ensure the preservation of products and prevent spoilage. Cold insulation materials, such as polyurethane foam and elastomeric foam, help maintain desired temperatures by preventing heat gain, thereby reducing energy consumption.
The refrigeration industry is evolving with advancements in insulation technologies that enhance energy efficiency and reduce operational costs. These innovations in insulation materials enable refrigerated systems to function more effectively, even in challenging environments. With rising demand for refrigerated transportation and storage across both developed and emerging markets, the cold insulation market is poised to grow, driven by the increasing need for energy-efficient solutions to meet the growing demands of the global food supply chain.
Rising Demand for Cold Insulation in Cryogenic Applications Drives Market Growth
The rise in liquefied natural gas (LNG) production and transportation has significantly increased the demand for cold insulation materials. As LNG production is projected to reach over 500 million tonnes per year by 2030, the need for efficient cold insulation in cryogenic tanks and pipelines becomes critical. LNG, which is stored and transported at temperatures as low as -162°C, requires insulation materials that can effectively minimize heat gain and maintain the necessary low temperatures during transit and storage.
High-performance cold insulation materials like polyurethane foam, expanded perlite, and vacuum-insulated panels (VIPs) are essential for ensuring the energy efficiency of these operations. These materials not only prevent energy loss but also safeguard against potential safety hazards, such as pressure build-up in LNG systems. With continued growth in the LNG sector, especially in emerging markets, the demand for specialized cold insulation solutions is expected to accelerate.
Growth in Oil & Gas Exploration Boost the Cold Insulation Market
The growth in oil and gas exploration, especially in deep-sea and Arctic regions, is driving the increasing demand for advanced cold insulation materials. With global oil production from deepwater fields projected to account for more than 30% of total offshore oil output by 2030, this shift to harsher environments calls for effective insulation to protect pipelines and storage tanks. In these regions, temperatures can plummet as low as -50°C, making high-performance insulation essential for preventing freezing and ensuring the smooth transportation of hydrocarbons.
Cold insulation materials, such as fiberglass, mineral wool, and polyurethane foam, play a critical role in maintaining the integrity of pipelines and storage tanks under these extreme conditions. These materials help reduce heat gain, minimize energy consumption, and enhance safety by preventing the formation of ice or corrosion, which could otherwise compromise the operation.
The Arctic, in particular, already supplies about 10% of the world's oil and 25% of its natural gas, mainly from onshore sources. It is also estimated to hold 22% of the Earth's undiscovered oil and natural gas reserves. As exploration in these challenging environments intensifies, the demand for reliable and effective cold insulation solutions will continue to rise.
Expanding Demand for Pharmaceutical Cold Chain Drives Need for Enhanced Cold Insulation
The growing demand for pharmaceuticals, particularly temperature-sensitive products like vaccines, biologics, and insulin, has significantly boosted the need for an efficient cold chain system. Cold insulation plays a crucial role in maintaining the required temperature range during storage and transport, preventing spoilage and ensuring product efficacy. With the expansion of the global pharmaceutical market and increased reliance on these temperature-sensitive medications, the need for robust and reliable insulation solutions is becoming more pressing.
Advanced cold insulation materials, such as vacuum insulated panels and polyurethane foams, are now being developed to meet these stringent requirements. Additionally, regulatory frameworks and industry standards for the transportation of pharmaceuticals are becoming stricter, further emphasizing the importance of cold chain integrity. This shift highlights the growing investment in cutting-edge insulation technologies to support the pharmaceutical industry’s cold chain needs, ensuring safe, efficient, and compliant delivery of vital medicines.
Tier-1 companies account for around 30-40% of the overall market with a product revenue from the cold insulation market of more than USD 220 million. The Dow Chemical Company, Huntsman Corporation, Armacell International Holding GMBH, and other players.
Tier-2 and other companies such as Aspen Aerogels Inc., Arabian Fiberglass Insulation Company Ltd. and other players are projected to account for 60-70% of the overall market with the estimated revenue under the range of USD 220 million through the sales of cold insulation.
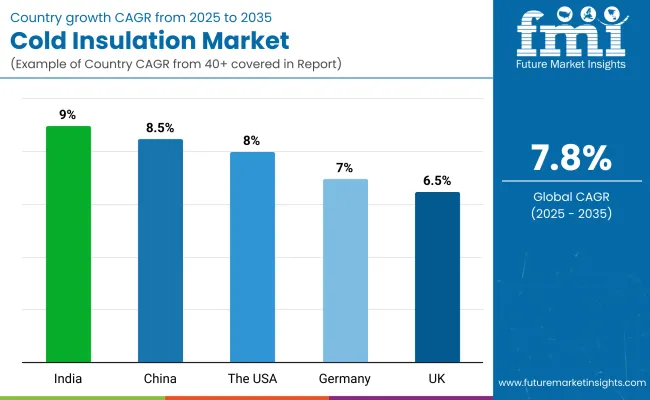
The section below covers the industry analysis for cold insulation in different countries. The demand analysis on key countries in several regions of the globe, including North America, Latin America, East Asia, South Asia Pacific, Western Europe, Eastern Europe, Middle East and Africa is provided. This data helps investors to keenly observe and go through the recent trends and examine them in an ordered manner.

| Countries | Value CAGR (2025 to 2035) |
|---|---|
| The USA | 8.0% |
| Germany | 7.0% |
| China | 8.5% |
| UK | 6.5% |
| India | 9.0% |
The demand for cold storage and logistics has surged, largely driven by the growing pharmaceutical and food industries. With the increasing need to store temperature-sensitive products like vaccines, biologics, and perishable foods, the reliance on efficient cold insulation solutions has become essential. Cold insulation helps maintain the required temperature during storage and transportation, preventing spoilage and ensuring product integrity.
As the pharmaceutical sector expands, particularly with the rise in vaccine production and distribution, the need for advanced insulation materials to protect sensitive goods from temperature fluctuations has intensified. Additionally, the food industry, including online grocery and meal delivery services, requires reliable cold storage solutions to meet consumer demand for fresh products. This increasing demand for cold storage infrastructure in the USA has driven the growth of the cold insulation market, as businesses seek innovative solutions to maintain optimal conditions and comply with regulations.
The growing demand for Liquefied Natural Gas (LNG) transportation in Germany is significantly driving the need for advanced cold insulation solutions. LNG must be transported and stored at extremely low temperatures of around -162°C to remain in its liquid form. This requires highly efficient insulation materials to minimize heat gain, prevent vaporization, and ensure safe and cost-effective transportation. As Germany continues to expand its LNG import and export infrastructure to reduce reliance on traditional energy sources, the demand for cold insulation in LNG terminals, pipelines, and shipping vessels is on the rise.
Additionally, with the Germany focus on energy transition and cleaner fuel alternatives, the adoption of LNG as a preferred energy source is further fueling this demand. Cold insulation materials are essential for ensuring LNG's stability and efficiency during transportation, making them crucial for the growing LNG sector in Germany.
The rising demand for refrigerated warehousing in China is significantly driving the need for cold insulation solutions. As urbanization and disposable incomes increase, the demand for perishable goods, including fresh produce, dairy, and pharmaceuticals, is growing rapidly. This has led to an expansion of refrigerated storage facilities to ensure product freshness and compliance with health regulations. Cold insulation plays a crucial role in maintaining the required low temperatures within these warehouses, minimizing energy consumption, and reducing operational costs.
As China’s food industry and e-commerce platforms expand, efficient cold storage is essential for maintaining product quality during transport and storage. Additionally, government initiatives promoting food safety and waste reduction are further driving investments in refrigerated warehousing, creating a continued demand for high-performance cold insulation materials to support this growth.
Technological advancements in the cold insulation market are improving performance, efficiency, and sustainability. The growing use of materials like vacuum-insulated panels (VIPs) and high-performance polyurethanes is driven by the demand for energy-efficient systems. Innovations in aerogel-based insulation and reflective coatings are enhancing thermal resistance while reducing thickness.
Eco-friendly materials such as bio-based foams and low-GWP refrigerants are increasing in response to environmental regulations. The shift towards automated manufacturing and prefabricated systems is streamlining installation, reducing labor costs, and improving efficiency. These developments strengthen cold insulation’s role in energy conservation, sustainability, and cost reduction across various industries.
The cold insulation was valued at USD 8,474.9 million in 2024.
The demand for cold insulation is set to reach USD 9,135.9 million in 2025.
The cold insulation is driven by growing energy efficiency regulations, increasing use of cold storage in food and pharmaceuticals, rising HVAC adoption, and technological advancements in insulation materials.
The cold insulation demand is projected to reach USD 19,361.7 million in 2035.
The polyurethane foam are expected to lead during the forecasted period due to its superior thermal performance, lightweight nature, moisture resistance, versatility in application, and cost-effectiveness, making it ideal for various industries.


Full Research Suite comprises of:
Market outlook & trends analysis
Interviews & case studies
Strategic recommendations
Vendor profiles & capabilities analysis
5-year forecasts
8 regions and 60+ country-level data splits
Market segment data splits
12 months of continuous data updates
DELIVERED AS:
PDF EXCEL ONLINE
Cold Insulation Materials Market Size and Share Forecast Outlook 2025 to 2035
Cold Chain Logistics Transport Insulated Truck Market Size and Share Forecast Outlook 2025 to 2035
Cold Forging Machine Market Size and Share Forecast Outlook 2025 to 2035
Cold-Pressed Oil Market Size and Share Forecast Outlook 2025 to 2035
Cold Chain Packaging Market Size and Share Forecast Outlook 2025 to 2035
Cold Plates Market Size and Share Forecast Outlook 2025 to 2035
Cold-Chain Sensor Encapsulators Market Analysis - Size and Share Forecast Outlook 2025 to 2035
Cold-Pressed Fruit Extracts Market Size and Share Forecast Outlook 2025 to 2035
Cold Heading Wire Market Size and Share Forecast Outlook 2025 to 2035
Cold Water Swelling Starch Market Analysis - Size, Share, and Forecast Outlook 2025 to 2035
Cold Chain Monitoring Market Size and Share Forecast Outlook 2025 to 2035
Cold Finished Iron and Steel Bars and Bar Size Shapes Market Size and Share Forecast Outlook 2025 to 2035
Cold Storage Equipment Market Size and Share Forecast Outlook 2025 to 2035
Cold Laser Therapy Market Analysis - Size, Share & Forecast 2025 to 2035
Cold Mix Asphalt Market Size and Share Forecast Outlook 2025 to 2035
Cold Cuts Market Analysis - Size, Share, and Forecast 2025 to 2035
Cold Seal Paper Market Size and Share Forecast Outlook 2025 to 2035
Cold Pain Therapy Market Size and Share Forecast Outlook 2025 to 2035
Cold Chain Equipment Market Size and Share Forecast Outlook 2025 to 2035
Cold Chain Logistics Market Size and Share Forecast Outlook 2025 to 2035

Thank you!
You will receive an email from our Business Development Manager. Please be sure to check your SPAM/JUNK folder too.
Chat With
MaRIA