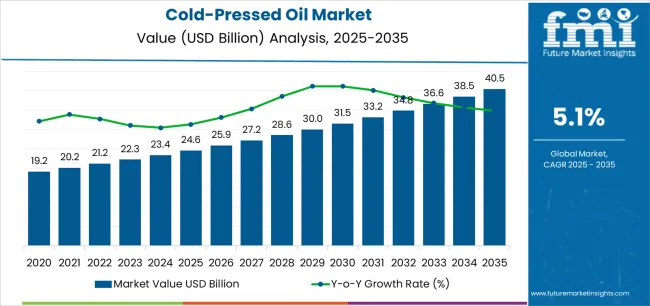
The cold-pressed oil market stands at the threshold of a decade-long expansion trajectory that promises to reshape the natural oil extraction industry and health-conscious consumer product solutions. According to FMI’s report series on packaging circularity and compliance under EU and US regulatory frameworks, the market's journey from USD 24.6 billion in 2025 to USD 40.5 billion by 2035 represents substantial growth, demonstrating the accelerating adoption of chemical-free extraction technology and nutritional preservation across food manufacturing facilities, cosmetic operations, and wellness sectors.
The first half of the decade (2025-2030) will witness the market climbing from USD 24.6 billion to approximately USD 31.7 billion, adding USD 7.1 billion in value, which constitutes 46% of the total forecast growth period. This phase will be characterized by the rapid adoption of cold-pressing systems, driven by increasing consumer demand for natural products and the growing need for nutrient-rich oil solutions worldwide. Enhanced extraction capabilities and automated quality systems will become standard expectations rather than premium options.
The latter half (2030-2035) will witness continued growth from USD 31.7 billion to USD 40.5 billion, representing an addition of USD 8.8 billion or 54% of the decade's expansion. This period will be defined by mass market penetration of organic cold-pressed technologies, integration with comprehensive traceability platforms, and seamless compatibility with existing food processing infrastructure. The market trajectory signals fundamental shifts in how food facilities approach oil extraction and quality management, with participants positioned to benefit from growing demand across multiple oil types and application segments.
A major driver of expansion is the rising focus on preventive health and nutrition. Consumers across North America, Europe, Asia-Pacific, and emerging markets are increasingly choosing cold-pressed oils for home cooking, dietary supplementation, and everyday wellness routines. These oils are recognized for their higher retention of micronutrients, better fatty acid profile, and rich sensory attributes, making them preferred for salads, baking, sautéing, and functional food applications. As demand grows for unrefined, additive-free oils, retail channels, including supermarkets, health stores, and e-commerce platforms, are expanding their cold-pressed product assortments.
Supply chain diversification and technological improvements are expanding production capabilities. Modern cold-pressing machinery, improved filtration systems, and controlled extraction environments allow manufacturers to produce high-purity oils with consistent quality. Greater availability of raw materials, supported by improved oilseed cultivation, also contributes to stable supply and expanding distribution networks.
Growing culinary experimentation, rising disposable incomes, and the premiumization of edible oils reinforce long-term adoption. Regional trends show strong growth in Asia-Pacific due to expanding middle-class consumption, while the US and Europe remain key markets for premium health oils. E-commerce growth plays an important role, providing wider access to niche, artisanal, and region-specific cold-pressed oils.
| Period | Revenue Bucket | Share (%) | Notes |
|---|---|---|---|
| Today | Bulk oil sales | 40% | Volume-led, commodity grade, pricing-driven |
| Food industry applications | 38% | Margin compression, specification-driven | |
| Personal care & cosmetics | 15% | Premium positioning, natural formulations | |
| Retail branded products | 7% | Convenience formats, direct-to-consumer | |
| Future (3-5 yrs) | Specialty oil blends | 25-30% | Functional formulations, targeted nutrition |
| Organic & certified products | 20-25% | Sustainability premiums, full traceability | |
| Direct-to-consumer channels | 15-20% | E-commerce growth, subscription models | |
| Pharmaceutical grade | 15-20% | Medical applications, therapeutic uses | |
| Cosmeceutical applications | 10-15% | Anti-aging, skin health, premium beauty | |
| Sustainability services | 5-10% | Carbon tracking, zero-waste processing |
| Metric | Value |
|---|---|
| Market Value (2025) | USD 24.6 billion |
| Market Forecast (2035) | USD 40.5 billion |
| Growth Rate (2025 to 2035) | 5.1% CAGR |
| Leading Technology | Cold-Pressing Extraction |
| Primary Application | Food Industry Manufacturing |
The market demonstrates strong fundamentals with food industry applications capturing a dominant 38% share through advanced nutritional preservation and flavor retention. Peanut oil leads the oil type segment with 28% share, while B2C distribution channels command 83% of market sales. Geographic expansion remains concentrated in Asia Pacific with India showing exceptional 6.6% growth, while mature markets like Germany exhibit slower 2.8% expansion rates driven by market saturation and established consumption patterns.
Primary Classification: The market segments by category into food industry, cosmetics & personal care, pharmaceuticals, and others, representing the evolution from traditional oil extraction to specialized cold-pressing solutions for comprehensive wellness and nutrition optimization.
Secondary Classification: Oil type segmentation divides the market into peanut, coconut, olive, sunflower, rapeseed, sesame, and other oils, reflecting distinct nutritional profiles, flavor characteristics, and application requirements.
Tertiary Classification: Distribution channels include B2C and B2B segments, while nature classification spans conventional and organic categories.
Quaternary Classification: Packaging formats include bottles, pouches, cans, and bulk containers, while end-use applications span cooking, skincare, aromatherapy, and medicinal uses.
Regional Classification: Geographic distribution covers North America, Latin America, Western Europe, Eastern Europe, East Asia, South Asia Pacific, and Middle East & Africa, with developing markets leading adoption while established economies show steady growth patterns driven by premiumization trends.
The segmentation structure reveals technology progression from standard oil production toward specialized cold-pressing systems with enhanced nutrient preservation and quality control capabilities, while application diversity spans from culinary uses to pharmaceutical formulations requiring precise purity standards.
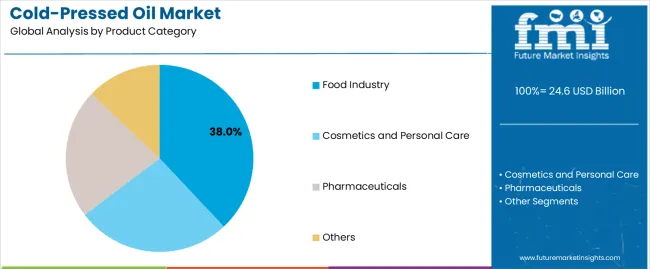
Market Position: Food industry applications command the leading position with 38% market share (USD 9.3 billion in 2025) through superior nutritional retention, flavor authenticity, and health benefit optimization that enable food manufacturers to achieve premium product positioning across diverse culinary and nutritional environments.
Value Drivers: The segment benefits from consumer preference for natural extraction methods that provide maximum nutrient retention, authentic flavor profiles, and health optimization without chemical processing or high-temperature degradation. Advanced cold-pressing features enable consistent quality control, oxidative stability, and integration with clean-label manufacturing requirements, where nutritional integrity and transparency represent critical consumer expectations.
Competitive Advantages: Food industry cold-pressed systems differentiate through proven health benefits, superior organoleptic properties, and alignment with wellness trends that enhance brand value while maintaining optimal quality standards suitable for premium food applications.
Key market characteristics:
Cosmetics and personal care applications maintain significant market position due to their premium pricing potential and growing consumer preference for natural beauty products. These segments appeal to manufacturers requiring chemical-free ingredients with proven skin benefit properties for natural cosmetic formulations. Market growth is driven by clean beauty trends, emphasizing pure extraction methods and ingredient transparency through cold-pressing technology.
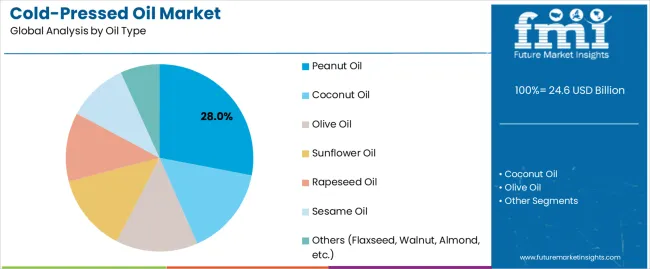
Market Context: Peanut oil dominates with 28% share (USD 6.9 billion in 2025) due to widespread culinary adoption and versatile application properties, particularly strong in Asian markets where traditional cooking preferences drive consumption patterns.
Appeal Factors: Peanut oil operators prioritize high smoke point characteristics, neutral flavor profiles, and nutritional benefits that enable diverse culinary applications across multiple cuisine types. The segment benefits from established agricultural supply chains and processing infrastructure that emphasize cold-pressed extraction for premium market positioning.
Growth Drivers: Culinary diversification programs incorporate cold-pressed peanut oil as premium ingredients for health-conscious cooking, while expanding Asian cuisine popularity increases global demand for authentic oil products that maintain traditional flavor profiles.
Market Challenges: Allergen concerns and regional preference variations may limit market penetration in certain geographic segments.
Application dynamics include:
Coconut and olive oil applications capture growing market share through distinct health positioning and functional benefits, particularly in Mediterranean diet adoption and tropical wellness trends. These markets demand cold-pressed systems capable of preserving unique nutritional compounds while providing authentic flavor characteristics and proven health benefits.
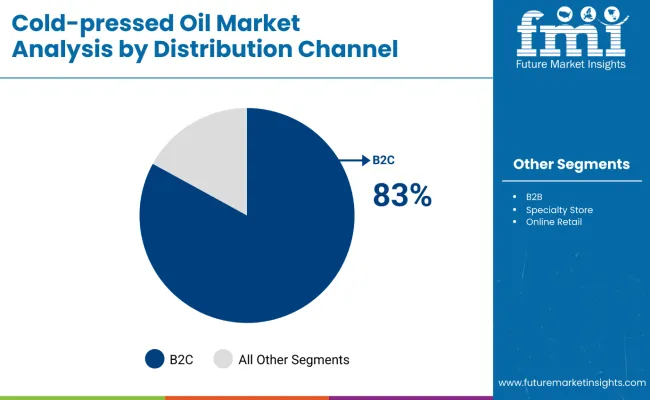
Market Position: B2C channels lead the market with 83% share, representing the dominant distribution segment due to direct consumer purchasing and brand engagement opportunities across retail and e-commerce platforms.
Growth Drivers: E-commerce expansion, subscription model adoption, and direct-to-consumer brand strategies drive B2C channel growth across digital and physical retail environments.
Channel Scope: B2C distribution spans supermarkets, specialty stores, online marketplaces, and brand websites requiring diverse packaging formats and consumer education features.
| Category | Factor | Impact | Why It Matters |
|---|---|---|---|
| Driver | Health & wellness consciousness | ★★★★★ | Natural extraction preserves nutrients, shifting oils from “cooking medium” to “health supplement” and enabling premium positioning. |
| Driver | Clean label movement | ★★★★★ | Chemical-free processing aligns with transparency demands across food and cosmetic applications. |
| Driver | Premiumization trend | ★★★★☆ | Artisanal production methods command price premiums, reducing commodity pressure on processors. |
| Restraint | Higher production costs | ★★★★☆ | Cold-pressing yields lower output than conventional methods, raising per-unit costs for manufacturers. |
| Restraint | Shelf-life limitations | ★★★☆☆ | Lack of preservatives creates storage and distribution challenges. |
| Trend | Functional oil blends | ★★★★★ | Omega-enriched, vitamin-fortified, and specialty blends drive targeted nutrition markets. |
| Trend | Sustainable processing | ★★★★☆ | Zero-waste pressing, seed-to-bottle traceability, and carbon-neutral operations are becoming key differentiators. |
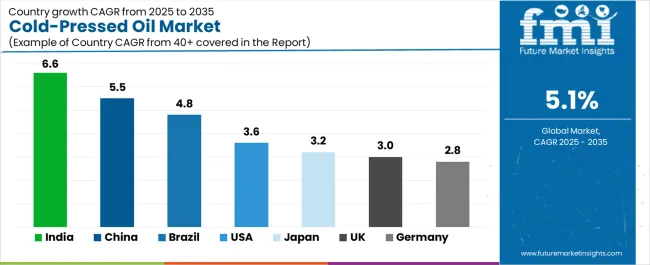
The cold-pressed oil market demonstrates varied regional dynamics with Growth Leaders including India (6.6% growth rate) and China (5.5% growth rate) driving expansion through rising health consciousness and premium consumption trends. Steady Performers encompass United States (3.6% growth rate), United Kingdom (3.0% growth rate), and developed regions, benefiting from established wellness industries and organic product adoption. Emerging Markets feature Brazil (4.8% growth rate) and developing regions, where growing middle-class consumption and health awareness support consistent growth patterns.
Regional synthesis reveals Asian markets leading adoption through traditional oil consumption patterns and wellness trend integration, while North American countries maintain steady expansion supported by clean-label movements and premium positioning strategies. European markets show slower growth driven by market maturity and established consumption patterns.
| Region / Country | CAGR (2025 to 2035) | How to Win | What to Watch Out |
|---|---|---|---|
| India | 6.6 | Focus on quality variance across traditional producers; develop local oil varieties; leverage heritage positioning | Price sensitivity; fragmented producer base |
| China | 5.5 | Lead with health-benefit positioning; highlight functional and premium oils | Regulatory changes; import competition challenges |
| Brazil | 4.8 | Leverage tropical oil varieties (e.g., coconut, palm alternatives); invest in consumer education | Distribution infrastructure gaps; need for brand building |
| United States | 3.6% | Premium organic positioning; emphasize clean-label and wellness branding | Market saturation; retail consolidation pressures |
| Japan | 3.2% | Stress quality, purity, and heritage; align with health & aging demographics | High import dependency; shrinking consumer base |
| United Kingdom | 3.0% | Sustainability credentials; carbon-neutral and traceable sourcing | Brexit impacts; economic pressures on premium oils |
| Germany | 2.8% | Technical excellence and certification-driven positioning | Slow growth in an over-mature, highly competitive market |
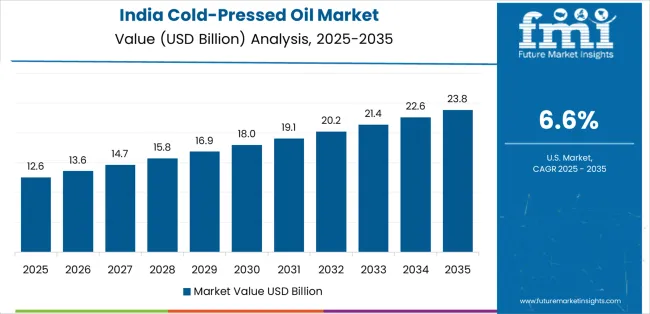
India establishes fastest market growth through deep-rooted traditional oil consumption and accelerating health consciousness development, integrating cold-pressed oils as premium alternatives in cooking and wellness applications. The country's 6.6% growth rate reflects traditional extraction method revival and middle-class premiumization that drive demand for cold-pressed systems in food and personal care sectors. Growth concentrates in major metropolitan centers, including Mumbai, Delhi, and Bangalore, where health-conscious consumers showcase premium oil adoption that appeals to manufacturers seeking quality differentiation and wellness positioning applications.
Indian processors are developing regional oil varieties that combine traditional knowledge with modern extraction capabilities, including mustard, groundnut, and sesame oil specialties with enhanced nutritional features. Distribution channels through modern retail and e-commerce platforms expand market access, while traditional medicine integration supports adoption across therapeutic and wellness segments.
Strategic Market Indicators:
In Beijing, Shanghai, and Guangzhou, health-conscious consumers and premium retailers are adopting cold-pressed oils as standard products for nutritional optimization and culinary excellence applications, driven by increasing wellness awareness and quality preference programs. The market holds a 5.5% growth rate, supported by expanding middle-class consumption and health trend adoption that promote cold-pressed oils for daily nutrition. Chinese operators are importing and producing cold-pressed systems that provide verified health benefits and quality assurance features, particularly appealing in urban regions where health consciousness and product authenticity represent critical purchase drivers.
Market expansion benefits from growing e-commerce capabilities and social media influence programs that enable rapid market education and brand development for cold-pressed oil categories. Consumer adoption follows patterns established in organic food sectors, where health benefits and quality transparency drive purchasing decisions and brand loyalty.
Market Intelligence Brief:
United States establishes steady market growth through comprehensive wellness industry infrastructure and clean-label movement development, integrating cold-pressed oils across food and personal care applications. The country's 3.6% growth rate reflects mature market dynamics and established premium positioning that supports widespread use of cold-pressed systems in health-conscious consumer segments. Growth concentrates in major wellness markets, including California, New York, and Colorado, where natural product adoption showcases mature cold-pressed deployment that appeals to consumers seeking verified health benefits and sustainable production applications.
American cold-pressed providers leverage established distribution networks and comprehensive marketing capabilities, including organic certification programs and wellness education that create consumer relationships and brand advantages. The market benefits from mature natural product regulations and quality standards that support cold-pressed positioning while advancing category development and innovation opportunities.
Market Intelligence Brief:
Brazil's market expansion benefits from abundant tropical oil sources, including coconut, palm kernel, and specialty nut varieties, combined with growing health consciousness that positions the country for sustained cold-pressed growth. The country maintains a 4.8% growth rate, driven by natural resource advantages and increasing wellness adoption, including premium oil consumption and beauty application development.
Market dynamics focus on leveraging agricultural advantages while addressing infrastructure challenges that affect national distribution and cold-chain requirements. Growing urban wellness trends create continued demand for cold-pressed systems in premium retail and specialty store channels.
Strategic Market Considerations:
Germany's advanced natural product market demonstrates sophisticated cold-pressed oil deployment with documented quality excellence in food applications and cosmetic formulations through integration with existing organic systems and sustainability infrastructure. The country leverages technical expertise in extraction technology and quality certification to maintain a 2.8% growth rate. Processing centers, including Bavaria, Baden-Württemberg, and North Rhine-Westphalia, showcase premium installations where cold-pressed systems integrate with comprehensive organic platforms and sustainability management systems to optimize nutritional preservation and environmental effectiveness.
German processors prioritize quality reliability and EU organic compliance in cold-pressed development, creating demand for premium systems with advanced features, including temperature monitoring and oxidation prevention technology. The market benefits from established natural product infrastructure and consumer willingness to pay premiums for verified quality and sustainability credentials.
Market Intelligence Brief:
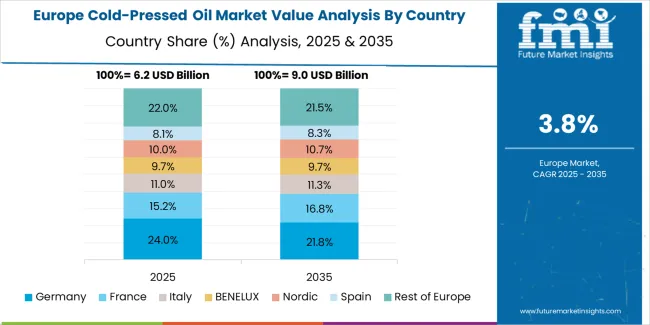
The European cold-pressed oil market is projected to grow from USD 6.8 billion in 2025 to USD 9.7 billion by 2035, registering a CAGR of 3.6% over the forecast period. Germany is expected to maintain its leadership position with a 24.5% market share in 2025, supported by its advanced organic food infrastructure and quality standardization systems.
United Kingdom follows with a 22.3% share in 2025, driven by comprehensive wellness programs and sustainable product initiatives. France holds a 20.8% share through culinary excellence applications and artisanal oil traditions. Italy commands an 18.2% share through olive oil heritage, while Spain accounts for 8.7% in 2025. The Rest of Europe region is anticipated to maintain its collective share from 5.5% to 5.8% by 2035, attributed to steady adoption in Nordic countries and emerging organic segments in Eastern European markets.
| Stakeholder | Typical Strengths | What They Actually Control | Typical Blind Spots |
|---|---|---|---|
| Global brands | Distribution reach, marketing spend, brand recognition, consistent quality standards, certifications | Brand credibility, global supply access, consumer trust | Agricultural dependency; supply volatility risks |
| Regional processors | Local sourcing, artisanal methods, traditional varieties, authenticity | Agricultural relationships, niche product differentiation | Scale limitations; export barriers |
| Organic specialists | Certification chains, traceable sourcing, pure processing | Premium positioning, sustainability credentials | Higher costs; yield pressures |
| Innovation leaders | Specialty blends, functional formulations, strong R&D capabilities | Product differentiation, higher-margin innovation | Production complexity; need for market education |
| E-commerce natives | Direct-to-consumer channels, digital marketing, subscription models | Customer data, agility, quality control in online sales | Logistics costs; fulfillment & supply chain challenges |
| Item | Value |
|---|---|
| Quantitative Units | USD 24.6 billion (2025 baseline) |
| Product Category | Food Industry, Cosmetics & Personal Care, Pharmaceuticals, Others |
| Oil Type | Peanut, Coconut, Olive, Sunflower, Rapeseed, Sesame, Others |
| Nature | Conventional, Organic |
| Distribution Channel | B2C, B2B |
| Packaging | Bottles, Pouches, Cans, Bulk |
| End Use | Cooking, Skincare, Aromatherapy, Medicinal, Industrial |
| Regions Covered | North America, Latin America, Western Europe, Eastern Europe, East Asia, South Asia Pacific, Middle East & Africa |
| Countries Covered | United States, China, Germany, India, United Kingdom, Japan, Brazil, Canada, France, Italy, +25 additional countries |
| Key Companies | NOW Foods, Aura Cacia, Pukka Herbs, Orgatma Cold-Pressed Oils, Mountain Rose Herbs, Banyan Botanicals, Naissance, Dr. Adorable Inc., Pure Acres Farm, La Tourangelle, Spectrum Organics, Biona Organic |
| Additional Attributes | Dollar sales by oil type & category segments; regional adoption trends (Asia Pacific, North America, Europe); competitive landscape (oil processors & brand owners); consumer preferences (health benefits & authenticity); integration with wellness trends & clean-label movements; innovations in extraction & nutrient preservation; sustainable processing with traceability & organic certification optimization |
The global cold-pressed oil market is estimated to be valued at USD 24.6 billion in 2025.
The market size for the cold-pressed oil market is projected to reach USD 40.5 billion by 2035.
The cold-pressed oil market is expected to grow at a 5.1% CAGR between 2025 and 2035.
The key product types in cold-pressed oil market are food industry, cosmetics and personal care, pharmaceuticals and others.
In terms of oil type, peanut oil segment to command 28.0% share in the cold-pressed oil market in 2025.


Our Research Products

The "Full Research Suite" delivers actionable market intel, deep dives on markets or technologies, so clients act faster, cut risk, and unlock growth.

The Leaderboard benchmarks and ranks top vendors, classifying them as Established Leaders, Leading Challengers, or Disruptors & Challengers.

Locates where complements amplify value and substitutes erode it, forecasting net impact by horizon

We deliver granular, decision-grade intel: market sizing, 5-year forecasts, pricing, adoption, usage, revenue, and operational KPIs—plus competitor tracking, regulation, and value chains—across 60 countries broadly.

Spot the shifts before they hit your P&L. We track inflection points, adoption curves, pricing moves, and ecosystem plays to show where demand is heading, why it is changing, and what to do next across high-growth markets and disruptive tech

Real-time reads of user behavior. We track shifting priorities, perceptions of today’s and next-gen services, and provider experience, then pace how fast tech moves from trial to adoption, blending buyer, consumer, and channel inputs with social signals (#WhySwitch, #UX).

Partner with our analyst team to build a custom report designed around your business priorities. From analysing market trends to assessing competitors or crafting bespoke datasets, we tailor insights to your needs.
Supplier Intelligence
Discovery & Profiling
Capacity & Footprint
Performance & Risk
Compliance & Governance
Commercial Readiness
Who Supplies Whom
Scorecards & Shortlists
Playbooks & Docs
Category Intelligence
Definition & Scope
Demand & Use Cases
Cost Drivers
Market Structure
Supply Chain Map
Trade & Policy
Operating Norms
Deliverables
Buyer Intelligence
Account Basics
Spend & Scope
Procurement Model
Vendor Requirements
Terms & Policies
Entry Strategy
Pain Points & Triggers
Outputs
Pricing Analysis
Benchmarks
Trends
Should-Cost
Indexation
Landed Cost
Commercial Terms
Deliverables
Brand Analysis
Positioning & Value Prop
Share & Presence
Customer Evidence
Go-to-Market
Digital & Reputation
Compliance & Trust
KPIs & Gaps
Outputs
Full Research Suite comprises of:
Market outlook & trends analysis
Interviews & case studies
Strategic recommendations
Vendor profiles & capabilities analysis
5-year forecasts
8 regions and 60+ country-level data splits
Market segment data splits
12 months of continuous data updates
DELIVERED AS:
PDF EXCEL ONLINE
Oily Waste Can Market Size and Share Forecast Outlook 2025 to 2035
Oil and Gas Seal Market Size and Share Forecast Outlook 2025 to 2035
Oil Coalescing Filter Market Size and Share Forecast Outlook 2025 to 2035
Oil-immersed Iron Core Series Reactor Market Size and Share Forecast Outlook 2025 to 2035
Oil and Gas Sensor Market Forecast Outlook 2025 to 2035
Oil Packing Machine Market Forecast and Outlook 2025 to 2035
Oil and Gas Pipeline Coating Market Forecast and Outlook 2025 to 2035
Oilfield Scale Inhibitor Market Size and Share Forecast Outlook 2025 to 2035
Oil-in-Water Anionic Emulsifier Market Size and Share Forecast Outlook 2025 to 2035
Oil and Gas Field Services Market Size and Share Forecast Outlook 2025 to 2035
Oil Control Shampoo Market Size and Share Forecast Outlook 2025 to 2035
Oil Expellers Market Size and Share Forecast Outlook 2025 to 2035
Oilfield Stimulation Chemicals Market Size and Share Forecast Outlook 2025 to 2035
Oiler Kits Market Size and Share Forecast Outlook 2025 to 2035
Oil Pressure Sensor Market Size and Share Forecast Outlook 2025 to 2035
Oil Filled Power Transformer Market Size and Share Forecast Outlook 2025 to 2035
Oily Skin Control Products Market Analysis - Size and Share Forecast Outlook 2025 to 2035
Oil Immersed Shunt Reactor Market Size and Share Forecast Outlook 2025 to 2035
Oil Country Tubular Goods Market Size and Share Forecast Outlook 2025 to 2035
Oil Filled Distribution Transformer Market Size and Share Forecast Outlook 2025 to 2035

Thank you!
You will receive an email from our Business Development Manager. Please be sure to check your SPAM/JUNK folder too.
Chat With
MaRIA