Global Oil and Gas Fittings Market Snapshot (2022 to 2029)

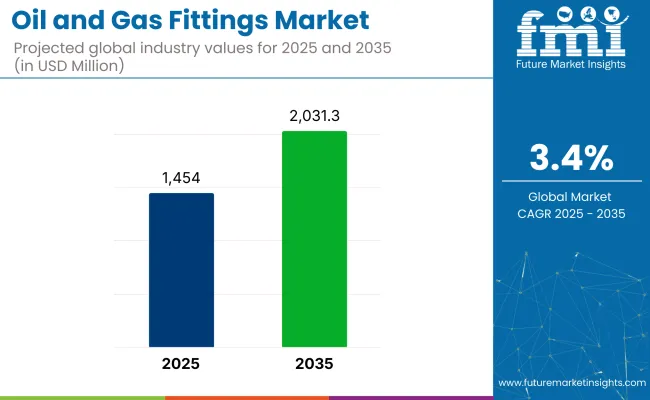
Future Market Insights (FMI) has forecasted the global Oil and Gas Fittings Market to register year-on-year growth of 3.2% in 2022 reaching a value of about US$ 1,326.8 Million by 2022 end.

Oil and gas fittings such as tees and flanges are major segments expected to dominate the market. It is used in upstream, midstream, and downstream applications, with the most popular upstream fittings such as adapters, male pins, and studded crosses.

Attribute Details
Global Oil and Gas Fittings Market Analysis (2021A) US$ 1,285.2 Million
Global Oil and Gas Fittings Market Analysis Estimated Year Value (2022E) US$ 1,326.8 Million
Global Oil and Gas Fittings Market Analysis Projected Year Value (2028F) US$ 1,675.4 Million
Value CAGR (2022 to 2029) 3.4%
Collective Value Share: Top 3 Countries (2022E) 36.2%

Pipes, wellhead systems, transmission and distribution pipelines, and other applications cater to the prominent demand for specialized Oil and Gas Fittings. The global business is anticipated to witness a considerable value CAGR of 3.4% during the period 2022 and 2029.

FMI has identified North America to remain a key market for Oil and Gas Fitting over the forecast period owing to increasing demand from end-use applications. The region is estimated to witness a value CAGR of 3.8% in the industry of Oil and Gas Fittings.

Don't pay for what you don't need

Customize your report by selecting specific countries or regions and save 30%!

How The Market Progressed Till June 2022?

Market Statistics Details
H1,2021 (A) 3.1%
H1,2022 Projected (P) 3.2%
H1,2022 Outlook (O) 2.9%
BPS Change : H1,2022 (O) - H1,2022 (P) (-) 34 ↓
BPS Change : H1,2022 (O) - H1,2021 (A) (-) 24 ↓

FMI presents a half-yearly comparison and insightful analysis of oil and gas fittings market growth. Rising tender and contract orders, especially in developing nations, are key factors driving the strong growth trend in oil and gas fittings sales. Due to the increasing number of pipeline projects linking countries like China, India, the Middle East, and the ASEAN region, the demand for various oil and gas fittings is projected to increase in the upcoming years.

According to FMI analysis, the variation between the BPS values observed in the Oil and Gas Fittings market in H1, 2022-Outlook over H1, 2022 projected reflects a decline of 34 units. However, compared to H1, 2021, the market is expected to fall by 24 BPS in H1 -2022.

Transcontinental pipeline extensions and consumption that are rising in tandem with GDP development will further boost the global market for oil and gas fittings. Sales will be boosted during the projection period by the expanded potential for Indian tendering and auctioning for the deployment of new and replacement oil and gas fittings.

Current manufacturers face a threat from energy suppliers' backward integration into the production of oil and gas fittings because they can supply comparable products for less money. This leads to fierce market competition in local markets and low profitability across the value chain. The adoption of such a practice negatively impacts the market's growth.

Oil and Gas Fittings Market

2016 to 2021 Global Oil and Gas Fittings Market Outlook Compared to 2022 to 2029 Forecast

Rising tender and contract orders in developing markets is a crucial element that will drive a high growth trend in Oil and Gas Fittings sales, particularly in developing economies. The demand for various oil and gas fittings is likely to rise in the coming years due to the growing number of pipeline projects between nations such as China, India, the Middle East, and the ASEAN area.

The worldwide oil and gas fittings industry will be boosted by transcontinental pipeline construction. As a result of the positive influence of new pipeline projects on market growth, manufacturers are focusing on installing oil and gas fittings in downstream areas. The market is projected to grow at a moderate pace, driven by upstream and downstream contracts, investment in refinery up-gradation projects, and replacement of the legacy Oil and Gas Fittings.

The demand outlook for Oil and Gas Fitting between 2014 and 2021 remains at 2.8% as the pandemic crisis has impacted the market. Backward integration by energy suppliers to produce Oil and Gas Fittings poses a threat to present manufacturers because these suppliers offer similar products at a lower cost, resulting in fierce market competition and lower profitability across the value chain.

The growth of Oil and Gas Fittings is likely to grow at a growth rate of 2.6% by Volume over the assessment period of 2022 to 2029.

Nikhil Kaitwade
Nikhil Kaitwade

Principal Consultant

Talk to Analyst

Find your sweet spots for generating winning opportunities in this market.

Which key end-use industries drive demand for Oil and Gas Fittings?

The increased need for the improved pipeline and processing safety has resulted from an increase in the number of accidents. As a result of the numerous restrictions created by regulatory agencies to promote operational safety, there has been an increasing demand in such industrial settings.

Various manufacturers, suppliers, and distributors are increasingly focusing on new deployment contracts that might help them increase income from developing economies. The number of onshore wells is expected to rise in response to the rising demand for oil and gas from various end-use sectors.

Major businesses are upgrading their portfolios by developing new processing plants, pipelines, and production facilities in response to recent oil and gas developments. As a result, the demand for Oil and Gas Fittings is likely to propel in the coming years in the oil & gas industry.

How intense competition will impact Oil and Gas Fittings market growth?

The fittings market is characterized by the existence of a number of large, medium, and small-scale players and service providers. As a result, there is a lot of fragmentation in the industry.

Backward integration by energy suppliers to manufacture Oil and Gas Fittings is a threat to current manufacturers because these suppliers offer similar products at a cheaper cost, resulting in harsh market competition in local markets and poor profitability throughout the value chain.

Adoption of such practices may have a negative impact on the Oil and Gas Fittings market. Raw material suppliers also participate in the Oil and Gas Fittings manufacturing process by offering their own products, solutions, and services. As a result, in the Oil and Gas Fittings Market, competition is critical.

Get the data you need at a Fraction of the cost

Personalize your report by choosing insights you need
and save 40%!

What was the Impact of the COVID-19 Crisis on the Oil and Gas Fittings Market?

SARS-introduction COV-2 in 2020 has had a massive impact on the global economy. A reduction in demand in a number of end-use industries, as well as supply chain problems, had damaged the global industry. Furthermore, due to extensive lockdowns and movement restrictions, economic activity had come to a halt.

During COVID-19, the oil and gas industry was one of the worst-affected industries. Until the third quarter of 2020, several large midstream corporations saw lower net earnings. Due to mandated tight limitations in key countries like the United States of America, India, and others, pipeline projects in many countries have been delayed.

Reduced gas demand as a result of lower energy usage and travel restrictions has had a negative impact on gas consumption in various countries. The closure of the end-use industries had an impact on the global growth rate of Oil and Gas Fittings in 2020.

Country-wise Insights

Which is the most prominent market for Oil and Gas Fitting in North America?

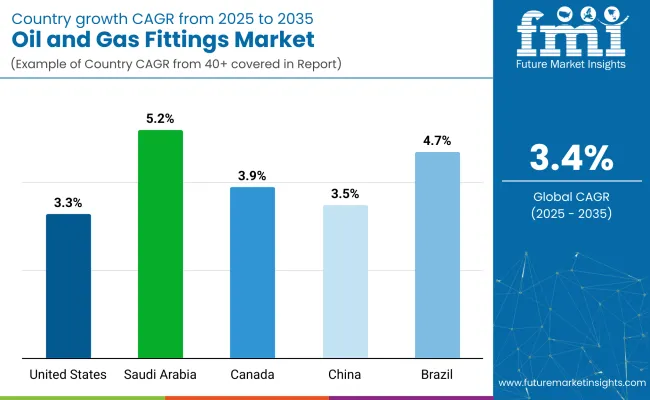
In 2022, USA Oil and Gas Fittings Market is expected to register 3.1% year-on-year growth by volume. The number of operating oil and gas wells in the country of the USA is comparatively increasing, following a rise in crude oil prices, which encouraged oil and gas companies in the USA to invest in deep drilling activities. Every year, global companies invest hundreds of billions of dollars in the USA to boost economic growth.

Deep-water offshore activities are expected to drive the USA oil and gas upstream market in the forecast period. The demand for Oil and Gas Fittings in North America is expected to be fuelled by a number of prominent manufacturers and distributors in the region that focus on contract acquisitions.

Why the Demand for Oil and Gas Fittings Market is increasing in India?

Between 2022 and 2029, India is estimated to grow at a CAGR of 4.2% percent. The number of pipeline projects between nations such as India is increasing. In the future years, demand for various oil and gas fittings is predicted to skyrocket. Because of the government's favorable FDI investment rules and extraordinary growth in the oil and gas industry, companies are embracing innovative business model plans to set up shops in the country.

The worldwide oil and gas fittings market will be further fuelled by transcontinental pipeline expansions and consumption that is growing in lockstep with GDP growth. In the forecast period, the increased opportunity for tendering and auctioning in India for the deployment of new and replacement Oil and Gas Fittings will drive sales.

What is the scenario of Oil and Gas Fitting in China?

China’s Oil and Gas Fittings Market is expected to grow at a CAGR of 4.5% throughout the forecast period. Different types of fittings for oil and gas applications will be deployed in China's onshore and offshore projects. Oil and gas companies are increasing their investments in onshore and offshore drilling and production projects, and they are looking for operational efficiency as well as a return on investment, which will drive the market.

By establishing a solid supply chain in China, the companies can improve sales, resulting in business growth in these countries. It will continue to drive the global market for oil and gas fittings. China's oil and gas sector is steadily expanding, with additional projects on the horizon that will have a favorable impact on the East Asian Oil and Gas Fittings market.

Category-wise Insights

Which Product Type has the future potential for the Global Oil and Gas Fittings Market?

The tees segment is projected to create an absolute dollar opportunity of more than US$ 125.2 Million during the period of 2022 to 2029. Tees are assisting in the detection of unmanaged defects in aging tees and flanges, which can lead to leakages, corrosion, material loss, and contamination of the environment. Replacement of such old tees in onshore applications is gaining momentum, and demand has been steadily increasing over the last few years.

Which Working Pressure makes the most value from Oil and Gas Fittings Market?

Monitoring downhole pressure is also critical for extending the well's production life as much as possible. It also assures the overall system's safety and extends life expectancy. According to research, the pressure range of 4000-6000 psi will be the most long-lasting, and it will be utilized more frequently in the near future. The 4,000 - 6,000 psi segment is projected to create an absolute dollar opportunity of more than US$ 119.7 Million during the period of 2022 to 2029.

Which Operation Type makes the most value in the forecast period?

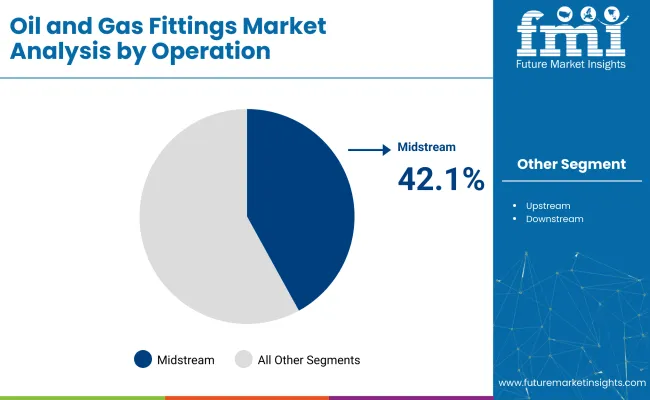
The downstream segment is projected to create an absolute dollar opportunity of more than US$ 202.1 Million during the period of 2022 to 2029. As a result of the positive influence of new pipeline projects on market growth, manufacturers are focusing on installing oil and gas fittings downstream. Due to an increase in the number of downstream projects, it is expected to be one of the most important rising countries in the global oil and gas fittings market.

Which Material Type is most preferred in Oil and Gas Fittings Market?

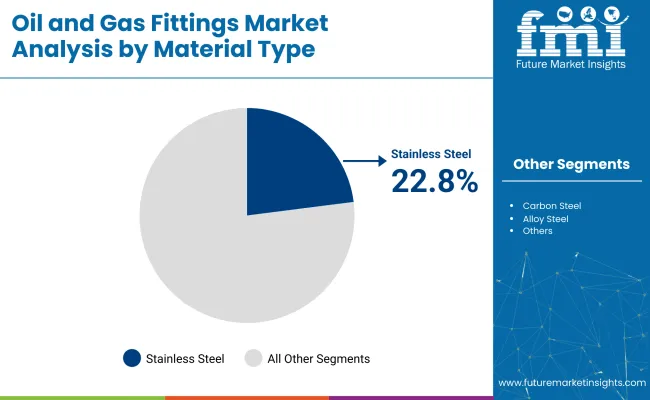
Carbon steel is a robust metal with high wear resistance. In the oil and gas business, it is the most extensively utilized form of steel. It's employed in the construction of flowlines, structural components, pipelines, and platforms, among other things.

Steel, in some form or another, is used in the oil and gas sector for a variety of purposes. In the coming years, product providers should focus on meeting customer demand for carbon steel-based Oil and Gas Fittings at competitive prices, as well as develop corrosion resistance products. The carbon Steel segment is projected to create an absolute dollar opportunity of more than US$ 139.2 Million during the period of 2022 to 2029.

Which Application Type dominates the market growth?

Oil and gas companies are increasing their investments in onshore drilling and production projects, and they are looking for operational efficiency as well as a return on investment, which is driving the industry.

The number of onshore wells is expected to rise in order to meet the rising demand for oil and gas from various end-use sectors, which is expected to have a positive impact on the installation of new oil and gas fittings and flanges, as these products are widely used for onshore oil production and transmission. The onshore segment is projected to create an absolute dollar opportunity of more than US$ 301.9 Million during the period of 2022 to 2029.

Competitive Landscape

Over the past few years, an increment in the number of acquisitions and expansion activities has been witnessed in the Oil and Gas Fittings market. Several key players are focusing on improving the product performance parameters for various applications. The emergence of various manufacturers had also been witnessed in global businesses, especially in India, the USA, and China.

For Instance:

  • On 8th Jan ’19, Anvil International acquired Megawatt Machine Services, LLC which provides various services, maintenance, and replacement for valves used in oil and gas, power plant, and chemical plant applications.
  • On 14th November ’18, AVK UK Ltd. introduced Pipeline Fitting Solutions, an updated range of high-quality flange adaptors, dismantling joints, under-pressure tees, repair clamps, and pipe repair products.
  • On 4th April 2019, Ocean Power Technologies, Inc., which is a leader in innovative ocean energy solutions announced a collaboration with Acteon Field Life Service, a subsidiary of Acteon Group Ltd.
  • On 20th August 2018, The Weir Group PLC signed a contract worth US$ 50 Million in Iraq to provide support for oil field and valve repair with the intent to generate significant revenue aftermarket.
  • On 12th December 2018, the Acteon Group acquired Deepwater Corrosion Services Inc., which is a provider of subsea corrosion control for all asset types, including oil and gas platforms and wind turbines.

The latest study conducted by Future Market Insights covers all the strategies and success factors of key manufacturers of the market.

*The list is not exhaustive, and is only for representational purposes. Full competitive intelligence with SWOT analysis is available in the report

Scope of Report

Attribute Details
Forecast Period 2022 to 2029
Historical Data Available for 2014 to 2021
Market Analysis US$ Million for Value and Units for Volume
Key Regions Covered North America, Europe, Middle East and Africa(MEA), East Asia, South Asia, Oceania, Latin America
Key Countries Covered USA, Canada, Germany, Italy, France, United Kingdom, Spain, Nordics, Russia, Brazil, Mexico, Argentina, China, Japan, South Korea, India, Indonesia, Thailand, Malaysia, Singapore, ASEAN, GCC Countries, North Africa, South Africa, and Oceania.
Key Segments Covered By product type, working pressure, operation, material type, and by application.
Key Companies Profiled
  • Anvil International
  • AVK UK Ltd
  • B.O.P Products LLC.
  • Bonney Forge Corporation
  • FitTech Industries Pvt. Ltd.
  • Gelbach UK Ltd
  • Grupo Cuñado
  • Guezco Manufacturing Inc.
  • Hy-Lok USA, Inc.
  • ICARUS SA
  • JVS Engineers
  • KINGSA Industries
  • Probe Oil Tools
  • PSL Pipe & Fittings Co.
  • PT. Bima Drilling Tools
  • Sara Sae
  • The Weir Group PLC
  • Woodco USA
  • Yingkou Haitai Metal
  • Pipe Fittings Co. Ltd.
Report Coverage Market Forecast, Company Share Analysis, Competition Intelligence, Drivers, Restraints, Opportunities and Threats Analysis, Market Dynamics and Challenges, and Strategic Growth Initiatives
Customization & Pricing Available upon Request

Global Oil and Gas Fittings Market by Category

By Product Type:

  • Tees
    • Studded Tees
    • Flow Tees
  • Flanges
    • Blind/Test
    • Companion
    • Weld Neck
  • Adapters
    • Bottom Hole Test Adaptors
    • Double Studded Adapters
  • Male Pins
  • Studded Crosses

By Working Pressure:

  • Less than 1000 psi
  • 1000 - 2000 psi
  • 2000 - 3000 psi
  • 3000 - 4000 psi
  • 4000 - 5000 psi
  • Above 5000 psi

By Operation:

  • Upstream
  • Midstream
  • Downstream

By Material Type:

  • Carbon Steel
  • Stainless Steel
  • Alloy Steel
  • Fiberglass
  • Composite
  • Others

By Application:

  • Onshore
  • Offshore

By Region:

  • North America
  • Europe
  • Middle East and Africa(MEA)
  • East Asia
  • South Asia
  • Oceania
  • Latin America

Frequently Asked Questions

What is the market size of the global Oil and Gas Fittings Market?

The Global Oil and Gas Fittings Market is expected to total US$ 1,326.8 Million in 2022.

At what CAGR the demand for Oil and Gas Fitting rise in 2022?

The demand for Oil and Gas Fitting increased by 3.4% in 2022.

Who are the top players in the Global Oil and Gas Fittings Market and what is their total share?

Anvil International, AVK UK Ltd, B.O.P Products LLC., Bonney Forge Corporation, FitTech Industries Pvt. Ltd., Gelbach UK Ltd, Grupo Cuñado, Guezco Manufacturing Inc., Hy-Lok USA, Inc., ICARUS SA, JVS Engineers, KINGSA Industries, Probe Oil Tools, PSL Pipe & Fittings Co., are the leading market players. They collectively account for 30% to 35% of the global market share.

What is the market outlook of Oil and Gas Fitting in China?

The demand in China is expected to increase by 4.5 % CAGR between 2022 and 2029 on a value basis.

Which countries are the key consumers of Oil and Gas Fitting?

China, the USA, India, Germany, and France are the key consumers of the global Oil and Gas Fittings Market.

What are the key strategies shaping the Global Oil and Gas Fittings Market?

Various manufacturers, suppliers, and distributors are increasingly focusing on new deployment contracts that might help them increase income from developing economies. In addition, corporations can gain long-term contracts for product offerings by using online sales platforms, a broad sales network in developing countries, and long-term partnerships with customers and vendors. Market participants are concentrating on retaining and growing existing client connections.

Table of Content
1. Executive Summary | Oil and Gas Fittings Market

    1.1. Global Market Outlook

    1.2. Demand Side Trends

    1.3. Supply-Side Trends

    1.4. Technology Roadmap Analysis

    1.5. Analysis and Recommendations

2. Market Introduction

    2.1. Market Taxonomy

    2.2. Market Definition

3. Key Market Trends

    3.1. Key Trends Impacting the Market

    3.2. Product Innovation Trends

    3.3. New Products

4. Key Success Factors

5. Market Context

    5.1. Key Regulations

    5.2. Macro-Economic Factors

        5.2.1. Global GDP Forecast (US$ Billion) & Y-o-Y Growth

        5.2.2. GDP Growth Scenario of USA vs North America vs Global

        5.2.3. Global Energy Consumption Based on Type of Energy and Region in

        5.2.4. Demand Purview of Capex Projects

        5.2.5. Oil and Gas Industry Outlook (Y-O-Y Change)

        5.2.6. Global Proved Oil Reserves by Region

        5.2.7. Global Crude Oil Production & Consumption Overview by Region

        5.2.8. Global Natural Gas Production & Consumption Overview by Region

        5.2.9. Oil and Gas Production by Key Countries in British thermal units (quadrillion)

        5.2.10. Price Comparison of WTI and Brent Crude Oil, and Natural Gas from 2016 to 2022 in US$

        5.2.11. Key Countries with Shale Gas Resources (Million Cubic Meters)

        5.2.12. World Energy Consumption by Energy Source (quadrillion Btu)

    5.3. Forecast Factors – Relevance & Impact

    5.4. List of Key Oil & Gas Projects by Region

    5.5. Pipeline Contracts (Onshore/Offshore)

    5.6. Drilling Contracts (Onshore/Offshore)

    5.7. PVF Contracts (Onshore/Offshore)

    5.8. Value Chain

    5.9. Market Dynamics

        5.9.1. Drivers

        5.9.2. Restraints

        5.9.3. Opportunity

        5.9.4. Trends

6. Pricing Analysis

    6.1. Regional Pricing Analysis By Product Type

    6.2. Pricing Break-up

        6.2.1. Product Level Pricing

    6.3. Global Average Pricing Analysis Benchmark

7. Global Market (Market Size US$ Million) Analysis

    7.1. Historical Market Value (US$ Million) Analysis

    7.2. Current and Future Market Value (US$ Million) Projections

        7.2.1. Y-o-Y Growth Trend Analysis

        7.2.2. Absolute $ Opportunity Analysis

8. Global Market Analysis 2014 to 2021 and Forecast 2022 to 2029, By Product Type

    8.1. Introduction 

        8.1.1. Market Value Share Analysis By Product Type

        8.1.2. Y-o-Y Growth Analysis By Product Type

    8.2. Historical Market Size and Volume Analysis By Product Type 2014 to 2021

    8.3. Market Size and Volume Forecast By Product Type 2022 to 2029

        8.3.1. Tees

            8.3.1.1. Studded Tees

            8.3.1.2. Flow Tees

        8.3.2. Flanges

            8.3.2.1. Blind/Test

            8.3.2.2. Companion

            8.3.2.3. Weld Neck

        8.3.3. Adapters

            8.3.3.1. Bottom Hole Test Adaptors

            8.3.3.2. Double Studded Adapters

        8.3.4. Male Pins

        8.3.5. Studded Crosses

    8.4. Market Attractiveness Analysis By Product Type

9. Global Market Analysis 2014 to 2021 and Forecast 2022 to 2029, By Working Pressure

    9.1. Introduction

        9.1.1. Market Value Share Analysis By Working Pressure

        9.1.2. Y-o-Y Growth Analysis By Working Pressure

    9.2. Historical Market Size and Volume Analysis By Working Pressure 2014 to 2021

    9.3. Market Size and Volume Forecast By Working Pressure 2022 to 2029

        9.3.1. Less than 1000 psi

        9.3.2. 1000 - 2000 psi

        9.3.3. 2000 - 3000 psi

        9.3.4. 3000 - 4000 psi

        9.3.5. 4000 - 5000 psi

        9.3.6. Above 5000 psi

    9.4.  Market Attractiveness Analysis By Working Pressure

10. Global Market Analysis 2014 to 2021 and Forecast 2022 to 2029, By Operation

    10.1. Introduction

        10.1.1. Market Value Share Analysis By Operation

        10.1.2. Y-o-Y Growth Analysis By Operation

    10.2. Historical Market Size and Volume Analysis By Operation 2014 to 2021

    10.3. Market Size and Volume Forecast By Operation 2022 to 2029

        10.3.1. Upstream

        10.3.2. Midstream

        10.3.3. Downstream

    10.4.       Market Attractiveness Analysis By Operation

11. Global Market Analysis 2014 to 2021 and Forecast 2022 to 2029, By Material Type

    11.1. Introduction

        11.1.1. Market Value Share Analysis By Material Type

        11.1.2. Y-o-Y Growth Analysis By Material Type

    11.2. Historical Market Size and Volume Analysis By Material Type 2014 to 2021

    11.3. Market Size and Volume Forecast By Material Type 2022 to 2029

        11.3.1. Carbon Steel

        11.3.2. Stainless Steel

        11.3.3. Alloy Steel

        11.3.4. Fiberglass

        11.3.5. Composite

        11.3.6. Others

    11.4. Market Attractiveness Analysis By Material Type

12. Global Market Analysis 2014 to 2021 and Forecast 2022 to 2029, By Application

    12.1. Introduction 

        12.1.1. Market Value Share Analysis By Application

        12.1.2. Y-o-Y Growth Analysis By Application

    12.2. Historical Market Size and Volume Analysis By Application 2014 to 2021

    12.3. Market Size and Volume Forecast By Application 2022 to 2029

        12.3.1. Onshore

        12.3.2. Offshore

    12.4. Market Attractiveness Analysis By Application

13. Global Market Analysis 2014 to 2021 and Forecast 2022 to 2029, By Region

    13.1. Introduction

        13.1.1. Market Value Share Analysis By Region

        13.1.2. Y-o-Y Growth Analysis By Region

    13.2. Historical Market Size and Volume Analysis By Region 2014 to 2021

    13.3. Market Size and Volume Forecast By Region 2022 to 2029

        13.3.1. North America

        13.3.2. Europe

        13.3.3. Middle East and Africa(MEA)

        13.3.4. East Asia

        13.3.5. South Asia

        13.3.6. Oceania

        13.3.7. Latin America

    13.4. Market Attractiveness Analysis By Application

14. USA Market Analysis

    14.1. Introduction

    14.2. Pricing Analysis

    14.3. Historical Market Size and Volume Analysis By Market Segments, 2014 to 2021

    14.4. Market Size and Volume Forecast By Market Segments, 2022 to 2029

        14.4.1. By Product Type

        14.4.2. By Working Pressure

        14.4.3. By Operation

        14.4.4. By Material Type

        14.4.5. By Application

    14.5. Market Attractiveness Analysis

        14.5.1. By Product Type

        14.5.2. By Working Pressure

        14.5.3. By Operation

        14.5.4. By Material Type

        14.5.5. By Application

15. North America Market Analysis

    15.1. Introduction

    15.2. Pricing Analysis

    15.3. Historical Market Size and Volume Analysis By Market Segments, 2014 to 2021

    15.4. Market Size and Volume Forecast By Market Segments, 2022 to 2029

        15.4.1. By Country

            15.4.1.1. USA

            15.4.1.2. Canada

        15.4.2. By Product Type

        15.4.3. By Working Pressure

        15.4.4. By Operation

        15.4.5. By Material Type

        15.4.6. By Application

    15.5. Market Attractiveness Analysis

        15.5.1. By Country

        15.5.2. By Product Type

        15.5.3. By Working Pressure

        15.5.4. By Operation

        15.5.5. By Material Type

        15.5.6. By Application

16. Europe Market Analysis

    16.1. Introduction

    16.2. Pricing Analysis

    16.3. Historical Market Size and Volume Analysis By Market Segments, 2014 to 2021

    16.4. Market Size and Volume Forecast By Market Segments, 2022 to 2029

        16.4.1. By Country

            16.4.1.1. Germany

            16.4.1.2. Italy

            16.4.1.3. France

            16.4.1.4. United Kingdom

            16.4.1.5. Spain

            16.4.1.6. Nordic

            16.4.1.7. Russia

            16.4.1.8. Rest of Europe

        16.4.2. By Product Type

        16.4.3. By Working Pressure

        16.4.4. By Operation

        16.4.5. By Material Type

        16.4.6. By Application

    16.5. Market Attractiveness Analysis

        16.5.1. By Country

        16.5.2. By Product Type

        16.5.3. By Working Pressure

        16.5.4. By Operation

        16.5.5. By Material Type

        16.5.6. By Application

17. Latin America Market Analysis

    17.1. Introduction

    17.2. Pricing Analysis

    17.3. Historical Market Size and Volume Analysis By Market Segments, 2014 to 2021

    17.4. Market Size and Volume Forecast By Market Segments, 2022 to 2029

        17.4.1. By Country

            17.4.1.1. Brazil

            17.4.1.2. Mexico

            17.4.1.3. Argentina

            17.4.1.4. Rest of Latin America

        17.4.2. By Product Type

        17.4.3. By Working Pressure

        17.4.4. By Operation

        17.4.5. By Material Type

        17.4.6. By Application

    17.5. Market Attractiveness Analysis

        17.5.1. By Country

        17.5.2. By Product Type

        17.5.3. By Working Pressure

        17.5.4. By Operation

        17.5.5. By Material Type

        17.5.6. By Application

18. East Asia Market Analysis

    18.1. Introduction

    18.2. Pricing Analysis

    18.3. Historical Market Size and Volume Analysis By Market Segments, 2014 to 2021

    18.4. Market Size and Volume Forecast By Market Segments, 2022 to 2029

        18.4.1. By Country

            18.4.1.1. China

            18.4.1.2. Japan

            18.4.1.3. South Korea

        18.4.2. By Product Type

        18.4.3. By Working Pressure

        18.4.4. By Operation

        18.4.5. By Material Type

        18.4.6. By Application

    18.5. Market Attractiveness Analysis

        18.5.1. By Country

        18.5.2. By Product Type

        18.5.3. By Working Pressure

        18.5.4. By Operation

        18.5.5. By Material Type

        18.5.6. By Application

19. South Asia Market Analysis

    19.1. Introduction

    19.2. Pricing Analysis

    19.3. Historical Market Size and Volume Analysis By Market Segments, 2014 to 2021

    19.4. Market Size and Volume Forecast By Market Segments, 2022 to 2029

        19.4.1. By Country

            19.4.1.1. India

            19.4.1.2. Indonesia

            19.4.1.3. Thailand

            19.4.1.4. Malaysia

            19.4.1.5. Singapore

            19.4.1.6. Rest of South Asia

        19.4.2. By Product Type

        19.4.3. By Working Pressure

        19.4.4. By Operation

        19.4.5. By Material Type

        19.4.6. By Application

    19.5. Market Attractiveness Analysis

        19.5.1. By Country

        19.5.2. By Product Type

        19.5.3. By Working Pressure

        19.5.4. By Operation

        19.5.5. By Material Type

        19.5.6. By Application

20. Middle East and Africa (MEA) Market Analysis

    20.1. Introduction

    20.2. Pricing Analysis

    20.3. Historical Market Size and Volume Analysis By Market Segments, 2014 to 2021

    20.4. Market Size and Volume Forecast By Market Segments, 2022 to 2029

        20.4.1. By Country

            20.4.1.1. GCC Countries

            20.4.1.2. North Africa

            20.4.1.3. South Africa

            20.4.1.4. Rest of Middle East and Africa(MEA)

        20.4.2. By Product Type

        20.4.3. By Working Pressure

        20.4.4. By Operation

        20.4.5. By Material Type

        20.4.6. By Application

    20.5. Market Attractiveness Analysis

        20.5.1. By Country

        20.5.2. By Product Type

        20.5.3. By Working Pressure

        20.5.4. By Operation

        20.5.5. By Material Type

        20.5.6. By Application

21. Oceania Market Analysis

    21.1. Introduction

    21.2. Pricing Analysis

    21.3. Historical Market Size and Volume Analysis By Market Segments, 2014 to 2021

    21.4. Market Size and Volume Forecast By Market Segments, 2022 to 2029

        21.4.1. By Country

            21.4.1.1. Australia

            21.4.1.2. New Zealand

        21.4.2. By Product Type

        21.4.3. By Working Pressure

        21.4.4. By Operation

        21.4.5. By Material Type

        21.4.6. By Application

    21.5. Market Attractiveness Analysis

        21.5.1. By Country

        21.5.2. By Product Type

        21.5.3. By Working Pressure

        21.5.4. By Operation

        21.5.5. By Material Type

        21.5.6. By Application

22. Emerging Countries Analysis

    22.1. Introduction 

        22.1.1. Market Proportion Analysis 

        22.1.2. Global Vs. Country Growth Comparison

    22.2. Indonesia Market Analysis

        22.2.1. PEST Analysis

        22.2.2. Market Proportion Analysis By Market Taxonomy

        22.2.3. Indonesia Market Volume Analysis By Market Taxonomy

            22.2.3.1. By Product Type

            22.2.3.2. By Working Pressure

            22.2.3.3. By Operation 

            22.2.3.4. By Material Type

            22.2.3.5. By Application

        22.2.4. Average Pricing Analysis

        22.2.5. Indonesia Market Value (US$ Million) Analysis By Market Taxonomy

            22.2.5.1. By Product Type

            22.2.5.2. By Working Pressure

            22.2.5.3. By Operation

            22.2.5.4. By Material Type 

            22.2.5.5. By Application 

        22.2.6. Indonesia – Vendor Landscape

    22.3. Thailand Market Analysis

        22.3.1. PEST Analysis

        22.3.2. Market Proportion Analysis By Market Taxonomy

        22.3.3. Thailand Market Volume Analysis By Market Taxonomy

            22.3.3.1. By Product Type

            22.3.3.2. By Working Pressure

            22.3.3.3. By Operation 

            22.3.3.4. By Material Type

            22.3.3.5. By Application

        22.3.4. Average Pricing Analysis

        22.3.5. Thailand Market Value (US$ Million) Analysis By Market Taxonomy

            22.3.5.1. By Product Type

            22.3.5.2. By Working Pressure

            22.3.5.3. By Operation

            22.3.5.4. By Material Type 

            22.3.5.5. By Application 

        22.3.6. Thailand – Vendor Landscape

    22.4. Brazil Market Analysis

        22.4.1. PEST Analysis

        22.4.2. Market Proportion Analysis By Market Taxonomy

        22.4.3. Brazil Market Volume Analysis By Market Taxonomy

            22.4.3.1. By Product Type

            22.4.3.2. By Working Pressure

            22.4.3.3. By Operation

            22.4.3.4. By Material Type

            22.4.3.5. By Application

        22.4.4. Average Pricing Analysis

        22.4.5. Brazil Market Value (US$ Million) Analysis By Market Taxonomy

            22.4.5.1. By Product Type

            22.4.5.2. By Working Pressure

            22.4.5.3. By Operation

            22.4.5.4. By Material Type

            22.4.5.5. By Application

        22.4.6. Brazil – Vendor Landscape

23. Market Structure Analysis

    23.1. Market Share Analysis

    23.2. Market Structure Analysis

    23.3. Market Intensity Mapping by Region

24. Competition Landscape

    24.1. Competition Dashboard

    24.2. Competition Benchmarking

    24.3. Competition Deep Dive

        24.3.1. Anvil International

            24.3.1.1. Overview

            24.3.1.2. Product Portfolio

            24.3.1.3. Production Footprint

            24.3.1.4. Sales Footprint

            24.3.1.5. Channel Footprint

            24.3.1.6. Strategy

                24.3.1.6.1. Marketing Strategy

                24.3.1.6.2. Product Strategy

                24.3.1.6.3. Channel Strategy

        24.3.2. AVK UK Ltd

            24.3.2.1. Overview

            24.3.2.2. Product Portfolio

            24.3.2.3. Production Footprint

            24.3.2.4. Sales Footprint

            24.3.2.5. Channel Footprint

            24.3.2.6. Strategy

                24.3.2.6.1. Marketing Strategy

                24.3.2.6.2. Product Strategy

                24.3.2.6.3. Channel Strategy

        24.3.3. B.O.P Products LLC.

            24.3.3.1. Overview

            24.3.3.2. Product Portfolio

            24.3.3.3. Production Footprint

            24.3.3.4. Sales Footprint

            24.3.3.5. Channel Footprint

            24.3.3.6. Strategy

                24.3.3.6.1. Marketing Strategy

                24.3.3.6.2. Product Strategy

                24.3.3.6.3. Channel Strategy

        24.3.4. Bonney Forge Corporation

            24.3.4.1. Overview

            24.3.4.2. Product Portfolio

            24.3.4.3. Production Footprint

            24.3.4.4. Sales Footprint

            24.3.4.5. Channel Footprint

            24.3.4.6. Strategy

                24.3.4.6.1. Marketing Strategy

                24.3.4.6.2. Product Strategy

                24.3.4.6.3. Channel Strategy

        24.3.5. FitTech Industries Pvt. Ltd.

            24.3.5.1. Overview

            24.3.5.2. Product Portfolio

            24.3.5.3. Production Footprint

            24.3.5.4. Sales Footprint

            24.3.5.5. Channel Footprint

            24.3.5.6. Strategy

                24.3.5.6.1. Marketing Strategy

                24.3.5.6.2. Product Strategy

                24.3.5.6.3. Channel Strategy

        24.3.6. Gelbach UK Ltd

            24.3.6.1. Overview

            24.3.6.2. Product Portfolio

            24.3.6.3. Production Footprint

            24.3.6.4. Sales Footprint

            24.3.6.5. Channel Footprint

            24.3.6.6. Strategy

                24.3.6.6.1. Marketing Strategy

                24.3.6.6.2. Product Strategy

                24.3.6.6.3. Channel Strategy

        24.3.7. Grupo Cuñado

            24.3.7.1. Overview

            24.3.7.2. Product Portfolio

            24.3.7.3. Production Footprint

            24.3.7.4. Sales Footprint

            24.3.7.5. Channel Footprint

            24.3.7.6. Strategy

                24.3.7.6.1. Marketing Strategy

                24.3.7.6.2. Product Strategy

                24.3.7.6.3. Channel Strategy

        24.3.8. Guezco Manufacturing Inc

            24.3.8.1. Overview

            24.3.8.2. Product Portfolio

            24.3.8.3. Production Footprint

            24.3.8.4. Sales Footprint

            24.3.8.5. Channel Footprint

            24.3.8.6. Strategy

                24.3.8.6.1. Marketing Strategy

                24.3.8.6.2. Product Strategy

                24.3.8.6.3. Channel Strategy

        24.3.9. Hy-Lok USA, Inc

            24.3.9.1. Overview

            24.3.9.2. Product Portfolio

            24.3.9.3. Production Footprint

            24.3.9.4. Sales Footprint

            24.3.9.5. Channel Footprint

            24.3.9.6. Strategy

                24.3.9.6.1. Marketing Strategy

                24.3.9.6.2. Product Strategy

                24.3.9.6.3. Channel Strategy

        24.3.10. ICARUS SA

            24.3.10.1. Overview

            24.3.10.2. Product Portfolio

            24.3.10.3. Production Footprint

            24.3.10.4. Sales Footprint

            24.3.10.5. Channel Footprint

            24.3.10.6. Strategy

                24.3.10.6.1. Marketing Strategy

                24.3.10.6.2. Product Strategy

                24.3.10.6.3. Channel Strategy

        24.3.11. JVS Engineers

            24.3.11.1. Overview

            24.3.11.2. Product Portfolio

            24.3.11.3. Production Footprint

            24.3.11.4. Sales Footprint

            24.3.11.5. Channel Footprint

            24.3.11.6. Strategy

                24.3.11.6.1. Marketing Strategy

                24.3.11.6.2. Product Strategy

                24.3.11.6.3. Channel Strategy

        24.3.12. KINGSA Industries

            24.3.12.1. Overview

            24.3.12.2. Product Portfolio

            24.3.12.3. Production Footprint

            24.3.12.4. Sales Footprint

            24.3.12.5. Channel Footprint

            24.3.12.6. Strategy

                24.3.12.6.1. Marketing Strategy

                24.3.12.6.2. Product Strategy

                24.3.12.6.3. Channel Strategy

        24.3.13. Probe Oil Tools 

            24.3.13.1. Overview

            24.3.13.2. Product Portfolio

            24.3.13.3. Production Footprint

            24.3.13.4. Sales Footprint

            24.3.13.5. Channel Footprint

            24.3.13.6. Strategy

                24.3.13.6.1. Marketing Strategy

                24.3.13.6.2. Product Strategy

                24.3.13.6.3. Channel Strategy

        24.3.14. PSL Pipe & Fittings Co.

            24.3.14.1. Overview

            24.3.14.2. Product Portfolio

            24.3.14.3. Production Footprint

            24.3.14.4. Sales Footprint

            24.3.14.5. Channel Footprint

            24.3.14.6. Strategy

                24.3.14.6.1. Marketing Strategy

                24.3.14.6.2. Product Strategy

                24.3.14.6.3. Channel Strategy

        24.3.15. PT. Bima Drilling Tools

            24.3.15.1. Overview

            24.3.15.2. Product Portfolio

            24.3.15.3. Production Footprint

            24.3.15.4. Sales Footprint

            24.3.15.5. Channel Footprint

            24.3.15.6. Strategy

                24.3.15.6.1. Marketing Strategy

                24.3.15.6.2. Product Strategy

                24.3.15.6.3. Channel Strategy

        24.3.16. Sara Sae 

            24.3.16.1. Overview

            24.3.16.2. Product Portfolio

            24.3.16.3. Production Footprint

            24.3.16.4. Sales Footprint

            24.3.16.5. Channel Footprint

            24.3.16.6. Strategy

                24.3.16.6.1. Marketing Strategy

                24.3.16.6.2. Product Strategy

                24.3.16.6.3. Channel Strategy

        24.3.17. The Weir Group PLC

            24.3.17.1. Overview

            24.3.17.2. Product Portfolio

            24.3.17.3. Production Footprint

            24.3.17.4. Sales Footprint

            24.3.17.5. Channel Footprint

            24.3.17.6. Strategy

                24.3.17.6.1. Marketing Strategy

                24.3.17.6.2. Product Strategy

                24.3.17.6.3. Channel Strategy

        24.3.18. Woodco USA 

            24.3.18.1. Overview

            24.3.18.2. Product Portfolio

            24.3.18.3. Production Footprint

            24.3.18.4. Sales Footprint

            24.3.18.5. Channel Footprint

            24.3.18.6. Strategy

                24.3.18.6.1. Marketing Strategy

                24.3.18.6.2. Product Strategy

                24.3.18.6.3. Channel Strategy

        24.3.19. Yingkou Haitai Metal and Pipe Fittings Co. Ltd.

            24.3.19.1. Overview

            24.3.19.2. Product Portfolio

            24.3.19.3. Production Footprint

            24.3.19.4. Sales Footprint

            24.3.19.5. Channel Footprint

            24.3.19.6. Strategy

                24.3.19.6.1. Marketing Strategy

                24.3.19.6.2. Product Strategy

                24.3.19.6.3. Channel Strategy

25. Research Methodology

26. Assumption & Acronyms
Recommendations

Industrial Automation

Oil & Gas Terminal Automation Market

November 2016

REP-GB-197

July 2023

324 pages

Industrial Automation

Oil and Gas Fittings Market

January 2022

REP-GB-10466

July 2022

364 pages

Explore Industrial Automation Insights

View Reports
Future Market Insights

Oil and Gas Fittings Market