Reports

- Global Locations -

Headquarters

Future Market Insights, Inc.

Christiana Corporate, 200
Continental Drive, Suite 401,
Newark, Delaware - 19713,
United States

T: +1-845-579-5705

Americas

Future Market Insights, Inc.

616 Corporate Way, Suite 2-9018,
Valley Cottage, NY 10989, United States

T: +1-347-918-3531

MEA

Future Market Insights

1602-6 Jumeirah Bay X2 Tower, Plot No: JLT-PH2-X2A,
Jumeirah Lakes Towers, Dubai,
United Arab Emirates

Europe

Future Market Insights

3rd Floor, 207 Regent Street,
W1B 3HH London
United Kingdom

T: + 44 (0) 20 8123 9659
D: +44 (0) 20 3287 4268

Asia Pacific

Future Market Insights

IndiaLand Global Tech Park, Unit UG-1, Behind Grand HighStreet, Phase 1, Hinjawadi, MH, Pune – 411057, India

Oil Mill Machine Market Outlook (2023 to 2033)

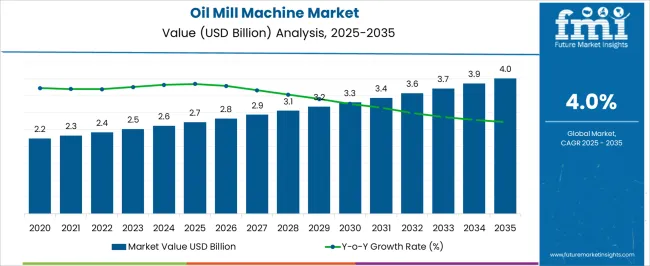
During the projected period (2023 to 2033), the global oil mill machine market is expected to grow at a CAGR of 4.0%. The market is estimated to surpass US$ 3,716.7 Million by the end of 2033 from a valuation of US$ 2,510.8 Million in 2023.

An oil mill machine is used to extract oil from various seeds, nuts, and beans. There are various types of oil mill machines available on the market. Each type has its own set of pros and cons. The most common type of oil mill machine is the expeller press. This type of machine is easy to use and can be operated by one person. The expeller press is also one of the most affordable types of oil mill machines.

Another popular type of oil mill machine is the screw press. This type of machine is more expensive than the expeller press owing to its higher efficiency. The screw press can be used to extract large amounts of oil from a variety of seeds and nuts. A hydraulic press is another type of commonly used oil mill machine, which is very expensive.

Increasing demand for edible oils and biodiesel is driving growth in the oil mill machine market. Rising awareness about health and fitness is also fueling the demand for healthy oils, which is expected to boost growth in the market.

Some of the major factors driving growth in the market are increasing demand for edible oils and surging awareness about the health benefits of consuming vegetable oils. Oil mill machines are extensively used to extract oil from various oilseeds such as soybean, rapeseed, sunflower seed, palm kernel, cottonseed, and others, which would aid growth.

Rising demand for cold pressed oils among various end-use industries such as animal food, food & beverages, and personal care is anticipated to drive the global market. Improved flavor and high nutritional value of cold-pressed oils would also help to augment the market.

Cold press abstraction is considered to be one of the unique procedures of mechanical extraction. Compared to the other oil extraction methods, it requires minimum energy. Cold-pressed oil also contains zero trans-fatty acids and is cholesterol-free. Hence, their demand is projected to increase in the next ten years, thereby pushing the need for oil mill machines.

Various key companies are also coming up with organic and preservative-free oil to keep up with the surging demand from health-conscious consumers. In October 2022, for instance, Emami Agrotech Ltd., an edible oil and biodiesel arm of Emami Business located in Kolkata, relaunched its popular range of edible oil brands in India named Healthy Tasty.

Emami Healthy Tasty unveiled a packaging makeover across 4 variants, namely, rice bran, sunflower, soybean, and mustard. The new packaging is set to portray premium imagery, as well as communicate the company’s naturally skewed identity.

Attributes Key Insights
Oil Mill Machine Market Estimated Size (2023E) US$ 2,510.8 Million
Projected Market Valuation (2033F) US$ 3,716.7 Million
Value-based CAGR (2023 to 2033) 4.0%
Market Share of the USA 32.7%

Don't pay for what you don't need

Customize your report by selecting specific countries or regions and save 30%!

2018 to 2022 Global Oil Mill Machine Market Outlook Compared to 2023 to 2033 Demand Forecast

The global oil mill machine market is expected to grow at a CAGR of around 4.0% during the forecast period from 2023 to 2033. As per FMI, the market showcased steady growth at a CAGR of 2.2% during the historical period of 2018 to 2022.

The increasing need for biodiesel to replace conventional fossil fuels in automotive and power generation applications is one of the major factors pushing sales of oil mill machines. Biodiesel is nowadays being preferred by automakers as it emits less greenhouse gas.

As per the USA Environmental Protection Agency (EPA), in 2010, industries generated around 21% of global greenhouse gas emissions. It mainly involved fossil fuels burned on-site at various facilities for energy. The sector also included emissions from mineral, metallurgical, and chemical transformation processes, which are not related to emissions from waste management activities or energy consumption.

Oil mill machines are also expected to be extensively used in the marine industry with the rising demand for biodiesel. As biodiesel is non-toxic, biodegradable, and free of sulfur & aromatics, it is projected to be demanded by the marine industry.

Oil Mill Machine Market

Market-o-nomics - Highlighting the Key Trends

A number of influential factors have been identified to stir the soup in the oil mill machine market. Apart from the proliferating aspects prevailing in the market, analysts at FMI have analyzed the restraining elements, lucrative opportunities, and upcoming threats that can pose a challenge to the progression of the global market.

The drivers, restraints, opportunities, and threats (DROTs) identified are as follows:

DRIVERS

  • An increasing number of people eating homemade food is set to push the adoption of edible oil per capita in the forecast period.
  • Rising demand for oils from restaurants, households, and small food chains owing to the high need for processed food items would drive the market.

RESTRAINTS

  • Adulteration of expensive and popular oil with cost-effective oil is becoming high, which is a potential threat to human health.
  • Rapidly changing codex standards for oils to enhance their usefulness in addressing authenticity problems may hamper growth.

OPPORTUNITIES

  • Plant geneticists and scientists are expected to find ways to surge production from oilseed crops to address issues of sustainability and land use.
  • Companies are set to develop fortified oils to help people meet their recommended dietary intake for vitamins D and A.

THREATS

  • Cooking oils like rapeseed oil over frying oils have high levels of fatty acids that can lead to obesity.
  • Soybean oil can negatively affect one’s digestive system if consumed in excessive quantities.
Nandini Roy Choudhury

Principal Consultant

Talk to Analyst

Find your sweet spots for generating winning opportunities in this market.

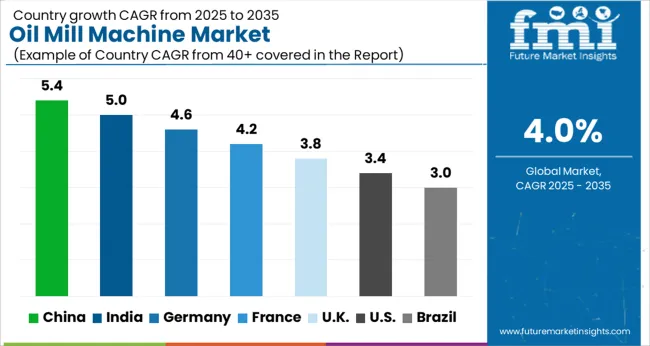
Country-wise Insights

How are Oil Mill Machines Manufacturers Progressing in the USA?

Development of Tight Oil Resources in the USA to Spur Sales of Oil Manufacturing Machines

Oil production in the USA is expected to grow significantly in the next ten years fueled by rising demand from the transportation and petrochemical industries. The USA is projected to lead North America, followed by Canada and Mexico. A large number of projects have been planned or are underway across the country, which will further boost demand.

As per the Center for Strategic & International Studies, the development of abundant unconventional natural gas and tight oil resources would create a historic opportunity to improve economic growth across North America. This will further help to enhance the region’s competitiveness in global markets. This factor is projected to foster sales of oil mill machines in the USA during the assessment period.

Why is Germany Showcasing Exponential Demand for Oil Mill Machines?

Production of Highly Durable Oil Extraction Machines in Germany to Aid Sales by 2033

Germany is considered to be the largest producer of oil mill machines in Europe. It has been dominant across the Europe market since the historical period. Various Germany-based companies are constantly producing highly durable and efficient oil mill machines that are set to be utilized by numerous countries across Europe.

The German government also provides financial support to companies that produce oil mill machines, which helps to keep their prices down. Germany is also a major exporter of oil mill machines, with most of its exports going to other European countries.

Why is China Considered to be an Emerging Hub for Oil Mill Machine Manufacturers?

International Firms to Set Up their Oil Grinding Machine Manufacturing Facilities in China

China is considered to be a key oil mill machine producer across the Asia Pacific, says FMI. The country has a vast aging population and an increasingly affluent middle-class population. It is also rich in terms of raw materials, including oil, which is essential for industrial growth.

China is therefore set to be an attractive market for oil mill manufacturers. The easy availability of raw materials and low cost of labor in China is compelling international oil mill machine manufacturers to develop their manufacturing facilities in the country.

Category-wise Insights

Which is the Most Preferred Type of Oil Mill Machine across the Globe?

Demand for Sunflower Oil Milling Machines to Surge among Vegan Food Manufacturers

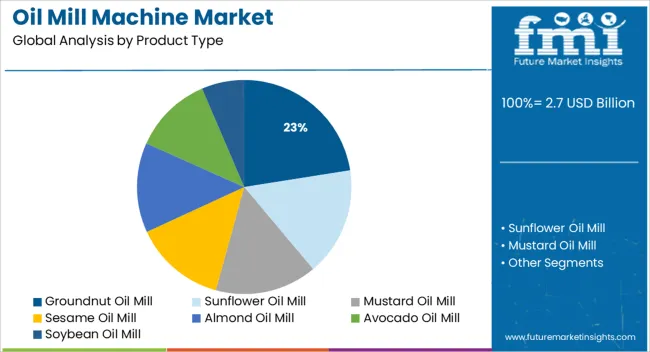
Based on product type, the sunflower oil mill segment is anticipated to remain at the forefront in the next ten years. Increasing consumption of healthy cooking oil and frying oil among food manufacturing companies, as well as households is set to drive the segment. Besides, the rising use of sunflower oil to make vegan spreads, cheese, and mayonnaise would push sales of oil mill machines.

In October 2022, for instance, Ambrosia Organic Farm, which is India’s first organic firm, introduced the world’s first flavored peanut butter. It is available in two distinct flavors, namely, mango and blueberry. The company has more than 50 organic products, including sunflower oil, wild honey, rice cakes, and peanut oil. Thus, the launch of similar unique products infused with sunflower oil by key companies would propel sales of oil mill machines.

Get the data you need at a Fraction of the cost

Personalize your report by choosing insights you need
and save 40%!

Competitive Landscape

Some of the key players in the global market are United Engineering Eastern Ration LLP, Andavar Lathe Works, AGI Mill Tec, Devi Industries, Confider, Fowler Westrup, Kumar Metal Industries, Lakshmi Machineries, and SS Engineering Works among others.

The majority of the key companies are investing huge sums in research & development activities to come up with technologically advanced oil mill machines. A few other players are focusing on collaborations, joint ventures, and acquisitions of local companies to expand their product portfolios, as well as their geographic presence worldwide.

One of the leading companies providing oil mill machines include:

  • Goyum Group is a renowned project engineering company, which is currently a famous name in the field of edible and non-edible oil processing. It has an advanced manufacturing facility spread over 27,000 sqm covering production areas for packaging, painting, assembly, and welding. It is a well-known manufacturer and exporter of fully automatic mustard oil mills.

Scope of the Oil Mill Machine Market Report

Attribute Details
Estimated Market Size (2023) US$ 2,510.8 Million
Projected Market Valuation (2033) US$ 3,716.7 Million
Value-based CAGR (2023 to 2033) 4.0%
Forecast Period 2023 to 2033
Historical Data Available for 2018 to 2022
Market Analysis Value (US$ Million)
Key Regions Covered
  • North America
  • Latin America
  • Europe
  • Asia Pacific
  • Oceania
  • Middle East and Africa (MEA)
Key Countries Covered
  • USA
  • Canada
  • Mexico
  • Germany
  • UK
  • France
  • Italy
  • Spain
  • China
  • Japan
  • India
  • South Korea
  • Australia
  • Brazil
  • Argentina
  • South Africa
  • UAE
Key Segments Covered
  • Product Type
  • Application
  • Mode of Operation
  • Region
Key Companies Profiled
  • United Engineering Eastern Ration LLP
  • Andavar Lathe Works
  • AGI Milltec
  • Devi industries
  • Confider
  • Fowler Westrup
  • Kumar Metal Industries
  • Lakshmi Machineries
  • SS Engineering Works
Report Coverage Market Forecast, Company Share Analysis, Competitive Landscape, Drivers, Restraints, Opportunities and Threats Analysis, Market Dynamics and Challenges, and Strategic Growth Initiatives

Oil Mill Machine Market Outlook by Category

By Product Type:

  • Groundnut Oil Mill
  • Sunflower Oil Mill
  • Mustard Oil Mill
  • Sesame Oil Mill
  • Almond Oil Mill
  • Avocado Oil Mill
  • Soybean Oil Mill

By Application:

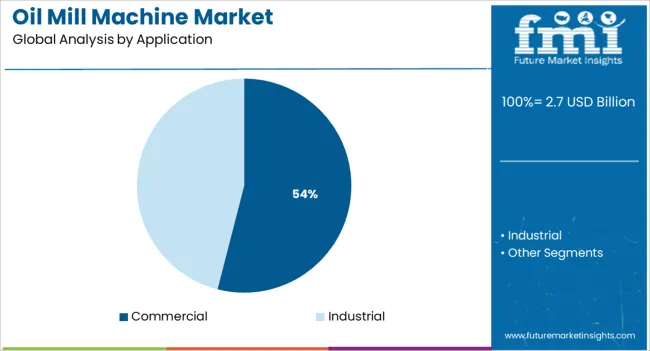
  • Commercial
  • Industrial

By Mode of Operation:

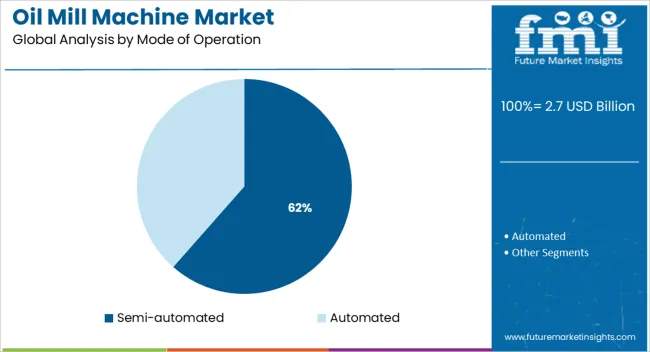
  • Semi-automated
  • Automated

By Region:

  • North America
  • Latin America
  • Europe
  • East Asia
  • South Asia
  • Oceania
  • Middle East and Africa (MEA)

Frequently Asked Questions

How big is the global oil mill machine market?

The oil mill machine market size is estimated to be worth US$ 2,510.8 Million by the end of 2023.

At what rate is the oil mill machine market expected to rise in the next ten years?

The oil mill machine market is expected to rise at a CAGR of 4.0% in the next ten years.

What is the North America oil mill machine market outlook?

The North America oil mill machine market is expected to register an 38% CAGR between 2023 and 2033.

Which are the major countries driving demand for oil mill machines?

The USA, China, Canada, Germany, and Mexico are the major countries driving demand for oil mill machines.

At what rate will the China oil mill machine market grow?

The China oil mill machine market is projected to grow at a CAGR of 5.7% in the forecast period.

At what rate will the UK oil mill machine market grow?

The UK oil mill machine market is estimated to grow at a CAGR of 5.3% in the evaluation period.

At what rate will the demand for oil mill machines surge in India?

The India oil mill machine market is expected to grow at a CAGR of 6.3% in the assessment period.

At what rate will the demand for oil mill machines grow in the USA?

The demand for oil mill machines in Europe is expected to grow at 32.7% CAGR in 2023.

At what rate will the need for oil mill machines grow in Japan?

The demand for oil mill machines in Japan is expected to grow at 8.0% in 2023.

At what rate will the demand for oil mill machines grow in Australia?

The demand for oil mill machines in Australia is expected to grow at 2.7% in 2023.

What is the demand outlook forecast for the oil mill machine market?

The global oil mill machine market is set to surpass US$ 3,716.7 Million by the end of 2033.

Table of Content

1. Executive Summary | Oil Mill Machine Market

    1.1. Global Market Outlook

    1.2. Demand-side Trends

    1.3. Supply-side Trends

    1.4. Technology Roadmap Analysis

    1.5. Analysis and Recommendations

2. Market Overview

    2.1. Market Coverage / Taxonomy

    2.2. Market Definition / Scope / Limitations

3. Market Background

    3.1. Market Dynamics

        3.1.1. Drivers

        3.1.2. Restraints

        3.1.3. Opportunity

        3.1.4. Trends

    3.2. Scenario Forecast

        3.2.1. Demand in Optimistic Scenario

        3.2.2. Demand in Likely Scenario

        3.2.3. Demand in Conservative Scenario

    3.3. Product launches & Recent Developments

    3.4. Product Life Cycle Analysis

    3.5. Value Chain Analysis

        3.5.1. Supply Side Participants and their Roles

            3.5.1.1. Producers

            3.5.1.2. Mid-Level Participants (Traders/ Agents/ Brokers)

            3.5.1.3. Wholesalers and Distributors

        3.5.2. % of Operating Margin Analysis

        3.5.3. List of Raw Material Suppliers

        3.5.4. List of Existing and Potential Buyers

    3.6. Global Market - Pricing Analysis

        3.6.1. Price Point Assessment by Region

        3.6.2. Price Point Assessment by Product Type

        3.6.3. Price Forecast till 2033

        3.6.4. Factors affecting pricing

    3.7. Forecast Factors - Relevance & Impact

    3.8. PESTLE and Porter’s Analysis

    3.9. Regulatory Landscape

        3.9.1. Packaging & Labelling Regulations

        3.9.2. Certifications and Certifying Agency Overview

        3.9.3. Import/Export Policies

    3.10. Regional Parent Market Outlook

    3.11. Production and Consumption Statistics

    3.12. Import and Export Statistics

    3.13. Consumers Survey Analysis

    3.14. Macro-Economic Factors

    3.15. Product Claims & Nutritional Information scanned by Buyers

4. Global Market Analysis 2018 to 2022 and Forecast, 2023 to 2033

    4.1. Historical Market Size Value (US$ Million) & Volume (MT) Analysis, 2018 to 2022

    4.2. Current and Future Market Size Value (US$ Million) & Volume (MT) Projections, 2023 to 2033

        4.2.1. Y-o-Y Growth Trend Analysis

        4.2.2. Absolute $ Opportunity Analysis

5. Global Market Analysis 2018 to 2022 and Forecast 2023 to 2033, By Product Type

    5.1. Introduction / Key Findings

    5.2. Historical Market Size Value (US$ Million) & Volume (MT) Analysis By Product Type, 2018 to 2022

    5.3. Current and Future Market Size Value (US$ Million) & Volume (MT) Analysis and Forecast By Product Type, 2023 to 2033

        5.3.1. Groundnut Oil Mill

        5.3.2. Sunflower Oil Mill

        5.3.3. Mustard Oil Mill

        5.3.4. Sesame Oil Mill

        5.3.5. Almond Oil Mill

        5.3.6. Avocado Oil Mill

        5.3.7. Soybean Oil Mill

    5.4. Y-o-Y Growth Trend Analysis By Product Type, 2018 to 2022

    5.5. Absolute $ Opportunity Analysis By Product Type, 2023 to 2033

6. Global Market Analysis 2018 to 2022 and Forecast 2023 to 2033, By Application

    6.1. Introduction / Key Findings

    6.2. Historical Market Size Value (US$ Million) & Volume (MT) Analysis By Application, 2018 to 2022

    6.3. Current and Future Market Size Value (US$ Million) & Volume (MT) Analysis and Forecast By Application, 2023 to 2033

        6.3.1. Commercial

        6.3.2. Industrial

    6.4. Y-o-Y Growth Trend Analysis By Application, 2018 to 2022

    6.5. Absolute $ Opportunity Analysis By Application, 2023 to 2033

7. Global Market Analysis 2018 to 2022 and Forecast 2023 to 2033, By Mode of Operation

    7.1. Introduction / Key Findings

    7.2. Historical Market Size Value (US$ Million) & Volume (MT) Analysis By Mode of operation, 2018 to 2022

    7.3. Current and Future Market Size Value (US$ Million) & Volume (MT) Analysis and Forecast By Mode of operation, 2023 to 2033

        7.3.1. Semi-automated

        7.3.2. Automated

    7.4. Y-o-Y Growth Trend Analysis By Mode of operation, 2018 to 2022

    7.5. Absolute $ Opportunity Analysis By Mode of operation, 2023 to 2033

8. Global Market Analysis 2018 to 2022 and Forecast 2023 to 2033, By Region

    8.1. Introduction

    8.2. Historical Market Size Value (US$ Million) & Volume (MT) Analysis By Region, 2018 to 2022

    8.3. Current Market Size Value (US$ Million) & Volume (MT) Analysis and Forecast By Region, 2023 to 2033

        8.3.1. North America

        8.3.2. Latin America

        8.3.3. Europe

        8.3.4. East Asia

        8.3.5. South Asia

        8.3.6. Oceania

        8.3.7. Middle East and Africa (MEA)

    8.4. Market Attractiveness Analysis By Region

9. North America Market Analysis 2018 to 2022 and Forecast 2023 to 2033, By Country

    9.1. Historical Market Size Value (US$ Million) & Volume (MT) Trend Analysis By Market Taxonomy, 2018 to 2022

    9.2. Market Size Value (US$ Million) & Volume (MT) Forecast By Market Taxonomy, 2023 to 2033

        9.2.1. By Country

            9.2.1.1. United States of America

            9.2.1.2. Canada

        9.2.2. By Product Type

        9.2.3. By Application

        9.2.4. By Mode of operation

    9.3. Market Attractiveness Analysis

        9.3.1. By Country

        9.3.2. By Product Type

        9.3.3. By Application

        9.3.4. By Mode of operation

    9.4. Key Takeaways

10. Latin America Market Analysis 2018 to 2022 and Forecast 2023 to 2033, By Country

    10.1. Historical Market Size Value (US$ Million) & Volume (MT) Trend Analysis By Market Taxonomy, 2018 to 2022

    10.2. Market Size Value (US$ Million) & Volume (MT) Forecast By Market Taxonomy, 2023 to 2033

        10.2.1. By Country

            10.2.1.1. Brazil

            10.2.1.2. Mexico

            10.2.1.3. Argentina

            10.2.1.4. Chile

            10.2.1.5. Peru

            10.2.1.6. Rest of Latin America

        10.2.2. By Product Type

        10.2.3. By Application

        10.2.4. By Mode of operation

    10.3. Market Attractiveness Analysis

        10.3.1. By Country

        10.3.2. By Product Type

        10.3.3. By Application

        10.3.4. By Mode of operation

    10.4. Key Takeaways

11. Europe Market Analysis 2018 to 2022 and Forecast 2023 to 2033, By Country

    11.1. Historical Market Size Value (US$ Million) & Volume (MT) Trend Analysis By Market Taxonomy, 2018 to 2022

    11.2. Market Size Value (US$ Million) & Volume (MT) Forecast By Market Taxonomy, 2023 to 2033

        11.2.1. By Country

            11.2.1.1. Germany

            11.2.1.2. Italy

            11.2.1.3. France

            11.2.1.4. United Kingdom

            11.2.1.5. Spain

            11.2.1.6. Russia

            11.2.1.7. BENELUX

            11.2.1.8. Poland

            11.2.1.9. Nordic Countries

            11.2.1.10. Rest of Europe

        11.2.2. By Product Type

        11.2.3. By Application

        11.2.4. By Mode of operation

    11.3. Market Attractiveness Analysis

        11.3.1. By Country

        11.3.2. By Product Type

        11.3.3. By Application

        11.3.4. By Mode of operation

    11.4. Key Takeaways

12. East Asia Market Analysis 2018 to 2022 and Forecast 2023 to 2033, By Country

    12.1. Historical Market Size Value (US$ Million) & Volume (MT) Trend Analysis By Market Taxonomy, 2018 to 2022

    12.2. Market Size Value (US$ Million) & Volume (MT) Forecast By Market Taxonomy, 2023 to 2033

        12.2.1. By Country

            12.2.1.1. China

            12.2.1.2. Japan

            12.2.1.3. South Korea

        12.2.2. By Product Type

        12.2.3. By Application

        12.2.4. By Mode of operation

    12.3. Market Attractiveness Analysis

        12.3.1. By Country

        12.3.2. By Product Type

        12.3.3. By Application

        12.3.4. By Mode of operation

    12.4. Key Takeaways

13. South Asia Market Analysis 2018 to 2022 and Forecast 2023 to 2033, By Country

    13.1. Historical Market Size Value (US$ Million) & Volume (MT) Trend Analysis By Market Taxonomy, 2018 to 2022

    13.2. Market Size Value (US$ Million) & Volume (MT) Forecast By Market Taxonomy, 2023 to 2033

        13.2.1. By Country

            13.2.1.1. India

            13.2.1.2. Thailand

            13.2.1.3. Malaysia

            13.2.1.4. Indonesia

            13.2.1.5. Singapore

            13.2.1.6. Rest of South Asia

        13.2.2. By Product Type

        13.2.3. By Application

        13.2.4. By Mode of operation

    13.3. Market Attractiveness Analysis

        13.3.1. By Country

        13.3.2. By Product Type

        13.3.3. By Application

        13.3.4. By Mode of operation

    13.4. Key Takeaways

14. Oceania Market Analysis 2018 to 2022 and Forecast 2023 to 2033, By Country

    14.1. Historical Market Size Value (US$ Million) & Volume (MT) Trend Analysis By Market Taxonomy, 2018 to 2022

    14.2. Market Size Value (US$ Million) & Volume (MT) Forecast By Market Taxonomy, 2023 to 2033

        14.2.1. By Country

            14.2.1.1. Australia

            14.2.1.2. New Zealand

        14.2.2. By Product Type

        14.2.3. By Application

        14.2.4. By Mode of operation

    14.3. Market Attractiveness Analysis

        14.3.1. By Country

        14.3.2. By Product Type

        14.3.3. By Application

        14.3.4. By Mode of operation

    14.4. Key Takeaways

15. MEA Market Analysis 2018 to 2022 and Forecast 2023 to 2033, By Country

    15.1. Historical Market Size Value (US$ Million) & Volume (MT) Trend Analysis By Market Taxonomy, 2018 to 2022

    15.2. Market Size Value (US$ Million) & Volume (MT) Forecast By Market Taxonomy, 2023 to 2033

        15.2.1. By Country

            15.2.1.1. GCC Countries

            15.2.1.2. South Africa

            15.2.1.3. Central Africa

            15.2.1.4. North Africa

        15.2.2. By Product Type

        15.2.3. By Application

        15.2.4. By Mode of operation

    15.3. Market Attractiveness Analysis

        15.3.1. By Country

        15.3.2. By Product Type

        15.3.3. By Application

        15.3.4. By Mode of operation

    15.4. Key Takeaways

16. Key Countries Market Analysis

    16.1. United States of America

        16.1.1. Pricing Analysis

        16.1.2. Market Share Analysis, 2022

            16.1.2.1. By Product Type

            16.1.2.2. By Application

            16.1.2.3. By Mode of operation

    16.2. Canada

        16.2.1. Pricing Analysis

        16.2.2. Market Share Analysis, 2022

            16.2.2.1. By Product Type

            16.2.2.2. By Application

            16.2.2.3. By Mode of operation

    16.3. Brazil

        16.3.1. Pricing Analysis

        16.3.2. Market Share Analysis, 2022

            16.3.2.1. By Product Type

            16.3.2.2. By Application

            16.3.2.3. By Mode of operation

    16.4. Mexico

        16.4.1. Pricing Analysis

        16.4.2. Market Share Analysis, 2022

            16.4.2.1. By Product Type

            16.4.2.2. By Application

            16.4.2.3. By Mode of operation

    16.5. Argentina

        16.5.1. Pricing Analysis

        16.5.2. Market Share Analysis, 2022

            16.5.2.1. By Product Type

            16.5.2.2. By Application

            16.5.2.3. By Mode of operation

    16.6. Chile

        16.6.1. Pricing Analysis

        16.6.2. Market Share Analysis, 2022

            16.6.2.1. By Product Type

            16.6.2.2. By Application

            16.6.2.3. By Mode of operation

    16.7. Peru

        16.7.1. Pricing Analysis

        16.7.2. Market Share Analysis, 2022

            16.7.2.1. By Product Type

            16.7.2.2. By Application

            16.7.2.3. By Mode of operation

    16.8. Germany

        16.8.1. Pricing Analysis

        16.8.2. Market Share Analysis, 2022

            16.8.2.1. By Product Type

            16.8.2.2. By Application

            16.8.2.3. By Mode of operation

    16.9. Italy

        16.9.1. Pricing Analysis

        16.9.2. Market Share Analysis, 2022

            16.9.2.1. By Product Type

            16.9.2.2. By Application

            16.9.2.3. By Mode of operation

    16.10. France

        16.10.1. Pricing Analysis

        16.10.2. Market Share Analysis, 2022

            16.10.2.1. By Product Type

            16.10.2.2. By Application

            16.10.2.3. By Mode of operation

    16.11. Spain

        16.11.1. Pricing Analysis

        16.11.2. Market Share Analysis, 2022

            16.11.2.1. By Product Type

            16.11.2.2. By Application

            16.11.2.3. By Mode of operation

    16.12. United Kingdom

        16.12.1. Pricing Analysis

        16.12.2. Market Share Analysis, 2022

            16.12.2.1. By Product Type

            16.12.2.2. By Application

            16.12.2.3. By Mode of operation

    16.13. Russia

        16.13.1. Pricing Analysis

        16.13.2. Market Share Analysis, 2022

            16.13.2.1. By Product Type

            16.13.2.2. By Application

            16.13.2.3. By Mode of operation

    16.14. Poland

        16.14.1. Pricing Analysis

        16.14.2. Market Share Analysis, 2022

            16.14.2.1. By Product Type

            16.14.2.2. By Application

            16.14.2.3. By Mode of operation

    16.15. BENELUX

        16.15.1. Pricing Analysis

        16.15.2. Market Share Analysis, 2022

            16.15.2.1. By Product Type

            16.15.2.2. By Application

            16.15.2.3. By Mode of operation

    16.16. Nordic Countries

        16.16.1. Pricing Analysis

        16.16.2. Market Share Analysis, 2022

            16.16.2.1. By Product Type

            16.16.2.2. By Application

            16.16.2.3. By Mode of operation

    16.17. China

        16.17.1. Pricing Analysis

        16.17.2. Market Share Analysis, 2022

            16.17.2.1. By Product Type

            16.17.2.2. By Application

            16.17.2.3. By Mode of operation

    16.18. Japan

        16.18.1. Pricing Analysis

        16.18.2. Market Share Analysis, 2022

            16.18.2.1. By Product Type

            16.18.2.2. By Application

            16.18.2.3. By Mode of operation

    16.19. South Korea

        16.19.1. Pricing Analysis

        16.19.2. Market Share Analysis, 2022

            16.19.2.1. By Product Type

            16.19.2.2. By Application

            16.19.2.3. By Mode of operation

    16.20. India

        16.20.1. Pricing Analysis

        16.20.2. Market Share Analysis, 2022

            16.20.2.1. By Product Type

            16.20.2.2. By Application

            16.20.2.3. By Mode of operation

    16.21. Thailand

        16.21.1. Pricing Analysis

        16.21.2. Market Share Analysis, 2022

            16.21.2.1. By Product Type

            16.21.2.2. By Application

            16.21.2.3. By Mode of operation

    16.22. Indonesia

        16.22.1. Pricing Analysis

        16.22.2. Market Share Analysis, 2022

            16.22.2.1. By Product Type

            16.22.2.2. By Application

            16.22.2.3. By Mode of operation

    16.23. Malaysia

        16.23.1. Pricing Analysis

        16.23.2. Market Share Analysis, 2022

            16.23.2.1. By Product Type

            16.23.2.2. By Application

            16.23.2.3. By Mode of operation

    16.24. Singapore

        16.24.1. Pricing Analysis

        16.24.2. Market Share Analysis, 2022

            16.24.2.1. By Product Type

            16.24.2.2. By Application

            16.24.2.3. By Mode of operation

    16.25. Australia

        16.25.1. Pricing Analysis

        16.25.2. Market Share Analysis, 2022

            16.25.2.1. By Product Type

            16.25.2.2. By Application

            16.25.2.3. By Mode of operation

    16.26. New Zealand

        16.26.1. Pricing Analysis

        16.26.2. Market Share Analysis, 2022

            16.26.2.1. By Product Type

            16.26.2.2. By Application

            16.26.2.3. By Mode of operation

    16.27. GCC Countries

        16.27.1. Pricing Analysis

        16.27.2. Market Share Analysis, 2022

            16.27.2.1. By Product Type

            16.27.2.2. By Application

            16.27.2.3. By Mode of operation

    16.28. South Africa

        16.28.1. Pricing Analysis

        16.28.2. Market Share Analysis, 2022

            16.28.2.1. By Product Type

            16.28.2.2. By Application

            16.28.2.3. By Mode of operation

    16.29. North Africa

        16.29.1. Pricing Analysis

        16.29.2. Market Share Analysis, 2022

            16.29.2.1. By Product Type

            16.29.2.2. By Application

            16.29.2.3. By Mode of operation

    16.30. Central Africa

        16.30.1. Pricing Analysis

        16.30.2. Market Share Analysis, 2022

            16.30.2.1. By Product Type

            16.30.2.2. By Application

            16.30.2.3. By Mode of operation

17. Market Structure Analysis

    17.1. Competition Dashboard

    17.2. Competition Benchmarking

    17.3. Market Share Analysis of Top Players

        17.3.1. By Regional

        17.3.2. By Product Type

        17.3.3. By Application

        17.3.4. By Mode of operation

18. Competition Analysis

    18.1. Competition Deep Dive

        18.1.1. Value (US$ Million) & Volume (MT)ed Engineering Eastern ration LLP

            18.1.1.1. Overview

            18.1.1.2. Product Portfolio

            18.1.1.3. Profitability by Market Segments (Product/Age /Sales Channel/Region)

            18.1.1.4. Sales Footprint

            18.1.1.5. Strategy Overview

                18.1.1.5.1. Marketing Strategy

                18.1.1.5.2. Product Strategy

                18.1.1.5.3. Channel Strategy

        18.1.2. Andavar lathe works

            18.1.2.1. Overview

            18.1.2.2. Product Portfolio

            18.1.2.3. Profitability by Market Segments (Product/Age /Sales Channel/Region)

            18.1.2.4. Sales Footprint

            18.1.2.5. Strategy Overview

                18.1.2.5.1. Marketing Strategy

                18.1.2.5.2. Product Strategy

                18.1.2.5.3. Channel Strategy

        18.1.3. AGI Milltec

            18.1.3.1. Overview

            18.1.3.2. Product Portfolio

            18.1.3.3. Profitability by Market Segments (Product/Age /Sales Channel/Region)

            18.1.3.4. Sales Footprint

            18.1.3.5. Strategy Overview

                18.1.3.5.1. Marketing Strategy

                18.1.3.5.2. Product Strategy

                18.1.3.5.3. Channel Strategy

        18.1.4. Devi industries 

            18.1.4.1. Overview

            18.1.4.2. Product Portfolio

            18.1.4.3. Profitability by Market Segments (Product/Age /Sales Channel/Region)

            18.1.4.4. Sales Footprint

            18.1.4.5. Strategy Overview

                18.1.4.5.1. Marketing Strategy

                18.1.4.5.2. Product Strategy

                18.1.4.5.3. Channel Strategy

        18.1.5. Confider

            18.1.5.1. Overview

            18.1.5.2. Product Portfolio

            18.1.5.3. Profitability by Market Segments (Product/Age /Sales Channel/Region)

            18.1.5.4. Sales Footprint

            18.1.5.5. Strategy Overview

                18.1.5.5.1. Marketing Strategy

                18.1.5.5.2. Product Strategy

                18.1.5.5.3. Channel Strategy

        18.1.6. Fowler Westrup

            18.1.6.1. Overview

            18.1.6.2. Product Portfolio

            18.1.6.3. Profitability by Market Segments (Product/Age /Sales Channel/Region)

            18.1.6.4. Sales Footprint

            18.1.6.5. Strategy Overview

                18.1.6.5.1. Marketing Strategy

                18.1.6.5.2. Product Strategy

                18.1.6.5.3. Channel Strategy

        18.1.7. Kumar metal industries

            18.1.7.1. Overview

            18.1.7.2. Product Portfolio

            18.1.7.3. Profitability by Market Segments (Product/Age /Sales Channel/Region)

            18.1.7.4. Sales Footprint

            18.1.7.5. Strategy Overview

                18.1.7.5.1. Marketing Strategy

                18.1.7.5.2. Product Strategy

                18.1.7.5.3. Channel Strategy

        18.1.8. Lakshmi Machineries

            18.1.8.1. Overview

            18.1.8.2. Product Portfolio

            18.1.8.3. Profitability by Market Segments (Product/Age /Sales Channel/Region)

            18.1.8.4. Sales Footprint

            18.1.8.5. Strategy Overview

                18.1.8.5.1. Marketing Strategy

                18.1.8.5.2. Product Strategy

                18.1.8.5.3. Channel Strategy

        18.1.9. SS Engineering works

            18.1.9.1. Overview

            18.1.9.2. Product Portfolio

            18.1.9.3. Profitability by Market Segments (Product/Age /Sales Channel/Region)

            18.1.9.4. Sales Footprint

            18.1.9.5. Strategy Overview

                18.1.9.5.1. Marketing Strategy

                18.1.9.5.2. Product Strategy

                18.1.9.5.3. Channel Strategy

19. Assumptions & Acronyms Used

20. Research Methodology

List of Tables

Table 1: Global Market Value (US$ Million) Forecast by Region, 2018 to 2033

Table 2: Global Market Volume (MT) Forecast by Region, 2018 to 2033

Table 3: Global Market Value (US$ Million) Forecast by Product Type, 2018 to 2033

Table 4: Global Market Volume (MT) Forecast by Product Type, 2018 to 2033

Table 5: Global Market Value (US$ Million) Forecast by Application, 2018 to 2033

Table 6: Global Market Volume (MT) Forecast by Application, 2018 to 2033

Table 7: Global Market Value (US$ Million) Forecast by Mode of operation, 2018 to 2033

Table 8: Global Market Volume (MT) Forecast by Mode of operation, 2018 to 2033

Table 9: North America Market Value (US$ Million) Forecast by Country, 2018 to 2033

Table 10: North America Market Volume (MT) Forecast by Country, 2018 to 2033

Table 11: North America Market Value (US$ Million) Forecast by Product Type, 2018 to 2033

Table 12: North America Market Volume (MT) Forecast by Product Type, 2018 to 2033

Table 13: North America Market Value (US$ Million) Forecast by Application, 2018 to 2033

Table 14: North America Market Volume (MT) Forecast by Application, 2018 to 2033

Table 15: North America Market Value (US$ Million) Forecast by Mode of operation, 2018 to 2033

Table 16: North America Market Volume (MT) Forecast by Mode of operation, 2018 to 2033

Table 17: Latin America Market Value (US$ Million) Forecast by Country, 2018 to 2033

Table 18: Latin America Market Volume (MT) Forecast by Country, 2018 to 2033

Table 19: Latin America Market Value (US$ Million) Forecast by Product Type, 2018 to 2033

Table 20: Latin America Market Volume (MT) Forecast by Product Type, 2018 to 2033

Table 21: Latin America Market Value (US$ Million) Forecast by Application, 2018 to 2033

Table 22: Latin America Market Volume (MT) Forecast by Application, 2018 to 2033

Table 23: Latin America Market Value (US$ Million) Forecast by Mode of operation, 2018 to 2033

Table 24: Latin America Market Volume (MT) Forecast by Mode of operation, 2018 to 2033

Table 25: Europe Market Value (US$ Million) Forecast by Country, 2018 to 2033

Table 26: Europe Market Volume (MT) Forecast by Country, 2018 to 2033

Table 27: Europe Market Value (US$ Million) Forecast by Product Type, 2018 to 2033

Table 28: Europe Market Volume (MT) Forecast by Product Type, 2018 to 2033

Table 29: Europe Market Value (US$ Million) Forecast by Application, 2018 to 2033

Table 30: Europe Market Volume (MT) Forecast by Application, 2018 to 2033

Table 31: Europe Market Value (US$ Million) Forecast by Mode of operation, 2018 to 2033

Table 32: Europe Market Volume (MT) Forecast by Mode of operation, 2018 to 2033

Table 33: East Asia Market Value (US$ Million) Forecast by Country, 2018 to 2033

Table 34: East Asia Market Volume (MT) Forecast by Country, 2018 to 2033

Table 35: East Asia Market Value (US$ Million) Forecast by Product Type, 2018 to 2033

Table 36: East Asia Market Volume (MT) Forecast by Product Type, 2018 to 2033

Table 37: East Asia Market Value (US$ Million) Forecast by Application, 2018 to 2033

Table 38: East Asia Market Volume (MT) Forecast by Application, 2018 to 2033

Table 39: East Asia Market Value (US$ Million) Forecast by Mode of operation, 2018 to 2033

Table 40: East Asia Market Volume (MT) Forecast by Mode of operation, 2018 to 2033

Table 41: South Asia Market Value (US$ Million) Forecast by Country, 2018 to 2033

Table 42: South Asia Market Volume (MT) Forecast by Country, 2018 to 2033

Table 43: South Asia Market Value (US$ Million) Forecast by Product Type, 2018 to 2033

Table 44: South Asia Market Volume (MT) Forecast by Product Type, 2018 to 2033

Table 45: South Asia Market Value (US$ Million) Forecast by Application, 2018 to 2033

Table 46: South Asia Market Volume (MT) Forecast by Application, 2018 to 2033

Table 47: South Asia Market Value (US$ Million) Forecast by Mode of operation, 2018 to 2033

Table 48: South Asia Market Volume (MT) Forecast by Mode of operation, 2018 to 2033

Table 49: Oceania Market Value (US$ Million) Forecast by Country, 2018 to 2033

Table 50: Oceania Market Volume (MT) Forecast by Country, 2018 to 2033

Table 51: Oceania Market Value (US$ Million) Forecast by Product Type, 2018 to 2033

Table 52: Oceania Market Volume (MT) Forecast by Product Type, 2018 to 2033

Table 53: Oceania Market Value (US$ Million) Forecast by Application, 2018 to 2033

Table 54: Oceania Market Volume (MT) Forecast by Application, 2018 to 2033

Table 55: Oceania Market Value (US$ Million) Forecast by Mode of operation, 2018 to 2033

Table 56: Oceania Market Volume (MT) Forecast by Mode of operation, 2018 to 2033

Table 57: MEA Market Value (US$ Million) Forecast by Country, 2018 to 2033

Table 58: MEA Market Volume (MT) Forecast by Country, 2018 to 2033

Table 59: MEA Market Value (US$ Million) Forecast by Product Type, 2018 to 2033

Table 60: MEA Market Volume (MT) Forecast by Product Type, 2018 to 2033

Table 61: MEA Market Value (US$ Million) Forecast by Application, 2018 to 2033

Table 62: MEA Market Volume (MT) Forecast by Application, 2018 to 2033

Table 63: MEA Market Value (US$ Million) Forecast by Mode of operation, 2018 to 2033

Table 64: MEA Market Volume (MT) Forecast by Mode of operation, 2018 to 2033

List of Charts

Figure 1: Global Market Value (US$ Million) by Product Type, 2023 to 2033

Figure 2: Global Market Value (US$ Million) by Application, 2023 to 2033

Figure 3: Global Market Value (US$ Million) by Mode of operation, 2023 to 2033

Figure 4: Global Market Value (US$ Million) by Region, 2023 to 2033

Figure 5: Global Market Value (US$ Million) Analysis by Region, 2018 to 2033

Figure 6: Global Market Volume (MT) Analysis by Region, 2018 to 2033

Figure 7: Global Market Value Share (%) and BPS Analysis by Region, 2023 to 2033

Figure 8: Global Market Y-o-Y Growth (%) Projections by Region, 2023 to 2033

Figure 9: Global Market Value (US$ Million) Analysis by Product Type, 2018 to 2033

Figure 10: Global Market Volume (MT) Analysis by Product Type, 2018 to 2033

Figure 11: Global Market Value Share (%) and BPS Analysis by Product Type, 2023 to 2033

Figure 12: Global Market Y-o-Y Growth (%) Projections by Product Type, 2023 to 2033

Figure 13: Global Market Value (US$ Million) Analysis by Application, 2018 to 2033

Figure 14: Global Market Volume (MT) Analysis by Application, 2018 to 2033

Figure 15: Global Market Value Share (%) and BPS Analysis by Application, 2023 to 2033

Figure 16: Global Market Y-o-Y Growth (%) Projections by Application, 2023 to 2033

Figure 17: Global Market Value (US$ Million) Analysis by Mode of operation, 2018 to 2033

Figure 18: Global Market Volume (MT) Analysis by Mode of operation, 2018 to 2033

Figure 19: Global Market Value Share (%) and BPS Analysis by Mode of operation, 2023 to 2033

Figure 20: Global Market Y-o-Y Growth (%) Projections by Mode of operation, 2023 to 2033

Figure 21: Global Market Attractiveness by Product Type, 2023 to 2033

Figure 22: Global Market Attractiveness by Application, 2023 to 2033

Figure 23: Global Market Attractiveness by Mode of operation, 2023 to 2033

Figure 24: Global Market Attractiveness by Region, 2023 to 2033

Figure 25: North America Market Value (US$ Million) by Product Type, 2023 to 2033

Figure 26: North America Market Value (US$ Million) by Application, 2023 to 2033

Figure 27: North America Market Value (US$ Million) by Mode of operation, 2023 to 2033

Figure 28: North America Market Value (US$ Million) by Country, 2023 to 2033

Figure 29: North America Market Value (US$ Million) Analysis by Country, 2018 to 2033

Figure 30: North America Market Volume (MT) Analysis by Country, 2018 to 2033

Figure 31: North America Market Value Share (%) and BPS Analysis by Country, 2023 to 2033

Figure 32: North America Market Y-o-Y Growth (%) Projections by Country, 2023 to 2033

Figure 33: North America Market Value (US$ Million) Analysis by Product Type, 2018 to 2033

Figure 34: North America Market Volume (MT) Analysis by Product Type, 2018 to 2033

Figure 35: North America Market Value Share (%) and BPS Analysis by Product Type, 2023 to 2033

Figure 36: North America Market Y-o-Y Growth (%) Projections by Product Type, 2023 to 2033

Figure 37: North America Market Value (US$ Million) Analysis by Application, 2018 to 2033

Figure 38: North America Market Volume (MT) Analysis by Application, 2018 to 2033

Figure 39: North America Market Value Share (%) and BPS Analysis by Application, 2023 to 2033

Figure 40: North America Market Y-o-Y Growth (%) Projections by Application, 2023 to 2033

Figure 41: North America Market Value (US$ Million) Analysis by Mode of operation, 2018 to 2033

Figure 42: North America Market Volume (MT) Analysis by Mode of operation, 2018 to 2033

Figure 43: North America Market Value Share (%) and BPS Analysis by Mode of operation, 2023 to 2033

Figure 44: North America Market Y-o-Y Growth (%) Projections by Mode of operation, 2023 to 2033

Figure 45: North America Market Attractiveness by Product Type, 2023 to 2033

Figure 46: North America Market Attractiveness by Application, 2023 to 2033

Figure 47: North America Market Attractiveness by Mode of operation, 2023 to 2033

Figure 48: North America Market Attractiveness by Country, 2023 to 2033

Figure 49: Latin America Market Value (US$ Million) by Product Type, 2023 to 2033

Figure 50: Latin America Market Value (US$ Million) by Application, 2023 to 2033

Figure 51: Latin America Market Value (US$ Million) by Mode of operation, 2023 to 2033

Figure 52: Latin America Market Value (US$ Million) by Country, 2023 to 2033

Figure 53: Latin America Market Value (US$ Million) Analysis by Country, 2018 to 2033

Figure 54: Latin America Market Volume (MT) Analysis by Country, 2018 to 2033

Figure 55: Latin America Market Value Share (%) and BPS Analysis by Country, 2023 to 2033

Figure 56: Latin America Market Y-o-Y Growth (%) Projections by Country, 2023 to 2033

Figure 57: Latin America Market Value (US$ Million) Analysis by Product Type, 2018 to 2033

Figure 58: Latin America Market Volume (MT) Analysis by Product Type, 2018 to 2033

Figure 59: Latin America Market Value Share (%) and BPS Analysis by Product Type, 2023 to 2033

Figure 60: Latin America Market Y-o-Y Growth (%) Projections by Product Type, 2023 to 2033

Figure 61: Latin America Market Value (US$ Million) Analysis by Application, 2018 to 2033

Figure 62: Latin America Market Volume (MT) Analysis by Application, 2018 to 2033

Figure 63: Latin America Market Value Share (%) and BPS Analysis by Application, 2023 to 2033

Figure 64: Latin America Market Y-o-Y Growth (%) Projections by Application, 2023 to 2033

Figure 65: Latin America Market Value (US$ Million) Analysis by Mode of operation, 2018 to 2033

Figure 66: Latin America Market Volume (MT) Analysis by Mode of operation, 2018 to 2033

Figure 67: Latin America Market Value Share (%) and BPS Analysis by Mode of operation, 2023 to 2033

Figure 68: Latin America Market Y-o-Y Growth (%) Projections by Mode of operation, 2023 to 2033

Figure 69: Latin America Market Attractiveness by Product Type, 2023 to 2033

Figure 70: Latin America Market Attractiveness by Application, 2023 to 2033

Figure 71: Latin America Market Attractiveness by Mode of operation, 2023 to 2033

Figure 72: Latin America Market Attractiveness by Country, 2023 to 2033

Figure 73: Europe Market Value (US$ Million) by Product Type, 2023 to 2033

Figure 74: Europe Market Value (US$ Million) by Application, 2023 to 2033

Figure 75: Europe Market Value (US$ Million) by Mode of operation, 2023 to 2033

Figure 76: Europe Market Value (US$ Million) by Country, 2023 to 2033

Figure 77: Europe Market Value (US$ Million) Analysis by Country, 2018 to 2033

Figure 78: Europe Market Volume (MT) Analysis by Country, 2018 to 2033

Figure 79: Europe Market Value Share (%) and BPS Analysis by Country, 2023 to 2033

Figure 80: Europe Market Y-o-Y Growth (%) Projections by Country, 2023 to 2033

Figure 81: Europe Market Value (US$ Million) Analysis by Product Type, 2018 to 2033

Figure 82: Europe Market Volume (MT) Analysis by Product Type, 2018 to 2033

Figure 83: Europe Market Value Share (%) and BPS Analysis by Product Type, 2023 to 2033

Figure 84: Europe Market Y-o-Y Growth (%) Projections by Product Type, 2023 to 2033

Figure 85: Europe Market Value (US$ Million) Analysis by Application, 2018 to 2033

Figure 86: Europe Market Volume (MT) Analysis by Application, 2018 to 2033

Figure 87: Europe Market Value Share (%) and BPS Analysis by Application, 2023 to 2033

Figure 88: Europe Market Y-o-Y Growth (%) Projections by Application, 2023 to 2033

Figure 89: Europe Market Value (US$ Million) Analysis by Mode of operation, 2018 to 2033

Figure 90: Europe Market Volume (MT) Analysis by Mode of operation, 2018 to 2033

Figure 91: Europe Market Value Share (%) and BPS Analysis by Mode of operation, 2023 to 2033

Figure 92: Europe Market Y-o-Y Growth (%) Projections by Mode of operation, 2023 to 2033

Figure 93: Europe Market Attractiveness by Product Type, 2023 to 2033

Figure 94: Europe Market Attractiveness by Application, 2023 to 2033

Figure 95: Europe Market Attractiveness by Mode of operation, 2023 to 2033

Figure 96: Europe Market Attractiveness by Country, 2023 to 2033

Figure 97: East Asia Market Value (US$ Million) by Product Type, 2023 to 2033

Figure 98: East Asia Market Value (US$ Million) by Application, 2023 to 2033

Figure 99: East Asia Market Value (US$ Million) by Mode of operation, 2023 to 2033

Figure 100: East Asia Market Value (US$ Million) by Country, 2023 to 2033

Figure 101: East Asia Market Value (US$ Million) Analysis by Country, 2018 to 2033

Figure 102: East Asia Market Volume (MT) Analysis by Country, 2018 to 2033

Figure 103: East Asia Market Value Share (%) and BPS Analysis by Country, 2023 to 2033

Figure 104: East Asia Market Y-o-Y Growth (%) Projections by Country, 2023 to 2033

Figure 105: East Asia Market Value (US$ Million) Analysis by Product Type, 2018 to 2033

Figure 106: East Asia Market Volume (MT) Analysis by Product Type, 2018 to 2033

Figure 107: East Asia Market Value Share (%) and BPS Analysis by Product Type, 2023 to 2033

Figure 108: East Asia Market Y-o-Y Growth (%) Projections by Product Type, 2023 to 2033

Figure 109: East Asia Market Value (US$ Million) Analysis by Application, 2018 to 2033

Figure 110: East Asia Market Volume (MT) Analysis by Application, 2018 to 2033

Figure 111: East Asia Market Value Share (%) and BPS Analysis by Application, 2023 to 2033

Figure 112: East Asia Market Y-o-Y Growth (%) Projections by Application, 2023 to 2033

Figure 113: East Asia Market Value (US$ Million) Analysis by Mode of operation, 2018 to 2033

Figure 114: East Asia Market Volume (MT) Analysis by Mode of operation, 2018 to 2033

Figure 115: East Asia Market Value Share (%) and BPS Analysis by Mode of operation, 2023 to 2033

Figure 116: East Asia Market Y-o-Y Growth (%) Projections by Mode of operation, 2023 to 2033

Figure 117: East Asia Market Attractiveness by Product Type, 2023 to 2033

Figure 118: East Asia Market Attractiveness by Application, 2023 to 2033

Figure 119: East Asia Market Attractiveness by Mode of operation, 2023 to 2033

Figure 120: East Asia Market Attractiveness by Country, 2023 to 2033

Figure 121: South Asia Market Value (US$ Million) by Product Type, 2023 to 2033

Figure 122: South Asia Market Value (US$ Million) by Application, 2023 to 2033

Figure 123: South Asia Market Value (US$ Million) by Mode of operation, 2023 to 2033

Figure 124: South Asia Market Value (US$ Million) by Country, 2023 to 2033

Figure 125: South Asia Market Value (US$ Million) Analysis by Country, 2018 to 2033

Figure 126: South Asia Market Volume (MT) Analysis by Country, 2018 to 2033

Figure 127: South Asia Market Value Share (%) and BPS Analysis by Country, 2023 to 2033

Figure 128: South Asia Market Y-o-Y Growth (%) Projections by Country, 2023 to 2033

Figure 129: South Asia Market Value (US$ Million) Analysis by Product Type, 2018 to 2033

Figure 130: South Asia Market Volume (MT) Analysis by Product Type, 2018 to 2033

Figure 131: South Asia Market Value Share (%) and BPS Analysis by Product Type, 2023 to 2033

Figure 132: South Asia Market Y-o-Y Growth (%) Projections by Product Type, 2023 to 2033

Figure 133: South Asia Market Value (US$ Million) Analysis by Application, 2018 to 2033

Figure 134: South Asia Market Volume (MT) Analysis by Application, 2018 to 2033

Figure 135: South Asia Market Value Share (%) and BPS Analysis by Application, 2023 to 2033

Figure 136: South Asia Market Y-o-Y Growth (%) Projections by Application, 2023 to 2033

Figure 137: South Asia Market Value (US$ Million) Analysis by Mode of operation, 2018 to 2033

Figure 138: South Asia Market Volume (MT) Analysis by Mode of operation, 2018 to 2033

Figure 139: South Asia Market Value Share (%) and BPS Analysis by Mode of operation, 2023 to 2033

Figure 140: South Asia Market Y-o-Y Growth (%) Projections by Mode of operation, 2023 to 2033

Figure 141: South Asia Market Attractiveness by Product Type, 2023 to 2033

Figure 142: South Asia Market Attractiveness by Application, 2023 to 2033

Figure 143: South Asia Market Attractiveness by Mode of operation, 2023 to 2033

Figure 144: South Asia Market Attractiveness by Country, 2023 to 2033

Figure 145: Oceania Market Value (US$ Million) by Product Type, 2023 to 2033

Figure 146: Oceania Market Value (US$ Million) by Application, 2023 to 2033

Figure 147: Oceania Market Value (US$ Million) by Mode of operation, 2023 to 2033

Figure 148: Oceania Market Value (US$ Million) by Country, 2023 to 2033

Figure 149: Oceania Market Value (US$ Million) Analysis by Country, 2018 to 2033

Figure 150: Oceania Market Volume (MT) Analysis by Country, 2018 to 2033

Figure 151: Oceania Market Value Share (%) and BPS Analysis by Country, 2023 to 2033

Figure 152: Oceania Market Y-o-Y Growth (%) Projections by Country, 2023 to 2033

Figure 153: Oceania Market Value (US$ Million) Analysis by Product Type, 2018 to 2033

Figure 154: Oceania Market Volume (MT) Analysis by Product Type, 2018 to 2033

Figure 155: Oceania Market Value Share (%) and BPS Analysis by Product Type, 2023 to 2033

Figure 156: Oceania Market Y-o-Y Growth (%) Projections by Product Type, 2023 to 2033

Figure 157: Oceania Market Value (US$ Million) Analysis by Application, 2018 to 2033

Figure 158: Oceania Market Volume (MT) Analysis by Application, 2018 to 2033

Figure 159: Oceania Market Value Share (%) and BPS Analysis by Application, 2023 to 2033

Figure 160: Oceania Market Y-o-Y Growth (%) Projections by Application, 2023 to 2033

Figure 161: Oceania Market Value (US$ Million) Analysis by Mode of operation, 2018 to 2033

Figure 162: Oceania Market Volume (MT) Analysis by Mode of operation, 2018 to 2033

Figure 163: Oceania Market Value Share (%) and BPS Analysis by Mode of operation, 2023 to 2033

Figure 164: Oceania Market Y-o-Y Growth (%) Projections by Mode of operation, 2023 to 2033

Figure 165: Oceania Market Attractiveness by Product Type, 2023 to 2033

Figure 166: Oceania Market Attractiveness by Application, 2023 to 2033

Figure 167: Oceania Market Attractiveness by Mode of operation, 2023 to 2033

Figure 168: Oceania Market Attractiveness by Country, 2023 to 2033

Figure 169: MEA Market Value (US$ Million) by Product Type, 2023 to 2033

Figure 170: MEA Market Value (US$ Million) by Application, 2023 to 2033

Figure 171: MEA Market Value (US$ Million) by Mode of operation, 2023 to 2033

Figure 172: MEA Market Value (US$ Million) by Country, 2023 to 2033

Figure 173: MEA Market Value (US$ Million) Analysis by Country, 2018 to 2033

Figure 174: MEA Market Volume (MT) Analysis by Country, 2018 to 2033

Figure 175: MEA Market Value Share (%) and BPS Analysis by Country, 2023 to 2033

Figure 176: MEA Market Y-o-Y Growth (%) Projections by Country, 2023 to 2033

Figure 177: MEA Market Value (US$ Million) Analysis by Product Type, 2018 to 2033

Figure 178: MEA Market Volume (MT) Analysis by Product Type, 2018 to 2033

Figure 179: MEA Market Value Share (%) and BPS Analysis by Product Type, 2023 to 2033

Figure 180: MEA Market Y-o-Y Growth (%) Projections by Product Type, 2023 to 2033

Figure 181: MEA Market Value (US$ Million) Analysis by Application, 2018 to 2033

Figure 182: MEA Market Volume (MT) Analysis by Application, 2018 to 2033

Figure 183: MEA Market Value Share (%) and BPS Analysis by Application, 2023 to 2033

Figure 184: MEA Market Y-o-Y Growth (%) Projections by Application, 2023 to 2033

Figure 185: MEA Market Value (US$ Million) Analysis by Mode of operation, 2018 to 2033

Figure 186: MEA Market Volume (MT) Analysis by Mode of operation, 2018 to 2033

Figure 187: MEA Market Value Share (%) and BPS Analysis by Mode of operation, 2023 to 2033

Figure 188: MEA Market Y-o-Y Growth (%) Projections by Mode of operation, 2023 to 2033

Figure 189: MEA Market Attractiveness by Product Type, 2023 to 2033

Figure 190: MEA Market Attractiveness by Application, 2023 to 2033

Figure 191: MEA Market Attractiveness by Mode of operation, 2023 to 2033

Figure 192: MEA Market Attractiveness by Country, 2023 to 2033

Explore Process Automation Insights

View Reports