Cold Packs Market Size, Share, and Forecast Outlook 2025 to 2035

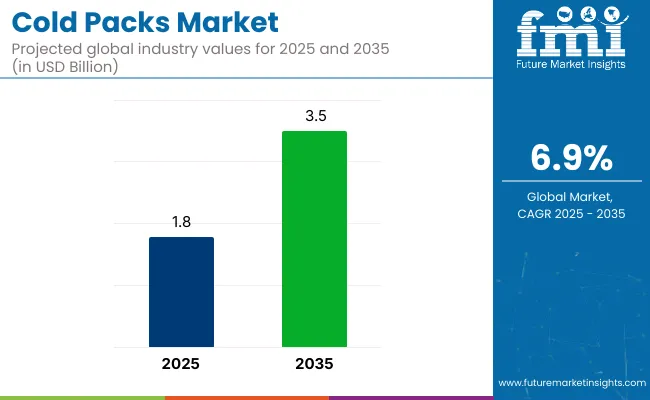
The cold packs industry is set to grow from USD 1.8 billion in 2025 to USD 3.5 billion by 2035, progressing at a steady CAGR of 6.9% throughout the forecast period. The global industry is poised for constant expansion, largely driven by the growing demand for temperature-controlled solutions in pharmaceutical logistics.
Quick Stats of Cold Packs Market

  • Market Value (2025): USD 1.8 billion
  • Forecast Value (2035): USD 3.5 billion
  • Forecast CAGR (2025 to 2035): 6.9%
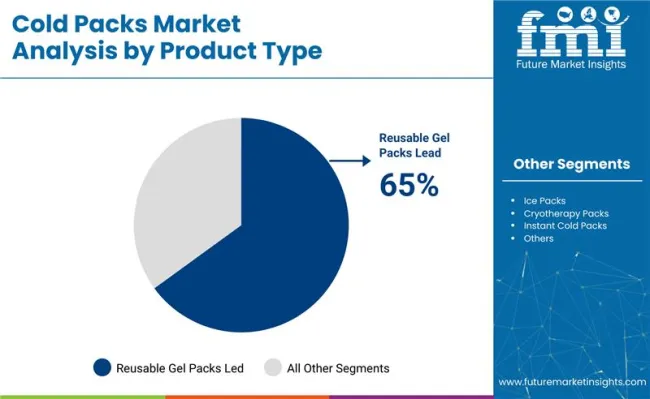
  • Leading Segment in 2035: Reusable Gel Packs (65% share)
  • Key Growth Region: North America (United States)
  • Key Players: Nortech Labs, Inc., Pelton Shepherd Industries, Rapid Aid, CryoMAX, IPC Packaging, Dispotech, Tempack, Sercalia, Cooler Shock, G-Gel Ice Packs.

Cold Packs Market

The demand surge is fueled by the growing distribution of temperature-sensitive biologics, specialty drugs, and injectable therapies. As healthcare systems worldwide enhance their cold chain infrastructure to meet stricter regulatory standards and rising demand for biologics. Cooling packs are an important component in ensuring drug integrity during storage and transport.

The cold packs industry holds varying shares within its parent industries. Within the hot and cold therapy packs industry, cold packs account for around 40-50% of the segment, with hot packs also contributing. In the cold pain therapy industry, cooling packs are recognized as a major player, representing about 30-40% due to their effectiveness in reducing pain and inflammation.

In the reusable ice packs industry, cooling packs dominate, comprising over 60% of the industry, given their extensive use in therapeutic, sports, and home settings. In the broader medical devices industry, a small yet vital percentage of 2-3% is made up by cooling packs, as a specialized therapeutic tool. In the consumer healthcare products industry, cooling packs are included in the broader wellness category, contributing 5-8% to the segment.

At DCAT Week 2025, Tjoapack US confirmed its strategic investments in customizable cold-pack solutions designed to meet the complex needs of temperature-sensitive pharmaceutical products such as prefilled syringes, vials, and auto-injectors.

In an exclusive interview with Pharmaceutical Technology (PharmTech, March 2025), Peter Belden, President of Tjoapack US, announced the company's expansion of advanced cold packaging lines and enhanced cold storage capabilities at its facilities in Clinton, Tennessee, and Etten-Leur, Netherlands. These improvements aim to bolster the firm's compliance with global pharmaceutical logistics standards and strengthen its role in delivering complex, temperature-controlled therapies.

Analysis of Cold Packs Market by Top Investment Segments

Reusable gel packs, healthcare institutions, pain relief applications, polyethylene materials, and online retailers are collectively expected to dominate the industry in 2025, driven by growing demand in the medical, personal care, and home-use sectors.

Reusable Gel Packs Lead Product Demand

Reusable gel packs are projected to account for nearly 65% industry share by 2025, driven by their cost-effectiveness, durability, and adaptability across various applications.
  • Cooling packs are preferred in medical care, sports recovery, and home use owing to their ability to provide consistent cooling and reduce inflammation.
  • Hospitals and sports clinics favor reusable gel packs as they minimize recurring procurement costs and environmental waste compared to disposable alternatives.
  • Leading players, such as Cardinal Health and 3M, offer reusable gel packs with ergonomic designs, thereby increasing consumer preference. Growing focus on eco-friendly and viable cold therapy solutions is expected to strengthen the dominance of reusable gel packs globally.

Cold Packs Market Analysis By Product Type

Healthcare Institutions Dominate End User Segment

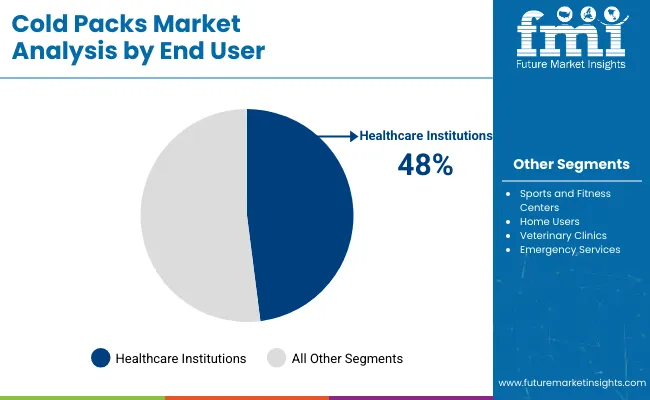
Healthcare institutions are expected to hold 48% of the industry share in 2025, making them the largest end-user.
  • Hospitals, rehabilitation centers, and specialty clinics extensively utilize these packs for postoperative care, reducing inflammation and managing pain.
  • With the rising number of outpatient surgeries and increased focus on non-pharmaceutical recovery methods, the reliance on cold therapy in clinical settings is intensifying. Manufacturers are partnering with large hospital chains to deliver high-volume, GDP-compliant cold pack solutions.
  • The steady growth of global healthcare infrastructure, particularly among aging populations, ensures the dominance of healthcare institutions as the primary end-user segment.

Cold Packs Market Analysis By End User

Pain Relief Applications Drive Industry Demand

Pain relief applications are projected to account for over 42% of the share in 2025, making them the largest application category. Cooling packs are widely used in alleviating muscle soreness, joint stiffness, and localized swelling caused by injury or chronic conditions like arthritis.

  • Demand from home users, physiotherapy clinics, and emergency services supports the segment’s growth.
  • Products such as instant cool packs and reusable gel packs are specifically designed for pain management and are recommended by orthopedic and sports physicians globally. The increasing prevalence of musculoskeletal disorders further boosts the adoption of these packs for pain relief therapy.

Polyethylene Emerges as Preferred Material

Polyethylene is poised to dominate the material composition segment, with a projected 53% share in 2025, due to its durability, flexibility, and cost-effectiveness. It is widely used in the outer casing of gel and ice packs because of its puncture resistance and ability to maintain seal integrity under variable temperatures.

  • Manufacturers prefer polyethylene for its adaptability in producing soft, flexible, and reusable pack designs ideal for medical and sports use.
  • Brands such as Thermo Fisher Scientific and Medline Industries rely on polyethylene to produce reliable cold-pack products. Its recyclability and low manufacturing cost further support its leadership position in this category.

Online Retailers Gain Distribution Advantage

Online retailers are projected to capture over 36% industry share in 2025, emerging as the leading distribution channel. Growth is fueled by the convenience of direct-to-consumer delivery and the rising trend of e-commerce for personal health products.

  • Platforms like Amazon, Flipkart, and Alibaba offer a variety of cold pack products catering to both home users and professionals. The COVID-19 pandemic accelerated online sales, with consumers preferring home delivery of medical and wellness supplies.
  • Attractive pricing, detailed product reviews, and doorstep convenience provided by online platforms ensure the strong growth of this distribution channel over others.

Top Cold Packs Market Dynamics

The industry is growing due to increased use in healthcare, sports, and consumer wellness. Manufacturers are emphasizing safety, convenience, and multi-use functionality. Strong demand from physical therapy and first-aid segments is shaping product innovation.

Expanding Demand from Medical and Sports Applications

Cooling packs are widely used in healthcare for injury management. Reusable and instant packs are relied upon by physical therapists and sports trainers to reduce swelling and pain. Ready-to-use cooling packs are now included in first-aid kits as necessary items. Bulk purchases are made by clinics, hospitals, and athletic facilities, and specialized sizes and shapes are adopted by pediatric and veterinary sectors.

  • Cooling packs are relied upon to reduce swelling and pain in healthcare and sports.
  • Ready-to-use cooling packs are included in first-aid kits.
  • Specialized sizes and shapes are adopted by the pediatric and veterinary sectors.

Innovation in Materials and Packaging Enhancing User Experience

Innovations in materials and packaging are improving cold pack usability. Non-toxic gel formulas are being introduced for enhanced safety, while biodegradable and eco-friendly wrappers are adopted to reduce waste. Vacuum-sealed designs are used to improve compact storage and portability. Faster activation mechanisms, such as pinch-to-activate and break-to-use systems, are being launched, and flexible fabric wraps are combined with cold pack inserts for improved user comfort.
  • Non-toxic gel formulas and eco-friendly packaging are introduced to improve safety and sustainability.
  • Faster activation mechanisms, such as pinch-to-activate systems, are launched for enhanced convenience.
  • Flexible fabric wraps are combined with cold pack inserts to improve user comfort.

Analysis of Top Countries Manufacturing, Exporting and Supplying Cold Packs Globally

Country Wise Analysis Of Cold Packs Market Cagr 2025 To 2035

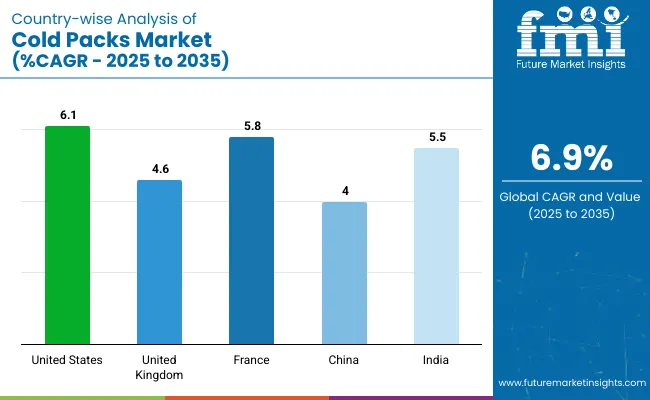
Countries CAGR (2025 to 2035)
United States 6.1%
United Kingdom 4.6%
France 5.8%
China 4.0%
India 5.5%

The report covers a detailed analysis of 40+ countries and the top five countries have been shared as a reference. The cold packs industry, expected to grow at a global CAGR of 6.9% from 2025 to 2035, is experiencing varied performance across key countries. A 6.1% CAGR is being led by the United States, a member of the OECD, driven by strong demand in the medical and recreational sectors.

A 5.8% CAGR is being observed in France, also an OECD member, where moderate growth is being seen within established healthcare systems. A 5.5% CAGR is being exhibited by India, a member of the BRICS group, reflecting an emerging industry with increasing healthcare access and awareness.

Slower growth rates are being recorded in the United Kingdom, an OECD member, and China, a member of the BRICS group, with 4.6% and 4.0% CAGRs, respectively, due to stable industry and alternative technologies. Stable demand is being seen in developed countries in the OECD, while a high-growth opportunity is being represented by India, a member of the BRICS group, due to its expanding healthcare infrastructure.

India Cold Packs Market Analysis and Growth Outlook

Demand for cooling packs in India is anticipated to grow at a robust CAGR of 5.5% through 2035, driven by a rising urban population and increased interest in fitness and sports. Grassroots sports initiatives and the growing popularity of personal fitness routines are expected to drive demand across gyms, sports academies, and homes.

Affordable, reusable cooling packs are gaining popularity in India’s cost-sensitive market, with mass production being emphasized by domestic manufacturers. The position of India as one of the fastest-growing industry is expected to be solidified by improvements in healthcare infrastructure and increased awareness regarding injury management.

  • Grassroots sports programs are supported by the government.
  • The demand for affordable, reusable cooling packs is growing.
  • Healthcare infrastructure and injury management awareness are expected to expand.

United States Cold Packs Industry Expansion

The USA cooling packs industry is expected to grow at a CAGR of 6.1% from 2025 to 2035. Growth is being supported by the country’s well-established healthcare infrastructure and the widespread use of cold therapy in post-surgical recovery and sports medicine. Rising participation in fitness activities and the aging population are contributing to the adoption of cooling packs.

Eco-friendly, reusable cooling packs are being prioritized by manufacturers in response to environmental concerns. The USA’s dominant position in the global cold therapy industry is reinforced by strong domestic production capabilities and continuous innovation.

  • Adoption in sports medicine and post-surgical recovery is increasing.
  • Eco-friendly, reusable cooling packs are being focused on.
  • Domestic production capabilities and innovation are driving growth.

United Kingdom Cold Packs Market Expansion

The UK market is projected to grow at a steady CAGR of 4.6%. Increased demand in elderly care, home healthcare, and sports injury management is driving the growth. Awareness of cold therapy has been raised by NHS endorsements of non-pharmacological treatments.

The shift toward home-based recovery solutions is expected to be further supported, especially among aging populations and fitness enthusiasts. Accessibility through retail pharmacy chains and e-commerce platforms is ensuring that cooling packs are readily available to consumers.

  • Cold therapy awareness is being raised by NHS endorsements.
  • Home-based recovery solutions are being increasingly adopted.
  • Accessibility through retail and e-commerce platforms is being enhanced.

France Cold Packs Industry Growth

Sales of cooling packs in France are growing at a CAGR of 5.8% from 2025 to 2035. Growth is being driven by the country’s expanding fitness culture and increased sports participation. The need for cold therapy products is rising among athletes due to popular sports like cycling, running, and soccer.

Partnerships are being formed between manufacturers and gyms/sports clubs to reach fitness-conscious consumers. A growing preference for reusable cooling packs is aligning with national ecological goals, further supporting industry growth.

  • Sports participation is driving growth.
  • Partnerships with gyms and sports clubs are being formed.
  • A preference for eco-friendly, reusable cooling packs is growing.

China Cold Packs Market Insights

China cooling pack industry is expected to grow at a moderate 4% CAGR from 2025 to 2035. The rise in health consciousness and the aging population’s need for pain relief solutions are supporting growth. Cooling packs are increasingly used in clinics, hospitals, and home healthcare settings to manage sports injuries, arthritis, and muscle strains.

The demand for cooling packs is being boosted by government-led sports development programs and expanded elderly care services. Competitive pricing by domestic manufacturers is ensuring product penetration across urban and rural markets, positioning China as a major industry for cooling pack in the Asia-Pacific region.

  • Cooling packs are being increasingly used in clinics, hospitals, and home healthcare.
  • Government initiatives for sports and elderly care are boosting demand.
  • Domestic manufacturers are offering competitively priced products.

Leading Cold Packs Suppliers

The industry is driven by established players and rising innovators focused on cold chain logistics, medical cold therapy, and temperature-sensitive shipping. Key companies like Nortech Labs, Inc., Pelton Shepherd Industries, and CryoMAX lead with advanced gel ice packs and instant cooling packs tailored for first aid and healthcare applications.

Rapid Aid is known for patent-backed hot and cold therapy packs, while Cooler Shock and G-Gel Ice Packs cater to the growing demand for reusable cooling packs in food delivery and e-commerce packaging. In Europe, Dispotech (Italy), Tempack (France), and Sercalia (Spain) innovate with green packaging solutions for pharmaceuticals and perishable goods.

Recent Cold Packs Industry News

  • On June 5, 2025, Tjoapack expanded its cold-chain packaging operations in Clinton, Tennessee, and Etten-Leur, Netherlands, to support increased demand for biologics and injectable therapies.
  • The Clinton facility added two automated packaging lines for vials and auto-injectors, while Etten-Leur boosted cold storage capacity to 120 pallets and introduced a fully automated prefilled syringe packaging line.

Report Coverage and Scope Summary

Report Attributes Details
Market Size (2025) USD 1.8 billion
Projected Market Size (2035) USD 3.5 billion
CAGR (2025 to 2035) 6.9%
Base Year for Estimation 2024
Historical Period 2020 to 2024
Projections Period 2025 to 2035
Quantitative Units USD billion for value and million units for volume
Types Analyzed (Segment 1) Reusable Gel Packs, Ice Packs, Cryotherapy Packs, Instant Cold Packs, Thermal Packs
End Users Analyzed (Segment 2) Healthcare Institutions, Sports and Fitness Centers, Home Users, Veterinary Clinics, Emergency Services
Applications Analyzed (Segment 3) Pain Relief, Post-Surgery Recovery, Sports Injuries, Muscle Therapy, Inflammation Reduction
Material Compositions Analyzed (Segment 4) Polyethylene, Gel Material, Clay-Based Compositions, Synthetic Materials, Natural Materials
Distribution Channels Analyzed (Segment 5) Online Retailers, Pharmacies and Drug Stores, Specialty Health Stores, Medical Supply Stores, Wholesale Distributors
Regions Covered North America, Europe, Asia Pacific, Middle East & Africa, Latin America
Countries Covered United States, Canada, Germany, United Kingdom, France, Italy, Spain, China, Japan, South Korea, India, Australia, Brazil, Mexico, Argentina, Saudi Arabia, UAE, South Africa
Key Players Nortech Labs, Inc., Pelton Shepherd Industries, Rapid Aid, CryoMAX, IPC Packaging, Dispotech, Tempack, Sercalia, Cooler Shock, G-Gel Ice Packs.
Additional Attributes Dollar sales, share by type and end user, rising demand in post-surgery recovery, growth in sports medicine and physiotherapy sectors, development of eco-friendly and biodegradable cold packs, regional usage variations

Leading Players

  • Nortech Labs, Inc. (USA)
  • Pelton Shepherd Industries (USA)
  • Rapid Aid
  • CryoMAX
  • IPC Packaging
  • Dispotech (Italy)
  • Tempack (France)
  • Sercalia (Spain)
  • Cooler Shock
  • G-Gel Ice Packs

Key Cold Packs Market Segmentation

By Product Type:

The industry is segmented into reusable gel packs, ice packs, cryotherapy packs, instant cold packs, and thermal packs.

By End User:

The key end users include healthcare institutions, sports and fitness centers, home users, veterinary clinics, and emergency services.

By Application:

The industry finds applications in pain relief, post-surgery recovery, sports injuries, muscle therapy, and inflammation reduction.

By Material Composition:

The materials used in cooling packs include polyethylene, gel material, clay-based compositions, synthetic materials, and natural materials.

By Distribution Channel:

Cooling packs are distributed through online retailers, pharmacies and drug stores, specialty health stores, medical supply stores, and wholesale distributors.

By Region:

The industry covers regions including North America, Europe, Asia Pacific, Latin America, and the Middle East & Africa.

Table of Content

  1. Executive Summary
    • Global Market Outlook
    • Demand-side Trends
    • Supply-side Trends
    • Technology Roadmap Analysis
    • Analysis and Recommendations
  2. Market Overview
    • Market Coverage / Taxonomy
    • Market Definition / Scope / Limitations
  3. Market Background
    • Market Dynamics
      • Drivers
      • Restraints
      • Opportunity
      • Trends
    • Scenario Forecast
      • Demand in Optimistic Scenario
      • Demand in Likely Scenario
      • Demand in Conservative Scenario
    • Opportunity Map Analysis
    • Product Life Cycle Analysis
    • Supply Chain Analysis
      • Supply Side Participants and their Roles
        • Producers
        • Mid-Level Participants (Traders/ Agents/ Brokers)
        • Wholesalers and Distributors
      • Value Added and Value Created at Node in the Supply Chain
      • List of Raw Material Suppliers
      • List of Existing and Potential Buyer’s
    • Investment Feasibility Matrix
    • Value Chain Analysis
      • Profit Margin Analysis
      • Wholesalers and Distributors
      • Retailers
    • PESTLE and Porter’s Analysis
    • Regulatory Landscape
      • By Key Regions
      • By Key Countries
    • Regional Parent Market Outlook
    • Production and Consumption Statistics
    • Import and Export Statistics
  4. Global Market Analysis 2020 to 2024 and Forecast, 2025 to 2035
    • Historical Market Size Value (USD Billion) & Volume (Million Units) Analysis, 2020 to 2024
    • Current and Future Market Size Value (USD Billion) & Volume (Million Units) Projections, 2025 to 2035
      • Y-o-Y Growth Trend Analysis
      • Absolute $ Opportunity Analysis
  5. Global Market Pricing Analysis 2020 to 2024 and Forecast 2025 to 2035
  6. Global Market Analysis 2020 to 2024 and Forecast 2025 to 2035, By Product Type
    • Introduction / Key Findings
    • Historical Market Size Value (USD Billion) & Volume (Million Units) Analysis By Product Type, 2020 to 2024
    • Current and Future Market Size Value (USD Billion) & Volume (Million Units) Analysis and Forecast By Product Type, 2025 to 2035
      • Reusable Gel Packs
      • Ice Packs
      • Cryotherapy Packs
      • Instant Cold Packs
      • Thermal Packs
    • Y-o-Y Growth Trend Analysis By Product Type, 2020 to 2024
    • Absolute $ Opportunity Analysis By Product Type, 2025 to 2035
  7. Global Market Analysis 2020 to 2024 and Forecast 2025 to 2035, By End User
    • Introduction / Key Findings
    • Historical Market Size Value (USD Billion) & Volume (Million Units) Analysis By End User, 2020 to 2024
    • Current and Future Market Size Value (USD Billion) & Volume (Million Units) Analysis and Forecast By End User, 2025 to 2035
      • Healthcare Institutions
      • Sports And Fitness Centers
      • Home Users
      • Veterinary Clinics
      • Emergency Services
    • Y-o-Y Growth Trend Analysis By End User, 2020 to 2024
    • Absolute $ Opportunity Analysis By End User, 2025 to 2035
  8. Global Market Analysis 2020 to 2024 and Forecast 2025 to 2035, By Application
    • Introduction / Key Findings
    • Historical Market Size Value (USD Billion) & Volume (Million Units) Analysis By Application, 2020 to 2024
    • Current and Future Market Size Value (USD Billion) & Volume (Million Units) Analysis and Forecast By Application, 2025 to 2035
      • Pain Relief
      • Post-Surgery Recovery
      • Sports Injuries
      • Muscle Therapy
      • Inflammation Reduction
    • Y-o-Y Growth Trend Analysis By Application, 2020 to 2024
    • Absolute $ Opportunity Analysis By Application, 2025 to 2035
  9. Global Market Analysis 2020 to 2024 and Forecast 2025 to 2035, By Material Composition
    • Introduction / Key Findings
    • Historical Market Size Value (USD Billion) & Volume (Million Units) Analysis By Material Composition, 2020 to 2024
    • Current and Future Market Size Value (USD Billion) & Volume (Million Units) Analysis and Forecast By Material Composition, 2025 to 2035
      • Polyethylene
      • Gel Material
      • Clay-Based Compositions
      • Synthetic Materials
      • Natural Materials
    • Y-o-Y Growth Trend Analysis By Material Composition, 2020 to 2024
    • Absolute $ Opportunity Analysis By Material Composition, 2025 to 2035
  10. Global Market Analysis 2020 to 2024 and Forecast 2025 to 2035, By Distribution Channel
    • Introduction / Key Findings
    • Historical Market Size Value (USD Billion) & Volume (Million Units) Analysis By Distribution Channel, 2020 to 2024
    • Current and Future Market Size Value (USD Billion) & Volume (Million Units) Analysis and Forecast By Distribution Channel, 2025 to 2035
      • Online Retailers
      • Pharmacies And Drug Stores
      • Specialty Health Stores
      • Medical Supply Stores
      • Wholesale Distributors
    • Y-o-Y Growth Trend Analysis By Distribution Channel, 2020 to 2024
    • Absolute $ Opportunity Analysis By Distribution Channel, 2025 to 2035
  11. Global Market Analysis 2020 to 2024 and Forecast 2025 to 2035, By Region
    • Introduction
    • Historical Market Size Value (USD Billion) & Volume (Million Units) Analysis By Region, 2020 to 2024
    • Current Market Size Value (USD Billion) & Volume (Million Units) Analysis and Forecast By Region, 2025 to 2035
      • North America
      • Latin America
      • Europe
      • East Asia
      • South Asia
      • Oceania
      • MEA
    • Market Attractiveness Analysis By Region
  12. North America Market Analysis 2020 to 2024 and Forecast 2025 to 2035, By Country
    • Historical Market Size Value (USD Billion) & Volume (Million Units) Trend Analysis By Market Taxonomy, 2020 to 2024
    • Market Size Value (USD Billion) & Volume (Million Units) Forecast By Market Taxonomy, 2025 to 2035
      • By Country
        • U.S.
        • Canada
      • By Product Type
      • By End User
      • By Application
      • By Material Composition
      • By Distribution Channel
    • Market Attractiveness Analysis
      • By Country
      • By Product Type
      • By End User
      • By Application
      • By Material Composition
      • By Distribution Channel
    • Key Takeaways
  13. Latin America Market Analysis 2020 to 2024 and Forecast 2025 to 2035, By Country
    • Historical Market Size Value (USD Billion) & Volume (Million Units) Trend Analysis By Market Taxonomy, 2020 to 2024
    • Market Size Value (USD Billion) & Volume (Million Units) Forecast By Market Taxonomy, 2025 to 2035
      • By Country
        • Brazil
        • Mexico
        • Argentina
        • Chile
        • Peru
        • Rest of Latin America
      • By Product Type
      • By End User
      • By Application
      • By Material Composition
      • By Distribution Channel
    • Market Attractiveness Analysis
      • By Country
      • By Product Type
      • By End User
      • By Application
      • By Material Composition
      • By Distribution Channel
    • Key Takeaways
  14. Europe Market Analysis 2020 to 2024 and Forecast 2025 to 2035, By Country
    • Historical Market Size Value (USD Billion) & Volume (Million Units) Trend Analysis By Market Taxonomy, 2020 to 2024
    • Market Size Value (USD Billion) & Volume (Million Units) Forecast By Market Taxonomy, 2025 to 2035
      • By Country
        • Germany
        • Italy
        • France
        • U.K.
        • Spain
        • Russia
        • BENELUX
        • Rest of Europe
      • By Product Type
      • By End User
      • By Application
      • By Material Composition
      • By Distribution Channel
    • Market Attractiveness Analysis
      • By Country
      • By Product Type
      • By End User
      • By Application
      • By Material Composition
      • By Distribution Channel
    • Key Takeaways
  15. East Asia Market Analysis 2020 to 2024 and Forecast 2025 to 2035, By Country
    • Historical Market Size Value (USD Billion) & Volume (Million Units) Trend Analysis By Market Taxonomy, 2020 to 2024
    • Market Size Value (USD Billion) & Volume (Million Units) Forecast By Market Taxonomy, 2025 to 2035
      • By Country
        • China
        • Japan
        • South Korea
      • By Product Type
      • By End User
      • By Application
      • By Material Composition
      • By Distribution Channel
    • Market Attractiveness Analysis
      • By Country
      • By Product Type
      • By End User
      • By Application
      • By Material Composition
      • By Distribution Channel
    • Key Takeaways
  16. South Asia Market Analysis 2020 to 2024 and Forecast 2025 to 2035, By Country
    • Historical Market Size Value (USD Billion) & Volume (Million Units) Trend Analysis By Market Taxonomy, 2020 to 2024
    • Market Size Value (USD Billion) & Volume (Million Units) Forecast By Market Taxonomy, 2025 to 2035
      • By Country
        • India
        • Thailand
        • Malaysia
        • Indonesia
        • Rest of South Asia
      • By Product Type
      • By End User
      • By Application
      • By Material Composition
      • By Distribution Channel
    • Market Attractiveness Analysis
      • By Country
      • By Product Type
      • By End User
      • By Application
      • By Material Composition
      • By Distribution Channel
    • Key Takeaways
  17. Oceania Market Analysis 2020 to 2024 and Forecast 2025 to 2035, By Country
    • Historical Market Size Value (USD Billion) & Volume (Million Units) Trend Analysis By Market Taxonomy, 2020 to 2024
    • Market Size Value (USD Billion) & Volume (Million Units) Forecast By Market Taxonomy, 2025 to 2035
      • By Country
        • Australia
        • New Zealand
      • By Product Type
      • By End User
      • By Application
      • By Material Composition
      • By Distribution Channel
    • Market Attractiveness Analysis
      • By Country
      • By Product Type
      • By End User
      • By Application
      • By Material Composition
      • By Distribution Channel
    • Key Takeaways
  18. MEA Market Analysis 2020 to 2024 and Forecast 2025 to 2035, By Country
    • Historical Market Size Value (USD Billion) & Volume (Million Units) Trend Analysis By Market Taxonomy, 2020 to 2024
    • Market Size Value (USD Billion) & Volume (Million Units) Forecast By Market Taxonomy, 2025 to 2035
      • By Country
        • GCC
        • Rest of MEA
      • By Product Type
      • By End User
      • By Application
      • By Material Composition
      • By Distribution Channel
    • Market Attractiveness Analysis
      • By Country
      • By Product Type
      • By End User
      • By Application
      • By Material Composition
      • By Distribution Channel
    • Key Takeaways
  19. Key Countries Market Analysis
    • U.S.
      • Pricing Analysis
      • Market Share Analysis, 2024
        • By Product Type
        • By End User
        • By Application
        • By Material Composition
        • By Distribution Channel
    • Canada
      • Pricing Analysis
      • Market Share Analysis, 2024
        • By Product Type
        • By End User
        • By Application
        • By Material Composition
        • By Distribution Channel
    • Brazil
      • Pricing Analysis
      • Market Share Analysis, 2024
        • By Product Type
        • By End User
        • By Application
        • By Material Composition
        • By Distribution Channel
    • Mexico
      • Pricing Analysis
      • Market Share Analysis, 2024
        • By Product Type
        • By End User
        • By Application
        • By Material Composition
        • By Distribution Channel
    • Argentina
      • Pricing Analysis
      • Market Share Analysis, 2024
        • By Product Type
        • By End User
        • By Application
        • By Material Composition
        • By Distribution Channel
  20. Market Structure Analysis
    • Competition Dashboard
    • Competition Benchmarking
    • Market Share Analysis of Top Players
      • By Regional
      • By Product Type
      • By End User
      • By Application
      • By Material Composition
      • By Distribution Channel
  21. Competition Analysis
    • Competition Deep Dive
      • B.u.W. Schmidt
        • Overview
        • Product Portfolio
        • Profitability by Market Segments (Product/Age /Sales Channel/Region)
        • Sales Footprint
        • Strategy Overview
          • Marketing Strategy
          • Product Strategy
          • Channel Strategy
      • Bird & Cronin
        • Overview
        • Product Portfolio
        • Profitability by Market Segments (Product/Age /Sales Channel/Region)
        • Sales Footprint
        • Strategy Overview
          • Marketing Strategy
          • Product Strategy
          • Channel Strategy
      • Body Products
        • Overview
        • Product Portfolio
        • Profitability by Market Segments (Product/Age /Sales Channel/Region)
        • Sales Footprint
        • Strategy Overview
          • Marketing Strategy
          • Product Strategy
          • Channel Strategy
      • Chattanooga International
        • Overview
        • Product Portfolio
        • Profitability by Market Segments (Product/Age /Sales Channel/Region)
        • Sales Footprint
        • Strategy Overview
          • Marketing Strategy
          • Product Strategy
          • Channel Strategy
      • Fysiomed
        • Overview
        • Product Portfolio
        • Profitability by Market Segments (Product/Age /Sales Channel/Region)
        • Sales Footprint
        • Strategy Overview
          • Marketing Strategy
          • Product Strategy
          • Channel Strategy
      • KaWeCo
        • Overview
        • Product Portfolio
        • Profitability by Market Segments (Product/Age /Sales Channel/Region)
        • Sales Footprint
        • Strategy Overview
          • Marketing Strategy
          • Product Strategy
          • Channel Strategy
  22. Assumptions & Acronyms Used
  23. Research Methodology

List of Tables

  • Table 1: Global Market Value (USD Billion) Forecast by Region, 2020 to 2035
  • Table 2: Global Market Volume (Million Units) Forecast by Region, 2020 to 2035
  • Table 3: Global Market Value (USD Billion) Forecast by Product Type, 2020 to 2035
  • Table 4: Global Market Volume (Million Units) Forecast by Product Type, 2020 to 2035
  • Table 5: Global Market Value (USD Billion) Forecast by End User, 2020 to 2035
  • Table 6: Global Market Volume (Million Units) Forecast by End User, 2020 to 2035
  • Table 7: Global Market Value (USD Billion) Forecast by Application, 2020 to 2035
  • Table 8: Global Market Volume (Million Units) Forecast by Application, 2020 to 2035
  • Table 9: Global Market Value (USD Billion) Forecast by Material Composition, 2020 to 2035
  • Table 10: Global Market Volume (Million Units) Forecast by Material Composition, 2020 to 2035
  • Table 11: Global Market Value (USD Billion) Forecast by Distribution Channel, 2020 to 2035
  • Table 12: Global Market Volume (Million Units) Forecast by Distribution Channel, 2020 to 2035
  • Table 13: North America Market Value (USD Billion) Forecast by Country, 2020 to 2035
  • Table 14: North America Market Volume (Million Units) Forecast by Country, 2020 to 2035
  • Table 15: North America Market Value (USD Billion) Forecast by Product Type, 2020 to 2035
  • Table 16: North America Market Volume (Million Units) Forecast by Product Type, 2020 to 2035
  • Table 17: North America Market Value (USD Billion) Forecast by End User, 2020 to 2035
  • Table 18: North America Market Volume (Million Units) Forecast by End User, 2020 to 2035
  • Table 19: North America Market Value (USD Billion) Forecast by Application, 2020 to 2035
  • Table 20: North America Market Volume (Million Units) Forecast by Application, 2020 to 2035
  • Table 21: North America Market Value (USD Billion) Forecast by Material Composition, 2020 to 2035
  • Table 22: North America Market Volume (Million Units) Forecast by Material Composition, 2020 to 2035
  • Table 23: North America Market Value (USD Billion) Forecast by Distribution Channel, 2020 to 2035
  • Table 24: North America Market Volume (Million Units) Forecast by Distribution Channel, 2020 to 2035
  • Table 25: Latin America Market Value (USD Billion) Forecast by Country, 2020 to 2035
  • Table 26: Latin America Market Volume (Million Units) Forecast by Country, 2020 to 2035
  • Table 27: Latin America Market Value (USD Billion) Forecast by Product Type, 2020 to 2035
  • Table 28: Latin America Market Volume (Million Units) Forecast by Product Type, 2020 to 2035
  • Table 29: Latin America Market Value (USD Billion) Forecast by End User, 2020 to 2035
  • Table 30: Latin America Market Volume (Million Units) Forecast by End User, 2020 to 2035
  • Table 31: Latin America Market Value (USD Billion) Forecast by Application, 2020 to 2035
  • Table 32: Latin America Market Volume (Million Units) Forecast by Application, 2020 to 2035
  • Table 33: Latin America Market Value (USD Billion) Forecast by Material Composition, 2020 to 2035
  • Table 34: Latin America Market Volume (Million Units) Forecast by Material Composition, 2020 to 2035
  • Table 35: Latin America Market Value (USD Billion) Forecast by Distribution Channel, 2020 to 2035
  • Table 36: Latin America Market Volume (Million Units) Forecast by Distribution Channel, 2020 to 2035
  • Table 37: Europe Market Value (USD Billion) Forecast by Country, 2020 to 2035
  • Table 38: Europe Market Volume (Million Units) Forecast by Country, 2020 to 2035
  • Table 39: Europe Market Value (USD Billion) Forecast by Product Type, 2020 to 2035
  • Table 40: Europe Market Volume (Million Units) Forecast by Product Type, 2020 to 2035
  • Table 41: Europe Market Value (USD Billion) Forecast by End User, 2020 to 2035
  • Table 42: Europe Market Volume (Million Units) Forecast by End User, 2020 to 2035
  • Table 43: Europe Market Value (USD Billion) Forecast by Application, 2020 to 2035
  • Table 44: Europe Market Volume (Million Units) Forecast by Application, 2020 to 2035
  • Table 45: Europe Market Value (USD Billion) Forecast by Material Composition, 2020 to 2035
  • Table 46: Europe Market Volume (Million Units) Forecast by Material Composition, 2020 to 2035
  • Table 47: Europe Market Value (USD Billion) Forecast by Distribution Channel, 2020 to 2035
  • Table 48: Europe Market Volume (Million Units) Forecast by Distribution Channel, 2020 to 2035
  • Table 49: East Asia Market Value (USD Billion) Forecast by Country, 2020 to 2035
  • Table 50: East Asia Market Volume (Million Units) Forecast by Country, 2020 to 2035
  • Table 51: East Asia Market Value (USD Billion) Forecast by Product Type, 2020 to 2035
  • Table 52: East Asia Market Volume (Million Units) Forecast by Product Type, 2020 to 2035
  • Table 53: East Asia Market Value (USD Billion) Forecast by End User, 2020 to 2035
  • Table 54: East Asia Market Volume (Million Units) Forecast by End User, 2020 to 2035
  • Table 55: East Asia Market Value (USD Billion) Forecast by Application, 2020 to 2035
  • Table 56: East Asia Market Volume (Million Units) Forecast by Application, 2020 to 2035
  • Table 57: East Asia Market Value (USD Billion) Forecast by Material Composition, 2020 to 2035
  • Table 58: East Asia Market Volume (Million Units) Forecast by Material Composition, 2020 to 2035
  • Table 59: East Asia Market Value (USD Billion) Forecast by Distribution Channel, 2020 to 2035
  • Table 60: East Asia Market Volume (Million Units) Forecast by Distribution Channel, 2020 to 2035
  • Table 61: South Asia Market Value (USD Billion) Forecast by Country, 2020 to 2035
  • Table 62: South Asia Market Volume (Million Units) Forecast by Country, 2020 to 2035
  • Table 63: South Asia Market Value (USD Billion) Forecast by Product Type, 2020 to 2035
  • Table 64: South Asia Market Volume (Million Units) Forecast by Product Type, 2020 to 2035
  • Table 65: South Asia Market Value (USD Billion) Forecast by End User, 2020 to 2035
  • Table 66: South Asia Market Volume (Million Units) Forecast by End User, 2020 to 2035
  • Table 67: South Asia Market Value (USD Billion) Forecast by Application, 2020 to 2035
  • Table 68: South Asia Market Volume (Million Units) Forecast by Application, 2020 to 2035
  • Table 69: South Asia Market Value (USD Billion) Forecast by Material Composition, 2020 to 2035
  • Table 70: South Asia Market Volume (Million Units) Forecast by Material Composition, 2020 to 2035
  • Table 71: South Asia Market Value (USD Billion) Forecast by Distribution Channel, 2020 to 2035
  • Table 72: South Asia Market Volume (Million Units) Forecast by Distribution Channel, 2020 to 2035
  • Table 73: Oceania Market Value (USD Billion) Forecast by Country, 2020 to 2035
  • Table 74: Oceania Market Volume (Million Units) Forecast by Country, 2020 to 2035
  • Table 75: Oceania Market Value (USD Billion) Forecast by Product Type, 2020 to 2035
  • Table 76: Oceania Market Volume (Million Units) Forecast by Product Type, 2020 to 2035
  • Table 77: Oceania Market Value (USD Billion) Forecast by End User, 2020 to 2035
  • Table 78: Oceania Market Volume (Million Units) Forecast by End User, 2020 to 2035
  • Table 79: Oceania Market Value (USD Billion) Forecast by Application, 2020 to 2035
  • Table 80: Oceania Market Volume (Million Units) Forecast by Application, 2020 to 2035
  • Table 81: Oceania Market Value (USD Billion) Forecast by Material Composition, 2020 to 2035
  • Table 82: Oceania Market Volume (Million Units) Forecast by Material Composition, 2020 to 2035
  • Table 83: Oceania Market Value (USD Billion) Forecast by Distribution Channel, 2020 to 2035
  • Table 84: Oceania Market Volume (Million Units) Forecast by Distribution Channel, 2020 to 2035
  • Table 85: MEA Market Value (USD Billion) Forecast by Country, 2020 to 2035
  • Table 86: MEA Market Volume (Million Units) Forecast by Country, 2020 to 2035
  • Table 87: MEA Market Value (USD Billion) Forecast by Product Type, 2020 to 2035
  • Table 88: MEA Market Volume (Million Units) Forecast by Product Type, 2020 to 2035
  • Table 89: MEA Market Value (USD Billion) Forecast by End User, 2020 to 2035
  • Table 90: MEA Market Volume (Million Units) Forecast by End User, 2020 to 2035
  • Table 91: MEA Market Value (USD Billion) Forecast by Application, 2020 to 2035
  • Table 92: MEA Market Volume (Million Units) Forecast by Application, 2020 to 2035
  • Table 93: MEA Market Value (USD Billion) Forecast by Material Composition, 2020 to 2035
  • Table 94: MEA Market Volume (Million Units) Forecast by Material Composition, 2020 to 2035
  • Table 95: MEA Market Value (USD Billion) Forecast by Distribution Channel, 2020 to 2035
  • Table 96: MEA Market Volume (Million Units) Forecast by Distribution Channel, 2020 to 2035

List of Figures

  • Figure 1: Global Market Volume (Million Units) Forecast 2020 to 2035
  • Figure 2: Global Market Pricing Analysis
  • Figure 3: Global Market Value (USD Billion) Forecast 2020 to 2035
  • Figure 4: Global Market Value Share and BPS Analysis by Product Type, 2025 and 2035
  • Figure 5: Global Market Y-o-Y Growth Comparison by Product Type, 2025 to 2035
  • Figure 6: Global Market Attractiveness Analysis by Product Type
  • Figure 7: Global Market Value Share and BPS Analysis by End User, 2025 and 2035
  • Figure 8: Global Market Y-o-Y Growth Comparison by End User, 2025 to 2035
  • Figure 9: Global Market Attractiveness Analysis by End User
  • Figure 10: Global Market Value Share and BPS Analysis by Application, 2025 and 2035
  • Figure 11: Global Market Y-o-Y Growth Comparison by Application, 2025 to 2035
  • Figure 12: Global Market Attractiveness Analysis by Application
  • Figure 13: Global Market Value Share and BPS Analysis by Material Composition, 2025 and 2035
  • Figure 14: Global Market Y-o-Y Growth Comparison by Material Composition, 2025 to 2035
  • Figure 15: Global Market Attractiveness Analysis by Material Composition
  • Figure 16: Global Market Value Share and BPS Analysis by Distribution Channel, 2025 and 2035
  • Figure 17: Global Market Y-o-Y Growth Comparison by Distribution Channel, 2025 to 2035
  • Figure 18: Global Market Attractiveness Analysis by Distribution Channel
  • Figure 19: Global Market Value (USD Billion) Share and BPS Analysis by Region, 2025 and 2035
  • Figure 20: Global Market Y-o-Y Growth Comparison by Region, 2025 to 2035
  • Figure 21: Global Market Attractiveness Analysis by Region
  • Figure 22: North America Market Incremental $ Opportunity, 2025 to 2035
  • Figure 23: Latin America Market Incremental $ Opportunity, 2025 to 2035
  • Figure 24: Europe Market Incremental $ Opportunity, 2025 to 2035
  • Figure 25: East Asia Market Incremental $ Opportunity, 2025 to 2035
  • Figure 26: South Asia Market Incremental $ Opportunity, 2025 to 2035
  • Figure 27: Oceania Market Incremental $ Opportunity, 2025 to 2035
  • Figure 28: MEA Market Incremental $ Opportunity, 2025 to 2035
  • Figure 29: North America Market Value Share and BPS Analysis by Country, 2025 and 2035
  • Figure 30: North America Market Value Share and BPS Analysis by Product Type, 2025 and 2035
  • Figure 31: North America Market Y-o-Y Growth Comparison by Product Type, 2025 to 2035
  • Figure 32: North America Market Attractiveness Analysis by Product Type
  • Figure 33: North America Market Value Share and BPS Analysis by End User, 2025 and 2035
  • Figure 34: North America Market Y-o-Y Growth Comparison by End User, 2025 to 2035
  • Figure 35: North America Market Attractiveness Analysis by End User
  • Figure 36: North America Market Value Share and BPS Analysis by Application, 2025 and 2035
  • Figure 37: North America Market Y-o-Y Growth Comparison by Application, 2025 to 2035
  • Figure 38: North America Market Attractiveness Analysis by Application
  • Figure 39: North America Market Value Share and BPS Analysis by Material Composition, 2025 and 2035
  • Figure 40: North America Market Y-o-Y Growth Comparison by Material Composition, 2025 to 2035
  • Figure 41: North America Market Attractiveness Analysis by Material Composition
  • Figure 42: North America Market Value Share and BPS Analysis by Distribution Channel, 2025 and 2035
  • Figure 43: North America Market Y-o-Y Growth Comparison by Distribution Channel, 2025 to 2035
  • Figure 44: North America Market Attractiveness Analysis by Distribution Channel
  • Figure 45: Latin America Market Value Share and BPS Analysis by Country, 2025 and 2035
  • Figure 46: Latin America Market Value Share and BPS Analysis by Product Type, 2025 and 2035
  • Figure 47: Latin America Market Y-o-Y Growth Comparison by Product Type, 2025 to 2035
  • Figure 48: Latin America Market Attractiveness Analysis by Product Type
  • Figure 49: Latin America Market Value Share and BPS Analysis by End User, 2025 and 2035
  • Figure 50: Latin America Market Y-o-Y Growth Comparison by End User, 2025 to 2035
  • Figure 51: Latin America Market Attractiveness Analysis by End User
  • Figure 52: Latin America Market Value Share and BPS Analysis by Application, 2025 and 2035
  • Figure 53: Latin America Market Y-o-Y Growth Comparison by Application, 2025 to 2035
  • Figure 54: Latin America Market Attractiveness Analysis by Application
  • Figure 55: Latin America Market Value Share and BPS Analysis by Material Composition, 2025 and 2035
  • Figure 56: Latin America Market Y-o-Y Growth Comparison by Material Composition, 2025 to 2035
  • Figure 57: Latin America Market Attractiveness Analysis by Material Composition
  • Figure 58: Latin America Market Value Share and BPS Analysis by Distribution Channel, 2025 and 2035
  • Figure 59: Latin America Market Y-o-Y Growth Comparison by Distribution Channel, 2025 to 2035
  • Figure 60: Latin America Market Attractiveness Analysis by Distribution Channel
  • Figure 61: Europe Market Value Share and BPS Analysis by Country, 2025 and 2035
  • Figure 62: Europe Market Value Share and BPS Analysis by Product Type, 2025 and 2035
  • Figure 63: Europe Market Y-o-Y Growth Comparison by Product Type, 2025 to 2035
  • Figure 64: Europe Market Attractiveness Analysis by Product Type
  • Figure 65: Europe Market Value Share and BPS Analysis by End User, 2025 and 2035
  • Figure 66: Europe Market Y-o-Y Growth Comparison by End User, 2025 to 2035
  • Figure 67: Europe Market Attractiveness Analysis by End User
  • Figure 68: Europe Market Value Share and BPS Analysis by Application, 2025 and 2035
  • Figure 69: Europe Market Y-o-Y Growth Comparison by Application, 2025 to 2035
  • Figure 70: Europe Market Attractiveness Analysis by Application
  • Figure 71: Europe Market Value Share and BPS Analysis by Material Composition, 2025 and 2035
  • Figure 72: Europe Market Y-o-Y Growth Comparison by Material Composition, 2025 to 2035
  • Figure 73: Europe Market Attractiveness Analysis by Material Composition
  • Figure 74: Europe Market Value Share and BPS Analysis by Distribution Channel, 2025 and 2035
  • Figure 75: Europe Market Y-o-Y Growth Comparison by Distribution Channel, 2025 to 2035
  • Figure 76: Europe Market Attractiveness Analysis by Distribution Channel
  • Figure 77: East Asia Market Value Share and BPS Analysis by Country, 2025 and 2035
  • Figure 78: East Asia Market Value Share and BPS Analysis by Product Type, 2025 and 2035
  • Figure 79: East Asia Market Y-o-Y Growth Comparison by Product Type, 2025 to 2035
  • Figure 80: East Asia Market Attractiveness Analysis by Product Type
  • Figure 81: East Asia Market Value Share and BPS Analysis by End User, 2025 and 2035
  • Figure 82: East Asia Market Y-o-Y Growth Comparison by End User, 2025 to 2035
  • Figure 83: East Asia Market Attractiveness Analysis by End User
  • Figure 84: East Asia Market Value Share and BPS Analysis by Application, 2025 and 2035
  • Figure 85: East Asia Market Y-o-Y Growth Comparison by Application, 2025 to 2035
  • Figure 86: East Asia Market Attractiveness Analysis by Application
  • Figure 87: East Asia Market Value Share and BPS Analysis by Material Composition, 2025 and 2035
  • Figure 88: East Asia Market Y-o-Y Growth Comparison by Material Composition, 2025 to 2035
  • Figure 89: East Asia Market Attractiveness Analysis by Material Composition
  • Figure 90: East Asia Market Value Share and BPS Analysis by Distribution Channel, 2025 and 2035
  • Figure 91: East Asia Market Y-o-Y Growth Comparison by Distribution Channel, 2025 to 2035
  • Figure 92: East Asia Market Attractiveness Analysis by Distribution Channel
  • Figure 93: South Asia Market Value Share and BPS Analysis by Country, 2025 and 2035
  • Figure 94: South Asia Market Value Share and BPS Analysis by Product Type, 2025 and 2035
  • Figure 95: South Asia Market Y-o-Y Growth Comparison by Product Type, 2025 to 2035
  • Figure 96: South Asia Market Attractiveness Analysis by Product Type
  • Figure 97: South Asia Market Value Share and BPS Analysis by End User, 2025 and 2035
  • Figure 98: South Asia Market Y-o-Y Growth Comparison by End User, 2025 to 2035
  • Figure 99: South Asia Market Attractiveness Analysis by End User
  • Figure 100: South Asia Market Value Share and BPS Analysis by Application, 2025 and 2035
  • Figure 101: South Asia Market Y-o-Y Growth Comparison by Application, 2025 to 2035
  • Figure 102: South Asia Market Attractiveness Analysis by Application
  • Figure 103: South Asia Market Value Share and BPS Analysis by Material Composition, 2025 and 2035
  • Figure 104: South Asia Market Y-o-Y Growth Comparison by Material Composition, 2025 to 2035
  • Figure 105: South Asia Market Attractiveness Analysis by Material Composition
  • Figure 106: South Asia Market Value Share and BPS Analysis by Distribution Channel, 2025 and 2035
  • Figure 107: South Asia Market Y-o-Y Growth Comparison by Distribution Channel, 2025 to 2035
  • Figure 108: South Asia Market Attractiveness Analysis by Distribution Channel
  • Figure 109: Oceania Market Value Share and BPS Analysis by Country, 2025 and 2035
  • Figure 110: Oceania Market Value Share and BPS Analysis by Product Type, 2025 and 2035
  • Figure 111: Oceania Market Y-o-Y Growth Comparison by Product Type, 2025 to 2035
  • Figure 112: Oceania Market Attractiveness Analysis by Product Type
  • Figure 113: Oceania Market Value Share and BPS Analysis by End User, 2025 and 2035
  • Figure 114: Oceania Market Y-o-Y Growth Comparison by End User, 2025 to 2035
  • Figure 115: Oceania Market Attractiveness Analysis by End User
  • Figure 116: Oceania Market Value Share and BPS Analysis by Application, 2025 and 2035
  • Figure 117: Oceania Market Y-o-Y Growth Comparison by Application, 2025 to 2035
  • Figure 118: Oceania Market Attractiveness Analysis by Application
  • Figure 119: Oceania Market Value Share and BPS Analysis by Material Composition, 2025 and 2035
  • Figure 120: Oceania Market Y-o-Y Growth Comparison by Material Composition, 2025 to 2035
  • Figure 121: Oceania Market Attractiveness Analysis by Material Composition
  • Figure 122: Oceania Market Value Share and BPS Analysis by Distribution Channel, 2025 and 2035
  • Figure 123: Oceania Market Y-o-Y Growth Comparison by Distribution Channel, 2025 to 2035
  • Figure 124: Oceania Market Attractiveness Analysis by Distribution Channel
  • Figure 125: MEA Market Value Share and BPS Analysis by Country, 2025 and 2035
  • Figure 126: MEA Market Value Share and BPS Analysis by Product Type, 2025 and 2035
  • Figure 127: MEA Market Y-o-Y Growth Comparison by Product Type, 2025 to 2035
  • Figure 128: MEA Market Attractiveness Analysis by Product Type
  • Figure 129: MEA Market Value Share and BPS Analysis by End User, 2025 and 2035
  • Figure 130: MEA Market Y-o-Y Growth Comparison by End User, 2025 to 2035
  • Figure 131: MEA Market Attractiveness Analysis by End User
  • Figure 132: MEA Market Value Share and BPS Analysis by Application, 2025 and 2035
  • Figure 133: MEA Market Y-o-Y Growth Comparison by Application, 2025 to 2035
  • Figure 134: MEA Market Attractiveness Analysis by Application
  • Figure 135: MEA Market Value Share and BPS Analysis by Material Composition, 2025 and 2035
  • Figure 136: MEA Market Y-o-Y Growth Comparison by Material Composition, 2025 to 2035
  • Figure 137: MEA Market Attractiveness Analysis by Material Composition
  • Figure 138: MEA Market Value Share and BPS Analysis by Distribution Channel, 2025 and 2035
  • Figure 139: MEA Market Y-o-Y Growth Comparison by Distribution Channel, 2025 to 2035
  • Figure 140: MEA Market Attractiveness Analysis by Distribution Channel
  • Figure 141: Global Market - Tier Structure Analysis
  • Figure 142: Global Market - Company Share Analysis

Frequently Asked Questions

What is the estimated market size of the cold packs industry in 2025?

The industry is valued at USD 1.8 billion in 2025.

What is the projected industry size of the cold packs industry by 2035?

It is forecasted to reach USD 3.5 billion by 2035.

What is the expected CAGR for the cold packs industry between 2025 and 2035?

The industry is anticipated to grow at a CAGR of 6.9% during this period.

Which segment is expected to lead the cold packs market in 2035?

Reusable gel packs are projected to lead the market with a 65% share in 2035.

Which region is expected to witness the highest growth in the cold packs market?

North America, particularly the United States, is expected to be the key growth region with a projected growth rate of 6.1%.

Explore Similar Insights

Future Market Insights

Cold Packs Market