Reports

- Global Locations -

Headquarters

Future Market Insights, Inc.

Christiana Corporate, 200
Continental Drive, Suite 401,
Newark, Delaware - 19713,
United States

T: +1-347-918-3531

Americas

Future Market Insights, Inc.

616 Corporate Way, Suite 2-9018,
Valley Cottage, NY 10989, United States

MEA

Future Market Insights

1602-6 Jumeirah Bay X2 Tower, Plot No: JLT-PH2-X2A,
Jumeirah Lakes Towers, Dubai,
United Arab Emirates

Europe

Future Market Insights

3rd Floor, 207 Regent Street,
W1B 3HH London
United Kingdom

T: + 44 (0) 20 8123 9659

Asia Pacific

Future Market Insights

IndiaLand Global Tech Park, Unit UG-1, Behind Grand HighStreet, Phase 1, Hinjawadi, MH, Pune – 411057, India

Cold Gas Spray Coating Market Outlook (2023 to 2033)

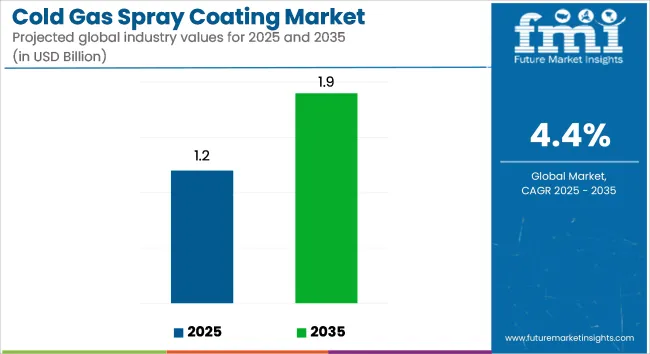
Global cold gas spray coating sales revenue is expected to total US$ 1.1 billion in 2023. Over the forecast period from 2023 to 2033, global cold gas spray coating demand is predicted to rise at a 4.4% CAGR.

By 2033, the global cold gas spray coating market size is set to reach US$ 1.6 billion. It is predicted to create an absolute $ opportunity of US$ 560.0 million over the projection period.

Demand is expected to remain high for high-pressure cold gas coating technology during the assessment period. This is due to its several advantages including higher coating density and improved adhesion.

The high pressure segment grew at a 5.6% CAGR historically from 2018 to 2022. In the forecast period, it is projected to thrive at a CAGR of 4.2%.

A material processing technique used to apply coatings to several surfaces is referred to as cold gas spray coating or supersonic particle deposition. This coating deposition technology is becoming an ideal alternative to other conventional technologies due to its multiple benefits.

Cold gas spray coating utilizes kinetic energy for coating material rather than thermal energy. In this technique, solid powders are accelerated above a critical velocity by using a carrier gas such as helium or nitrogen for particle adhesion.

The ability of cold gas spray coating to operate at much lower temperatures preserves the properties of the material being sprayed. As cold spray can easily deposit temperature-sensitive materials, it is becoming a popular technique for preparing coatings.

Few of the benefits of cold gas spray coating technology that are encouraging its adoption include versatility, dense coating, reduced oxidation, low energy consumption, etc.

Cold gas spray coatings can be used with a variety of materials such as metals, polymers, composites, and ceramics. This versatility of cold gas spray coating makes it applicable in sectors such as medical devices, aerospace, automotive, and electronics.

Unlike traditional thermal spray techniques, cold spray coatings exhibit higher density and lower porosity. Owing to these multiple benefits, cold gas spray coating is becoming an ideal coating technology across the globe.

Rising application of cold gas spray coating across sectors such as automotive, electronics, and aerospace is expected to drive the target market forward during the forecast period.

Attributes Key Insights
Estimated Global Cold Gas Spray Coating Market Value (2023) US$ 1.1 billion
Projected Size (2033) US$ 1.6 billion
Value-based CAGR (2023 to 2033) 4.4%
United States Market CAGR (2023 to 2033) 4.3%

Don't pay for what you don't need

Customize your report by selecting specific countries or regions and save 30%!

Historical Performance of Cold Gas Spray Coating Market vs Future Projections

According to a Future Market Insights (FMI) analyst, the global cold gas spray coating industry experienced a steady CAGR of 5.7% historically from 2018 to 2022. It attained a valuation of about US$ 1.0 billion at the end of 2022. In the forecast period, global demand for cold gas spray coating is expected to rise at a 4.4% CAGR.

Data Points Key Statistics
Market Value in 2018 US$ 801.1 million
Market Value in 2022 US$ 1 billion
CAGR from 2018 to 2022 5.7%

The emergence of cold gas spray coating has set new standards in coating technologies across the globe. This technology allows companies to apply a wide range of materials onto substrates without significant thermal degradation.

Increasing usage of cold gas spray coating for depositing new and advanced materials such as ceramics, composite materials, polymers, and specialized metals is expected to boost the target market through 2033.

Rising awareness about the benefits of cold gas spray coatings is another key factor expected to elevate demand in the global market.

Increasing usage of cold spray coatings in aerospace and automotive sectors for applications such as repair & maintenance is likely to create growth prospects for the target market.

Automotive and aerospace sectors are showing a keen interest in cold gas spray coating due to its tendency to provide excellent surface protection and improve properties of materials & components.

Key Factors Driving the Global Cold Spray Coating Industry

  • Growing demand for high-performance and corrosion-resistant coatings from several sectors is expected to boost the cold gas spray coating industry
  • Shifting preference from traditional spraying & coating methods to advanced coating technologies is likely to fuel cold gas spray coating demand
  • Rising inclination towards eco-friendly coating might bode well for the market
  • Robust growth of end-use sectors such as automotive, aerospace, and electronics is anticipated to boost cold gas spray coating sales revenues
  • High adoption of advanced amorphous and nanostructured in sectors such as electronics and medical to open new growth prospects for cold gas spray coating manufacturers
  • Surging demand for consumer electronics to create ample growth opportunities for companies
  • Development of specialized powder materials designed for cold spray applications is expected to support market expansion
  • Favorable government regulations for encouraging the adoption of lightweight materials in automotive sector to improve fuel efficiency are likely to propel market growth
Nikhil Kaitwade
Nikhil Kaitwade

Principal Consultant

Talk to Analyst

Find your sweet spots for generating winning opportunities in this market.

Comparative View of the Cold Gas Spray Coating Market

The global cold gas spray coating industry is likely to be impacted by the peer or tangential markets in the chemicals & materials sector. These include other types of markets such as the coating additives market and high-temperature ceramics market.

On analysis of these related industries Future Market Insights (FMI) has found profound insights that might be helpful for developing unique differentiating strategies to pursue for growth and opportunity.

For instance, cold gas spray coating companies are looking to develop new techniques and technologies for spraying thin layers of ceramics to improve surface properties. This might help them to boost revenues and improve their share in different markets including high temperature ceramics.

Below table provides insights into related markets of cold gas spray coating industry that might influence its growth trajectory over the assessment period.

Coating Additives Market:

Attributes Coating Additives Market
CAGR (2023 to 2033) 4.8%
Market Value (2023) US$ 11.12 billion
Growth Factor Rising demand for coating additives from sectors such as automotive and industrial is driving the global market forward.
Key Trend Growing preference towards eco-friendly coating additives to foster market development during the assessment period.

High Temperature Ceramics Market:

Attributes High Temperature Ceramics Market
CAGR (2023 to 2033) 7.1%
Market Value (2033) US$ 5.0 billion
Growth Factor Growing usage of high temperature ceramics across sectors such as aerospace, automotive, and power generation is providing impetus for market growth.
Key Trend Increasing demand for high-temperature materials in several applications is expected to boost sales in the market.

Country-wise Insights

The below table highlights the market revenue by key countries and their respective growth rates. The United States, China, and Japan are the top three dominant markets with predicted valuations of US$ 283.5 million, US$ 383.5 million, and US$ 310.0 million respectively in 2033.

While these three markets are expected to retain their dominance, countries such as South Korea and the United Kingdom are also expected to create lucrative opportunities for companies.

Countries United States
Projected CAGR (2023 to 2033) 4.3%
Market Value (2033) US$ 283.5 million
Historical CAGR (2018 to 2022) 5.7%
Countries United Kingdom
Projected CAGR (2023 to 2033) 4.1%
Market Value (2033) US$ 60.2 million
Historical CAGR (2018 to 2022) 5.5%
Countries China
Projected CAGR (2023 to 2033) 4.3%
Market Value (2033) US$ 383.5 million
Historical CAGR (2018 to 2022) 5.6%
Countries Japan
Projected CAGR (2023 to 2033) 4.3%
Market Value (2033) US$ 310.0 million
Historical CAGR (2018 to 2022) 5.5%
Countries South Korea
Projected CAGR (2023 to 2033) 4.0%
Market Value (2033) US$ 92.8 million
Historical CAGR (2018 to 2022) 5.1%

Rising Adoption in Aerospace & Defense Fuelling Demand in the United States

The United States cold gas spray coating market registered a 5.7% CAGR during the historical period. Looking ahead, cold gas spray coating demand in the country is set to increase at 4.3% CAGR during the assessment period.

By 2033, the United States is predicted to exceed a valuation of US$ 283.5 million. It is expected to generate an absolute $ growth of US$ 97.4 million during the forecast period.

Increasing usage of cold gas spray coating across the booming aerospace & defense sector is a prominent factor driving the United States market forward. Similarly, rising demand for high-performance coatings in aerospace sector is expected to boost revenues in the country.

Thanks to its unique advantages and capabilities, cold gas spray coating technology is being widely used across the United States aerospace & defense sector.

In the aerospace & defense sector, cold gas spray coating can provide protective coatings, enhance performance, and repair & restore components.

Growing focus of aerospace & defense and automotive sectors on reducing weight of components and improving performance is another key factor fostering market development.

Booming Automotive and Electronics Sectors Boosting Sales in China

According to Future Market Insights (FMI), China is projected to dominate the global market during the forecast period. This is attributable to rapid expansion of the automotive and electronic sectors along with increasing adoption of cold gas spray coating in these sectors.

The China cold gas spray coating market is anticipated to thrive at a 4.3% CAGR through 2033. Historically, cold gas spray coating sales revenue in China rose at a 5.6% CAGR.

Over the forecast period, China market is expected to create an absolute $ opportunity of US$ 131.8 million. By 2033, the cold gas spray coating industry in China is set to attain a valuation of US$ 383.5 million.

China has become the leading automotive manufacturer in the world over the last few years and the trend is expected to continue through 2033. For instance, overall vehicle production in China reached around 27 million in 2022 as per the International Organization of Motor Vehicle Manufacturers (OICA).

Increasing production and sales of vehicles in turn is expected to uplift demand for cold gas spray coating. This is due to rising usage of cold gas spray coating technology for applications such as coating and repairing automotive parts & components.

Growing Focus on Reducing Vehicle Weight to Fuel Demand in Japan

According to a Future Market Insights (FMI) analyst, Japan cold gas spray coating market value is expected to reach US$ 310.0 million by 2033. Overall demand for cold gas spray coating in Japan is likely to rise at a 4.3% CAGR until 2033.

Growth in the market is driven by rising popularity of electric vehicles, growing focus on reducing vehicle weight. Increasing government regulations aimed at encouraging the adoption of lightweight components and materials is also positively impacting the market.

Japan-based automakers are increasingly using cold gas spray coating for creating lightweight and high-performance components. This in turn is expected to boost the target market during the assessment period.

Burgeoning Demand for Consumer Electronics to Bolster Sales in South Korea

South Korea cold gas spray coating industry is anticipated to cross a valuation of US$ 92.8 million by the end of 2033. It is set to create an absolute $ growth of US$ 30.1 million over the forecast period.

From 2023 to 2033, cold gas spray coating sales revenue in South Korea is predicted to rise at a CAGR of 4.0%. Rising demand for consumer electronics is a key factor stimulating growth in South Korea cold gas spray coating industry.

Cold spray coatings are being applied to electronic components and products such as PCBs, transformers, and others. Hence, increasing production and sales of electronic devices due to rapid penetration of digitalization and industrialization is expected to boost South Korea market.

Get the data you need at a Fraction of the cost

Personalize your report by choosing insights you need
and save 40%!

Category-wise Insights

Several Benefits Offered by High Pressure Technology make it Highly Popular

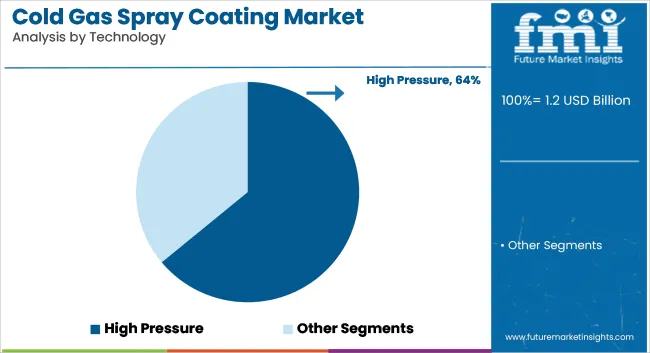
Table below shows high pressure to be leading segment in terms of technology. It is estimated that high-pressure cold spray technology segment will surge at 4.2% CAGR through 2033. On the other hand, low pressure cold spray technology segment will also witness significant growth.

Top Segment (Technology) High Pressure
Historical CAGR 2018 to 2022 5.6%
Projected CAGR 2023 to 2033 4.2%

Based on technology, the global cold gas spray coating industry is segmented into high pressure and low pressure. Among these, high pressure technology is expected to remain highly popular owing to its multiple benefits.

As per Future Market Insights (FMI), high pressure segment is projected to thrive at 4.2% CAGR through 2033 in comparison to the 5.6% CAGR registered until 2022.

High pressure cold spray coating involves the use of compressed gas at high pressures to accelerate particles used for coating depositions. This technology is preferred due to its several benefits including improved particle acceleration, enhanced adhesion, higher coating density, less material waste, etc.

Adoption of Cold Gas Spray Coating to Remain High in Transportation Sector

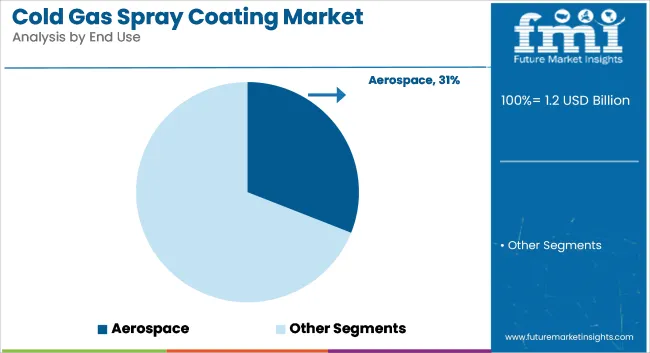
Below table indicates the transportation sector to remain the leading end user of cold gas spray coating during the forecast period. It is likely to exhibit a 4.1% CAGR followed by other segments like electrical & electronics and medical.

Top Segment by End Use Transportation
Historical CAGR 2018 to 2022 5.5%
Projected CAGR 2023 to 2033 4.1%

Based on end use, transportation segment is expected to lead the global market for cold gas spray coating during the forecast period. This is due to rising adoption of cold gas spray coating for applications such as coating and repairing of components in automotive and aerospace sectors.

According to Future Market Insights (FMI), transportation segment witnessed a CAGR of 5.5% during the historical period. For the projection period, it is likely to thrive at 4.1% CAGR.

The adoption of cold gas spray coating results in a mechanical bonding mechanism which makes it ideal for a variety of applications in transportation sector. It is being widely used for coating and repairing applications due to its several advantages including excellent bonding.

Cold spray coatings provide optimal corrosion protection to several components and parts in the transportation sector. As a result, automotive manufacturers are increasingly employing cold gas spray coating processes.

Competitive Landscape

Leading cold gas spray coatings companies profiled in the report include Flame Spray Technologies B.V, Polymet Corporation, Plasma Giken Co. Ltd., Oerlikon Metco, Praxair S.T. Technology, Inc., Curtiss-Wright Surface Technologies, Bodycote, VRC Metal Systems, LLC, ASB Industries, Inc., and Fujimi Incorporated among others.

These companies are focusing on introducing novel solutions into the market to meet changing end user requirements. They also use tactics such as acquisitions, mergers, partnerships, distribution agreements, acquisitions, facility expansions, and collaborations to solidify their positions.

Recent Developments

  • In March 2023, Oerlikon, a global innovation powerhouse for polymer processing, surface engineering, and additive manufacturing completed the acquisition of Riri. The acquisition will help the company to significantly expand its offerings, especially in coatings.
  • In November 2021, EWI announced the launch of its new cold spray research center to unlock the potential of cold spray.
  • In January 2021, Hannecard and ASB Industries joined forces to operate under the name Hannecard Roller Coatings, Inc. Both companies will share their expertise, technology, and research and development to expand their portfolios and services.
  • In July 2022, VRC Metals unveiled the new C.A.M.P Site cold spray system.

Scope of the Report

Attribute Details
Estimated Market Value (2023) US$ 1.1 billion
Projected Market Value (2033) US$ 1.6 billion
Anticipated Growth Rate (2023 to 2033) 4.4% CAGR
Historical Data 2018 to 2022
Forecast Period 2023 to 2033
Quantitative Units Revenue in US$ Million/Billion and CAGR from 2023 to 2033
Report Coverage Revenue Forecast, Volume Forecast, Company Ranking, Competitive Landscape, Growth Factors, Trends and Pricing Analysis
Segments Covered
  • Technology
  • End Use
  • Region
Regions Covered
  • North America
  • Latin America
  • Western Europe
  • Eastern Europe
  • South Asia and Pacific
  • East Asia
  • The Middle East & Africa
Key Countries Covered
  • The United States
  • Canada
  • Brazil
  • Mexico
  • Germany
  • The United Kingdom
  • France
  • Italy
  • Spain
  • Russia
  • Poland
  • Czech Republic
  • Romania
  • India
  • Bangladesh
  • Australia
  • New Zealand
  • China
  • Japan
  • South Korea
  • GCC countries
  • South Africa
  • Israel
Key Companies Profiled
  • Plasma Giken Co., Ltd.
  • VRC Metal Systems, LLC
  • Curtiss-Wright Surface Technologies
  • Bodycote
  • Praxair S.T. Technology, Inc.
  • ASB Industries, Inc.
  • Fujimi Incorporated
  • Oerlikon Metco
  • Flame Spray Technologies B.V
  • Polymet Corporation

Global Cold Gas Spray Coating Market Segmentation

By Technology:

  • High Pressure
  • Low Pressure

By End Use:

  • Transportation
  • Aerospace
  • Automotive
  • Electrical & Electronics
  • Oil & Gas
  • Utility
  • Medical
  • Others

By Region:

  • North America
  • Latin America
  • Western Europe
  • Eastern Europe
  • East Asia
  • South Asia and Pacific
  • Middle East and Africa

Frequently Asked Questions

How big was the global market in 2022?

The global market value totaled US$ 1.0 billion in 2022.

What is the estimated size of the global industry?

The global market size is expected to reach US$ 1.1 billion in 2023.

What is the predicted valuation for the global market in 2033?

The global industry is predicted to reach a valuation of US$ 1.6 billion by 2033.

What value CAGR did the global market exhibit from 2018 to 2022?

The global market exhibited a CAGR of 5.7% from 2018 to 2022.

At what rate will global demand rise through 2033?

Global market demand is forecast to increase at a 4.4% CAGR through 2033.

Which end use segment will dominate the target market?

Thriving at a 4.1% CAGR, transportation segment is expected to lead the market.

Which country is expected to lead the global market?

With a valuation of US$ 383.5 million in 2033, China is set to dominate the global market.

Table of Content

1. Executive Summary

    1.1. Global Market Outlook

    1.2. Demand-side Trends

    1.3. Supply-side Trends

    1.4. Technology Roadmap Analysis

    1.5. Analysis and Recommendations

2. Market Overview

    2.1. Market Coverage / Taxonomy

    2.2. Market Definition / Scope / Limitations

3. Market Background

    3.1. Market Dynamics

        3.1.1. Drivers

        3.1.2. Restraints

        3.1.3. Opportunity

        3.1.4. Trends

    3.2. Scenario Forecast

        3.2.1. Demand in Optimistic Scenario

        3.2.2. Demand in Likely Scenario

        3.2.3. Demand in Conservative Scenario

    3.3. Opportunity Map Analysis

    3.4. Investment Feasibility Matrix

    3.5. PESTLE and Porter’s Analysis

    3.6. Regulatory Landscape

        3.6.1. By Key Regions

        3.6.2. By Key Countries

    3.7. Regional Parent Market Outlook

4. Global Market Analysis 2018 to 2022 and Forecast, 2023 to 2033

    4.1. Historical Market Size Value (US$ Million) Analysis, 2018 to 2022

    4.2. Current and Future Market Size Value (US$ Million) Projections, 2023 to 2033

        4.2.1. Y-o-Y Growth Trend Analysis

        4.2.2. Absolute $ Opportunity Analysis

5. Global Market Analysis 2018 to 2022 and Forecast 2023 to 2033, By Technology

    5.1. Introduction / Key Findings

    5.2. Historical Market Size Value (US$ Million) Analysis By Technology, 2018 to 2022

    5.3. Current and Future Market Size Value (US$ Million) Analysis and Forecast By Technology, 2023 to 2033

        5.3.1. High Pressure

        5.3.2. Low Pressure

    5.4. Y-o-Y Growth Trend Analysis By Technology, 2018 to 2022

    5.5. Absolute $ Opportunity Analysis By Technology, 2023 to 2033

6. Global Market Analysis 2018 to 2022 and Forecast 2023 to 2033, By End-use

    6.1. Introduction / Key Findings

    6.2. Historical Market Size Value (US$ Million) Analysis By End-use, 2018 to 2022

    6.3. Current and Future Market Size Value (US$ Million) Analysis and Forecast By End-use, 2023 to 2033

        6.3.1. Transportation

            6.3.1.1. Aerospace

            6.3.1.2. Automotive

        6.3.2. Electrical & Electronics

            6.3.2.1. Power Electronic Heat Sinks

            6.3.2.2. Refrigeration Value (US$ Million)s

            6.3.2.3. Circuit Boards

            6.3.2.4. Electrical Contacts

            6.3.2.5. Electric Motors & Generators

            6.3.2.6. Transformers

            6.3.2.7. Semiconductors & Displays

            6.3.2.8. Electro-plating

            6.3.2.9. Bus bars Fluid Handlin

        6.3.3. Oil & Gas

            6.3.3.1. Drilling Components

            6.3.3.2. Gate Valves

        6.3.4. Utility

            6.3.4.1. Power Boilers

            6.3.4.2. Gas and Hydro-Steam Turbine

            6.3.4.3. Turbochargers

            6.3.4.4. Solar Heat & Solar Energy Components

            6.3.4.5. Nuclear

        6.3.5. Medical

            6.3.5.1. Orthopedic Prostheses

            6.3.5.2. Dental Implants

            6.3.5.3. Others

        6.3.6. Others

    6.4. Y-o-Y Growth Trend Analysis By End-use, 2018 to 2022

    6.5. Absolute $ Opportunity Analysis By End-use, 2023 to 2033

7. Global Market Analysis 2018 to 2022 and Forecast 2023 to 2033, By Region

    7.1. Introduction

    7.2. Historical Market Size Value (US$ Million) Analysis By Region, 2018 to 2022

    7.3. Current Market Size Value (US$ Million) Analysis and Forecast By Region, 2023 to 2033

        7.3.1. North America

        7.3.2. Latin America

        7.3.3. Western Europe

        7.3.4. Eastern Europe

        7.3.5. South Asia and Pacific

        7.3.6. East Asia

        7.3.7. Middle East and Africa

    7.4. Market Attractiveness Analysis By Region

8. North America Market Analysis 2018 to 2022 and Forecast 2023 to 2033, By Country

    8.1. Historical Market Size Value (US$ Million) Trend Analysis By Market Taxonomy, 2018 to 2022

    8.2. Market Size Value (US$ Million) Forecast By Market Taxonomy, 2023 to 2033

        8.2.1. By Country

            8.2.1.1. USA

            8.2.1.2. Canada

        8.2.2. By Technology

        8.2.3. By End-use

    8.3. Market Attractiveness Analysis

        8.3.1. By Country

        8.3.2. By Technology

        8.3.3. By End-use

    8.4. Key Takeaways

9. Latin America Market Analysis 2018 to 2022 and Forecast 2023 to 2033, By Country

    9.1. Historical Market Size Value (US$ Million) Trend Analysis By Market Taxonomy, 2018 to 2022

    9.2. Market Size Value (US$ Million) Forecast By Market Taxonomy, 2023 to 2033

        9.2.1. By Country

            9.2.1.1. Brazil

            9.2.1.2. Mexico

            9.2.1.3. Rest of Latin America

        9.2.2. By Technology

        9.2.3. By End-use

    9.3. Market Attractiveness Analysis

        9.3.1. By Country

        9.3.2. By Technology

        9.3.3. By End-use

    9.4. Key Takeaways

10. Western Europe Market Analysis 2018 to 2022 and Forecast 2023 to 2033, By Country

    10.1. Historical Market Size Value (US$ Million) Trend Analysis By Market Taxonomy, 2018 to 2022

    10.2. Market Size Value (US$ Million) Forecast By Market Taxonomy, 2023 to 2033

        10.2.1. By Country

            10.2.1.1. Germany

            10.2.1.2. UK

            10.2.1.3. France

            10.2.1.4. Spain

            10.2.1.5. Italy

            10.2.1.6. Rest of Western Europe

        10.2.2. By Technology

        10.2.3. By End-use

    10.3. Market Attractiveness Analysis

        10.3.1. By Country

        10.3.2. By Technology

        10.3.3. By End-use

    10.4. Key Takeaways

11. Eastern Europe Market Analysis 2018 to 2022 and Forecast 2023 to 2033, By Country

    11.1. Historical Market Size Value (US$ Million) Trend Analysis By Market Taxonomy, 2018 to 2022

    11.2. Market Size Value (US$ Million) Forecast By Market Taxonomy, 2023 to 2033

        11.2.1. By Country

            11.2.1.1. Poland

            11.2.1.2. Russia

            11.2.1.3. Czech Republic

            11.2.1.4. Romania

            11.2.1.5. Rest of Eastern Europe

        11.2.2. By Technology

        11.2.3. By End-use

    11.3. Market Attractiveness Analysis

        11.3.1. By Country

        11.3.2. By Technology

        11.3.3. By End-use

    11.4. Key Takeaways

12. South Asia and Pacific Market Analysis 2018 to 2022 and Forecast 2023 to 2033, By Country

    12.1. Historical Market Size Value (US$ Million) Trend Analysis By Market Taxonomy, 2018 to 2022

    12.2. Market Size Value (US$ Million) Forecast By Market Taxonomy, 2023 to 2033

        12.2.1. By Country

            12.2.1.1. India

            12.2.1.2. Bangladesh

            12.2.1.3. Australia

            12.2.1.4. New Zealand

            12.2.1.5. Rest of South Asia and Pacific

        12.2.2. By Technology

        12.2.3. By End-use

    12.3. Market Attractiveness Analysis

        12.3.1. By Country

        12.3.2. By Technology

        12.3.3. By End-use

    12.4. Key Takeaways

13. East Asia Market Analysis 2018 to 2022 and Forecast 2023 to 2033, By Country

    13.1. Historical Market Size Value (US$ Million) Trend Analysis By Market Taxonomy, 2018 to 2022

    13.2. Market Size Value (US$ Million) Forecast By Market Taxonomy, 2023 to 2033

        13.2.1. By Country

            13.2.1.1. China

            13.2.1.2. Japan

            13.2.1.3. South Korea

        13.2.2. By Technology

        13.2.3. By End-use

    13.3. Market Attractiveness Analysis

        13.3.1. By Country

        13.3.2. By Technology

        13.3.3. By End-use

    13.4. Key Takeaways

14. Middle East and Africa Market Analysis 2018 to 2022 and Forecast 2023 to 2033, By Country

    14.1. Historical Market Size Value (US$ Million) Trend Analysis By Market Taxonomy, 2018 to 2022

    14.2. Market Size Value (US$ Million) Forecast By Market Taxonomy, 2023 to 2033

        14.2.1. By Country

            14.2.1.1. GCC Countries

            14.2.1.2. South Africa

            14.2.1.3. Israel

            14.2.1.4. Rest of MEA

        14.2.2. By Technology

        14.2.3. By End-use

    14.3. Market Attractiveness Analysis

        14.3.1. By Country

        14.3.2. By Technology

        14.3.3. By End-use

    14.4. Key Takeaways

15. Key Countries Market Analysis

    15.1. USA

        15.1.1. Pricing Analysis

        15.1.2. Market Share Analysis, 2022

            15.1.2.1. By Technology

            15.1.2.2. By End-use

    15.2. Canada

        15.2.1. Pricing Analysis

        15.2.2. Market Share Analysis, 2022

            15.2.2.1. By Technology

            15.2.2.2. By End-use

    15.3. Brazil

        15.3.1. Pricing Analysis

        15.3.2. Market Share Analysis, 2022

            15.3.2.1. By Technology

            15.3.2.2. By End-use

    15.4. Mexico

        15.4.1. Pricing Analysis

        15.4.2. Market Share Analysis, 2022

            15.4.2.1. By Technology

            15.4.2.2. By End-use

    15.5. Germany

        15.5.1. Pricing Analysis

        15.5.2. Market Share Analysis, 2022

            15.5.2.1. By Technology

            15.5.2.2. By End-use

    15.6. UK

        15.6.1. Pricing Analysis

        15.6.2. Market Share Analysis, 2022

            15.6.2.1. By Technology

            15.6.2.2. By End-use

    15.7. France

        15.7.1. Pricing Analysis

        15.7.2. Market Share Analysis, 2022

            15.7.2.1. By Technology

            15.7.2.2. By End-use

    15.8. Spain

        15.8.1. Pricing Analysis

        15.8.2. Market Share Analysis, 2022

            15.8.2.1. By Technology

            15.8.2.2. By End-use

    15.9. Italy

        15.9.1. Pricing Analysis

        15.9.2. Market Share Analysis, 2022

            15.9.2.1. By Technology

            15.9.2.2. By End-use

    15.10. Poland

        15.10.1. Pricing Analysis

        15.10.2. Market Share Analysis, 2022

            15.10.2.1. By Technology

            15.10.2.2. By End-use

    15.11. Russia

        15.11.1. Pricing Analysis

        15.11.2. Market Share Analysis, 2022

            15.11.2.1. By Technology

            15.11.2.2. By End-use

    15.12. Czech Republic

        15.12.1. Pricing Analysis

        15.12.2. Market Share Analysis, 2022

            15.12.2.1. By Technology

            15.12.2.2. By End-use

    15.13. Romania

        15.13.1. Pricing Analysis

        15.13.2. Market Share Analysis, 2022

            15.13.2.1. By Technology

            15.13.2.2. By End-use

    15.14. India

        15.14.1. Pricing Analysis

        15.14.2. Market Share Analysis, 2022

            15.14.2.1. By Technology

            15.14.2.2. By End-use

    15.15. Bangladesh

        15.15.1. Pricing Analysis

        15.15.2. Market Share Analysis, 2022

            15.15.2.1. By Technology

            15.15.2.2. By End-use

    15.16. Australia

        15.16.1. Pricing Analysis

        15.16.2. Market Share Analysis, 2022

            15.16.2.1. By Technology

            15.16.2.2. By End-use

    15.17. New Zealand

        15.17.1. Pricing Analysis

        15.17.2. Market Share Analysis, 2022

            15.17.2.1. By Technology

            15.17.2.2. By End-use

    15.18. China

        15.18.1. Pricing Analysis

        15.18.2. Market Share Analysis, 2022

            15.18.2.1. By Technology

            15.18.2.2. By End-use

    15.19. Japan

        15.19.1. Pricing Analysis

        15.19.2. Market Share Analysis, 2022

            15.19.2.1. By Technology

            15.19.2.2. By End-use

    15.20. South Korea

        15.20.1. Pricing Analysis

        15.20.2. Market Share Analysis, 2022

            15.20.2.1. By Technology

            15.20.2.2. By End-use

    15.21. GCC Countries

        15.21.1. Pricing Analysis

        15.21.2. Market Share Analysis, 2022

            15.21.2.1. By Technology

            15.21.2.2. By End-use

    15.22. South Africa

        15.22.1. Pricing Analysis

        15.22.2. Market Share Analysis, 2022

            15.22.2.1. By Technology

            15.22.2.2. By End-use

    15.23. Israel

        15.23.1. Pricing Analysis

        15.23.2. Market Share Analysis, 2022

            15.23.2.1. By Technology

            15.23.2.2. By End-use

16. Market Structure Analysis

    16.1. Competition Dashboard

    16.2. Competition Benchmarking

    16.3. Market Share Analysis of Top Players

        16.3.1. By Regional

        16.3.2. By Technology

        16.3.3. By End-use

17. Competition Analysis

    17.1. Competition Deep Dive

        17.1.1. Plasma Giken Co., Ltd.

            17.1.1.1. Overview

            17.1.1.2. Product Portfolio

            17.1.1.3. Profitability by Market Segments

            17.1.1.4. Sales Footprint

            17.1.1.5. Strategy Overview

                17.1.1.5.1. Marketing Strategy

        17.1.2. VRC Metal Systems, LLC

            17.1.2.1. Overview

            17.1.2.2. Product Portfolio

            17.1.2.3. Profitability by Market Segments

            17.1.2.4. Sales Footprint

            17.1.2.5. Strategy Overview

                17.1.2.5.1. Marketing Strategy

        17.1.3. Curtiss-Wright Surface Technologies

            17.1.3.1. Overview

            17.1.3.2. Product Portfolio

            17.1.3.3. Profitability by Market Segments

            17.1.3.4. Sales Footprint

            17.1.3.5. Strategy Overview

                17.1.3.5.1. Marketing Strategy

        17.1.4. Bodycote

            17.1.4.1. Overview

            17.1.4.2. Product Portfolio

            17.1.4.3. Profitability by Market Segments

            17.1.4.4. Sales Footprint

            17.1.4.5. Strategy Overview

                17.1.4.5.1. Marketing Strategy

        17.1.5. Praxair S.T. Technology, Inc.

            17.1.5.1. Overview

            17.1.5.2. Product Portfolio

            17.1.5.3. Profitability by Market Segments

            17.1.5.4. Sales Footprint

            17.1.5.5. Strategy Overview

                17.1.5.5.1. Marketing Strategy

        17.1.6. ASB Industries, Inc.

            17.1.6.1. Overview

            17.1.6.2. Product Portfolio

            17.1.6.3. Profitability by Market Segments

            17.1.6.4. Sales Footprint

            17.1.6.5. Strategy Overview

                17.1.6.5.1. Marketing Strategy

        17.1.7. Fujimi Incorporated

            17.1.7.1. Overview

            17.1.7.2. Product Portfolio

            17.1.7.3. Profitability by Market Segments

            17.1.7.4. Sales Footprint

            17.1.7.5. Strategy Overview

                17.1.7.5.1. Marketing Strategy

        17.1.8. Oerlikon Metco

            17.1.8.1. Overview

            17.1.8.2. Product Portfolio

            17.1.8.3. Profitability by Market Segments

            17.1.8.4. Sales Footprint

            17.1.8.5. Strategy Overview

                17.1.8.5.1. Marketing Strategy

        17.1.9. Flame Spray Technologies B.V

            17.1.9.1. Overview

            17.1.9.2. Product Portfolio

            17.1.9.3. Profitability by Market Segments

            17.1.9.4. Sales Footprint

            17.1.9.5. Strategy Overview

                17.1.9.5.1. Marketing Strategy

        17.1.10. Polymet Corporation

            17.1.10.1. Overview

            17.1.10.2. Product Portfolio

            17.1.10.3. Profitability by Market Segments

            17.1.10.4. Sales Footprint

            17.1.10.5. Strategy Overview

                17.1.10.5.1. Marketing Strategy

18. Assumptions & Acronyms Used

19. Research Methodology

List of Tables

Table 1: Global Market Value (US$ Million) Forecast by Region, 2018 to 2033

Table 2: Global Market Value (US$ Million) Forecast by Technology, 2018 to 2033

Table 3: Global Market Value (US$ Million) Forecast by End-use, 2018 to 2033

Table 4: North America Market Value (US$ Million) Forecast by Country, 2018 to 2033

Table 5: North America Market Value (US$ Million) Forecast by Technology, 2018 to 2033

Table 6: North America Market Value (US$ Million) Forecast by End-use, 2018 to 2033

Table 7: Latin America Market Value (US$ Million) Forecast by Country, 2018 to 2033

Table 8: Latin America Market Value (US$ Million) Forecast by Technology, 2018 to 2033

Table 9: Latin America Market Value (US$ Million) Forecast by End-use, 2018 to 2033

Table 10: Western Europe Market Value (US$ Million) Forecast by Country, 2018 to 2033

Table 11: Western Europe Market Value (US$ Million) Forecast by Technology, 2018 to 2033

Table 12: Western Europe Market Value (US$ Million) Forecast by End-use, 2018 to 2033

Table 13: Eastern Europe Market Value (US$ Million) Forecast by Country, 2018 to 2033

Table 14: Eastern Europe Market Value (US$ Million) Forecast by Technology, 2018 to 2033

Table 15: Eastern Europe Market Value (US$ Million) Forecast by End-use, 2018 to 2033

Table 16: South Asia and Pacific Market Value (US$ Million) Forecast by Country, 2018 to 2033

Table 17: South Asia and Pacific Market Value (US$ Million) Forecast by Technology, 2018 to 2033

Table 18: South Asia and Pacific Market Value (US$ Million) Forecast by End-use, 2018 to 2033

Table 19: East Asia Market Value (US$ Million) Forecast by Country, 2018 to 2033

Table 20: East Asia Market Value (US$ Million) Forecast by Technology, 2018 to 2033

Table 21: East Asia Market Value (US$ Million) Forecast by End-use, 2018 to 2033

Table 22: Middle East and Africa Market Value (US$ Million) Forecast by Country, 2018 to 2033

Table 23: Middle East and Africa Market Value (US$ Million) Forecast by Technology, 2018 to 2033

Table 24: Middle East and Africa Market Value (US$ Million) Forecast by End-use, 2018 to 2033

List of Charts

Figure 1: Global Market Value (US$ Million) by Technology, 2023 to 2033

Figure 2: Global Market Value (US$ Million) by End-use, 2023 to 2033

Figure 3: Global Market Value (US$ Million) by Region, 2023 to 2033

Figure 4: Global Market Value (US$ Million) Analysis by Region, 2018 to 2033

Figure 5: Global Market Value Share (%) and BPS Analysis by Region, 2023 to 2033

Figure 6: Global Market Y-o-Y Growth (%) Projections by Region, 2023 to 2033

Figure 7: Global Market Value (US$ Million) Analysis by Technology, 2018 to 2033

Figure 8: Global Market Value Share (%) and BPS Analysis by Technology, 2023 to 2033

Figure 9: Global Market Y-o-Y Growth (%) Projections by Technology, 2023 to 2033

Figure 10: Global Market Value (US$ Million) Analysis by End-use, 2018 to 2033

Figure 11: Global Market Value Share (%) and BPS Analysis by End-use, 2023 to 2033

Figure 12: Global Market Y-o-Y Growth (%) Projections by End-use, 2023 to 2033

Figure 13: Global Market Attractiveness by Technology, 2023 to 2033

Figure 14: Global Market Attractiveness by End-use, 2023 to 2033

Figure 15: Global Market Attractiveness by Region, 2023 to 2033

Figure 16: North America Market Value (US$ Million) by Technology, 2023 to 2033

Figure 17: North America Market Value (US$ Million) by End-use, 2023 to 2033

Figure 18: North America Market Value (US$ Million) by Country, 2023 to 2033

Figure 19: North America Market Value (US$ Million) Analysis by Country, 2018 to 2033

Figure 20: North America Market Value Share (%) and BPS Analysis by Country, 2023 to 2033

Figure 21: North America Market Y-o-Y Growth (%) Projections by Country, 2023 to 2033

Figure 22: North America Market Value (US$ Million) Analysis by Technology, 2018 to 2033

Figure 23: North America Market Value Share (%) and BPS Analysis by Technology, 2023 to 2033

Figure 24: North America Market Y-o-Y Growth (%) Projections by Technology, 2023 to 2033

Figure 25: North America Market Value (US$ Million) Analysis by End-use, 2018 to 2033

Figure 26: North America Market Value Share (%) and BPS Analysis by End-use, 2023 to 2033

Figure 27: North America Market Y-o-Y Growth (%) Projections by End-use, 2023 to 2033

Figure 28: North America Market Attractiveness by Technology, 2023 to 2033

Figure 29: North America Market Attractiveness by End-use, 2023 to 2033

Figure 30: North America Market Attractiveness by Country, 2023 to 2033

Figure 31: Latin America Market Value (US$ Million) by Technology, 2023 to 2033

Figure 32: Latin America Market Value (US$ Million) by End-use, 2023 to 2033

Figure 33: Latin America Market Value (US$ Million) by Country, 2023 to 2033

Figure 34: Latin America Market Value (US$ Million) Analysis by Country, 2018 to 2033

Figure 35: Latin America Market Value Share (%) and BPS Analysis by Country, 2023 to 2033

Figure 36: Latin America Market Y-o-Y Growth (%) Projections by Country, 2023 to 2033

Figure 37: Latin America Market Value (US$ Million) Analysis by Technology, 2018 to 2033

Figure 38: Latin America Market Value Share (%) and BPS Analysis by Technology, 2023 to 2033

Figure 39: Latin America Market Y-o-Y Growth (%) Projections by Technology, 2023 to 2033

Figure 40: Latin America Market Value (US$ Million) Analysis by End-use, 2018 to 2033

Figure 41: Latin America Market Value Share (%) and BPS Analysis by End-use, 2023 to 2033

Figure 42: Latin America Market Y-o-Y Growth (%) Projections by End-use, 2023 to 2033

Figure 43: Latin America Market Attractiveness by Technology, 2023 to 2033

Figure 44: Latin America Market Attractiveness by End-use, 2023 to 2033

Figure 45: Latin America Market Attractiveness by Country, 2023 to 2033

Figure 46: Western Europe Market Value (US$ Million) by Technology, 2023 to 2033

Figure 47: Western Europe Market Value (US$ Million) by End-use, 2023 to 2033

Figure 48: Western Europe Market Value (US$ Million) by Country, 2023 to 2033

Figure 49: Western Europe Market Value (US$ Million) Analysis by Country, 2018 to 2033

Figure 50: Western Europe Market Value Share (%) and BPS Analysis by Country, 2023 to 2033

Figure 51: Western Europe Market Y-o-Y Growth (%) Projections by Country, 2023 to 2033

Figure 52: Western Europe Market Value (US$ Million) Analysis by Technology, 2018 to 2033

Figure 53: Western Europe Market Value Share (%) and BPS Analysis by Technology, 2023 to 2033

Figure 54: Western Europe Market Y-o-Y Growth (%) Projections by Technology, 2023 to 2033

Figure 55: Western Europe Market Value (US$ Million) Analysis by End-use, 2018 to 2033

Figure 56: Western Europe Market Value Share (%) and BPS Analysis by End-use, 2023 to 2033

Figure 57: Western Europe Market Y-o-Y Growth (%) Projections by End-use, 2023 to 2033

Figure 58: Western Europe Market Attractiveness by Technology, 2023 to 2033

Figure 59: Western Europe Market Attractiveness by End-use, 2023 to 2033

Figure 60: Western Europe Market Attractiveness by Country, 2023 to 2033

Figure 61: Eastern Europe Market Value (US$ Million) by Technology, 2023 to 2033

Figure 62: Eastern Europe Market Value (US$ Million) by End-use, 2023 to 2033

Figure 63: Eastern Europe Market Value (US$ Million) by Country, 2023 to 2033

Figure 64: Eastern Europe Market Value (US$ Million) Analysis by Country, 2018 to 2033

Figure 65: Eastern Europe Market Value Share (%) and BPS Analysis by Country, 2023 to 2033

Figure 66: Eastern Europe Market Y-o-Y Growth (%) Projections by Country, 2023 to 2033

Figure 67: Eastern Europe Market Value (US$ Million) Analysis by Technology, 2018 to 2033

Figure 68: Eastern Europe Market Value Share (%) and BPS Analysis by Technology, 2023 to 2033

Figure 69: Eastern Europe Market Y-o-Y Growth (%) Projections by Technology, 2023 to 2033

Figure 70: Eastern Europe Market Value (US$ Million) Analysis by End-use, 2018 to 2033

Figure 71: Eastern Europe Market Value Share (%) and BPS Analysis by End-use, 2023 to 2033

Figure 72: Eastern Europe Market Y-o-Y Growth (%) Projections by End-use, 2023 to 2033

Figure 73: Eastern Europe Market Attractiveness by Technology, 2023 to 2033

Figure 74: Eastern Europe Market Attractiveness by End-use, 2023 to 2033

Figure 75: Eastern Europe Market Attractiveness by Country, 2023 to 2033

Figure 76: South Asia and Pacific Market Value (US$ Million) by Technology, 2023 to 2033

Figure 77: South Asia and Pacific Market Value (US$ Million) by End-use, 2023 to 2033

Figure 78: South Asia and Pacific Market Value (US$ Million) by Country, 2023 to 2033

Figure 79: South Asia and Pacific Market Value (US$ Million) Analysis by Country, 2018 to 2033

Figure 80: South Asia and Pacific Market Value Share (%) and BPS Analysis by Country, 2023 to 2033

Figure 81: South Asia and Pacific Market Y-o-Y Growth (%) Projections by Country, 2023 to 2033

Figure 82: South Asia and Pacific Market Value (US$ Million) Analysis by Technology, 2018 to 2033

Figure 83: South Asia and Pacific Market Value Share (%) and BPS Analysis by Technology, 2023 to 2033

Figure 84: South Asia and Pacific Market Y-o-Y Growth (%) Projections by Technology, 2023 to 2033

Figure 85: South Asia and Pacific Market Value (US$ Million) Analysis by End-use, 2018 to 2033

Figure 86: South Asia and Pacific Market Value Share (%) and BPS Analysis by End-use, 2023 to 2033

Figure 87: South Asia and Pacific Market Y-o-Y Growth (%) Projections by End-use, 2023 to 2033

Figure 88: South Asia and Pacific Market Attractiveness by Technology, 2023 to 2033

Figure 89: South Asia and Pacific Market Attractiveness by End-use, 2023 to 2033

Figure 90: South Asia and Pacific Market Attractiveness by Country, 2023 to 2033

Figure 91: East Asia Market Value (US$ Million) by Technology, 2023 to 2033

Figure 92: East Asia Market Value (US$ Million) by End-use, 2023 to 2033

Figure 93: East Asia Market Value (US$ Million) by Country, 2023 to 2033

Figure 94: East Asia Market Value (US$ Million) Analysis by Country, 2018 to 2033

Figure 95: East Asia Market Value Share (%) and BPS Analysis by Country, 2023 to 2033

Figure 96: East Asia Market Y-o-Y Growth (%) Projections by Country, 2023 to 2033

Figure 97: East Asia Market Value (US$ Million) Analysis by Technology, 2018 to 2033

Figure 98: East Asia Market Value Share (%) and BPS Analysis by Technology, 2023 to 2033

Figure 99: East Asia Market Y-o-Y Growth (%) Projections by Technology, 2023 to 2033

Figure 100: East Asia Market Value (US$ Million) Analysis by End-use, 2018 to 2033

Figure 101: East Asia Market Value Share (%) and BPS Analysis by End-use, 2023 to 2033

Figure 102: East Asia Market Y-o-Y Growth (%) Projections by End-use, 2023 to 2033

Figure 103: East Asia Market Attractiveness by Technology, 2023 to 2033

Figure 104: East Asia Market Attractiveness by End-use, 2023 to 2033

Figure 105: East Asia Market Attractiveness by Country, 2023 to 2033

Figure 106: Middle East and Africa Market Value (US$ Million) by Technology, 2023 to 2033

Figure 107: Middle East and Africa Market Value (US$ Million) by End-use, 2023 to 2033

Figure 108: Middle East and Africa Market Value (US$ Million) by Country, 2023 to 2033

Figure 109: Middle East and Africa Market Value (US$ Million) Analysis by Country, 2018 to 2033

Figure 110: Middle East and Africa Market Value Share (%) and BPS Analysis by Country, 2023 to 2033

Figure 111: Middle East and Africa Market Y-o-Y Growth (%) Projections by Country, 2023 to 2033

Figure 112: Middle East and Africa Market Value (US$ Million) Analysis by Technology, 2018 to 2033

Figure 113: Middle East and Africa Market Value Share (%) and BPS Analysis by Technology, 2023 to 2033

Figure 114: Middle East and Africa Market Y-o-Y Growth (%) Projections by Technology, 2023 to 2033

Figure 115: Middle East and Africa Market Value (US$ Million) Analysis by End-use, 2018 to 2033

Figure 116: Middle East and Africa Market Value Share (%) and BPS Analysis by End-use, 2023 to 2033

Figure 117: Middle East and Africa Market Y-o-Y Growth (%) Projections by End-use, 2023 to 2033

Figure 118: Middle East and Africa Market Attractiveness by Technology, 2023 to 2033

Figure 119: Middle East and Africa Market Attractiveness by End-use, 2023 to 2033

Figure 120: Middle East and Africa Market Attractiveness by Country, 2023 to 2033

Recommendations

Chemicals & Materials

Coatings and Application Technologies for Robotics Market

Published : October 2023

Chemicals & Materials

Coating Additives Market

Published : August 2023

Chemicals & Materials

Water Proof Coatings Market

Published : October 2022

Chemicals & Materials

Wood Coatings Market

Published : June 2022

Explore Chemicals & Materials Insights

View Reports

Cold Gas Spray Coating Market