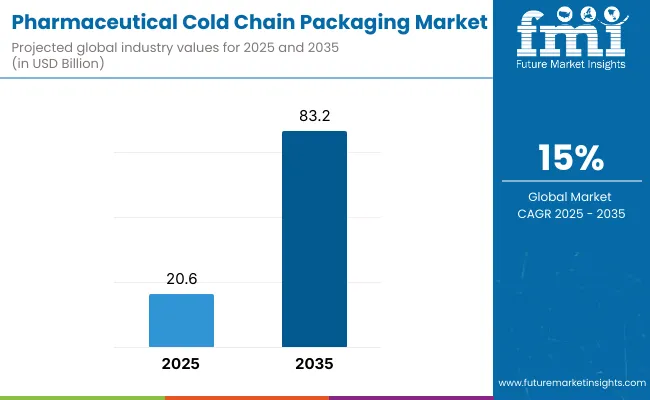
Newly released data by Future Market Insights (FMI) projects the global pharmaceutical cold chain packaging market to register a CAGR of 14.8% and to reach US$ 60,100.9 million by 2033.
As per the report, polymer emerge as the top choice for packaging material and it is expected to account for over 62.1% of the global market share in 2023. It also is expected to attract an incremental opportunity of US$ 37.3 billion through 2033.
The demand in the United States is expected to increase at a robust CAGR of 12.3%, sealing the country’s dominance in the North America pharmaceutical cold chain packaging market.
Attributes | Details |
---|---|
Pharmaceutical Cold Chain Packaging Market Share (2022) | US$ 13,413 million |
Pharmaceutical Cold Chain Packaging Market Size Value (2023) | US$ 15,176.2 million |
Pharmaceutical Cold Chain Packaging Market Size Value (2033) | US$ 60,100.9 million |
Pharmaceutical Cold Chain Packaging Market Growth Rate (2023 to 2033) | 14.8% |
Don't pay for what you don't need
Customize your report by selecting specific countries or regions and save 30%!
Future Market Insights has pegged the global pharmaceutical cold chain packaging market to expand at an impressive CAGR of 14.8% from 2023 to 2033, compared to 13.3% from 2016 to 2022. The growth registered in the market can be attributed to the increasing investment towards improved packaging solutions to reduce the risk of loss or damage during shipment and transportation.
Market Statistics | Details |
---|---|
Jan-Jun (H1), 2021 (A) | 13.2% |
Jul-Dec (H2), 2022 (A) | 13.4% |
Jan-Jun (H1),2022 Projected (P) | 13% |
Jan-Jun (H1),2022 Outlook (O) | 13.7% |
Jul-Dec (H2), 2022 Outlook (O) | 13.6% |
Jul-Dec (H2), 2022 Projected (P) | 13.7% |
Jan-Jun (H1), 2023 Projected (P) | 13.9% |
BPS Change : H1,2022 (O) – H1,2022 (P) | 50 ↑ |
BPS Change : H1,2022 (O) – H1,2021 (A) | 70 ↑ |
BPS Change: H2, 2022 (O) – H2, 2022 (P) | (-) 10 ↓ |
BPS Change: H2, 2022 (O) - H2, 2022 (A) | 20 ↑ |
Pan American Health Organization lists the appropriate cold chain storage temperature for packaging vaccines. The increasing adoption of cold chain packaging in healthcare, clinical research, vaccine packaging, and the biopharma industry is shaping market growth.
With the sudden outbreak of COVID-19, the demand for pharmaceutical cold chain packaging increased and it continues to rise through the forecast period. Technological advancements and a focus on improving the performance of packaging formats are expected to further shape the market dynamics over the forecast period.
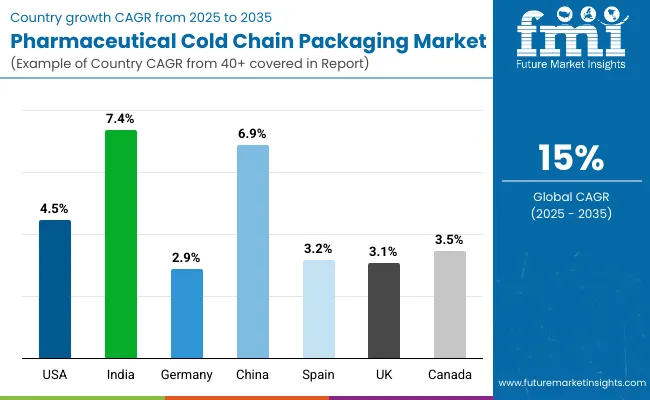
With increasing demand across Germany, India, China, and the United States, the pharmaceutical cold chain packaging market is rapidly recovering and is expected to witness apex growth through 2033.
Due to the outbreak of COVID-19 extensive investment in clinical research was observed across the globe during 2020. After the rollout of COVID-19 antidote in 2021, demand in the pharmaceutical cold chain packaging market has remarkably increased.
According to the United States International Trade Commission, mRNA-based formulas should be stored at 80 °C. Almost 5% to 20% of the vaccines are lost during transportation. To avoid this, the focus on efficient packaging and storage has increased, which is expected to create opportunities for pharmaceutical cold chain packaging market expansion.
Rising demand for better handling of temperature-sensitive pharmaceutical products has resulted in increased research for advanced cold chain packaging insulation solutions such as VIP (vacuum-insulated panels).
According to Sofrigam, vacuum insulated panels can provide packaging support for 7 to 10 days, or even 2 to 3 times more than many insulation materials.
VIP-based insulation offers various advantages compared to polyurethane and expanded polystyrene insulated shippers. Shippers implementing VIP are comparatively smaller and lighter in weight, reduces refrigerant requirement, provide a wide temperature range, and consecutively reduces distribution costs. Due to this wide array of benefits, key players are increasing the adoption of VIP in cold chain packaging.
Real-time tracking, radio frequency identification (RFID) tagging, and the adoption of cutting-edge technologies are creating opportunities for market growth. The adoption of advanced technology such as the internet of thinking (IoT), blockchain, advanced analytics, and integrated customer applications in pharmaceutical cold-chain packaging is reshaping the market dynamics.The adoption of advanced technology such as the internet of thinking (IoT), blockchain, advanced analytics, and integrated customer applications in pharmaceutical cold-chain packaging is reshaping the market dynamics.
Cloud-based data management applications for better decision-making, adhering to regulatory norms, and transparency are slowly becoming the new normal in the cold chain. Integration of digitalization and penetration of e-commerce platforms are further fueling the market growth.
Get the data you need at a Fraction of the cost
Personalize your report by choosing insights you need
and save 40%!
There is increasing pressure on pharmaceutical cold-chain packaging producers to offer more sustainable solutions. Several attempts are made by packaging manufacturers to shift from polymer to eco-friendlier alternatives.
Several authorities and government bodies are compelling manufacturers to reduce their carbon footprint and move towards a sustainable packaging solution. This is encouraging the adoption of paper in pharmaceutical cold-chain packaging.
Leading pharmaceutical and healthcare manufacturers are outsourcing their logistics and distribution functions. Numerous manufacturers are opting for raw material sourcing, distribution, freight, warehousing, shipping, and logistics functions to be outsourced to a vendor.
Hence, the adoption of 3PL or third-party logistics has increased among pharmaceutical companies. Adoption of 3PL reduces shipping costs and results in the distribution of revenue and maintains a simpler supply chain.
Many other third parties such as insurance providers, logistics providers, wholesalers/distributors, and control agencies are involved in the pharmaceutical cold chain packaging market. Outsourcing is slowly bringing a revolution in the pharmaceutical cold chain packaging market. Thereby, boosting market growth.
Attributes | Statistics |
---|---|
The United States Market Value 2022 | US$ 2,494.5 million |
The United States Market Share | 18.6% |
The United States is home to many leading pharmaceutical and healthcare organizations. It is also one of the thriving markets for temperature-sensitive healthcare products, vaccine packaging, and clinical research materials.
The United States also provides a supportive business environment for growth with minimum market barriers. Due to the presence of leading pharmaceutical companies across the country, the pharmaceutical cold chain market is expected to witness a boost during the forecast period.
Besides this, technological advancements and innovation in the field of cold chain packaging aids market growth. According to the United States International Trade Administration, a significant change was observed in the pharmaceutical cold chain packaging market in recent years when the shipment mode was changed from air transportation to sea modes. The sole reason behind this transition was the temperature difference that led to the deterioration of pharmaceutical products.
This change is anticipated to influence market growth across the country. As per Future Market Insights, the United States pharmaceutical cold chain packaging market is poised to expand at an exceptional CAGR of over 12.3% through 2033.
Attributes | Statistics |
---|---|
Germany Market Value 2022 | US$ 505.3 million |
Germany Market Share | 3.8% |
According to Germany Trade and Invest (GTAI), Germany is the leading pharmaceutical market in Europe with 12.5% of total revenue invested in research and development in 2018. With increasing investment in research and development activities, Germany has emerged as a key producer of cutting-edge innovative products.
As per FMI, Germany accounts for the leading share of the Europe cold chain packaging market. Sales of the pharmaceutical cold chain packaging market across Germany are expected to rise at nearly 10.9% CAGR during the forecast period.
Attributes | Statistics |
---|---|
India Market Value 2022 | US$ 1,162.9 million |
India Market Share | 8.7% |
As per Future Market Insights, India is expected to be a flourishing market across South Asia. Exhibiting a growth rate of 14.7%, India’s pharmaceutical cold chain packaging market may witness enormous growth during the projection period.
Despite the outbreak of COVID-19, the market for cold chains observed positive growth. Development in the cold chain process and better infrastructure across the country are expected to improve market growth.
Backed by the favorable government policies for its manufacturing and logistics industry, India is expected to attract leading pharmaceutical manufacturers for its significant gap in the logistics and delivery market.
The government of India is widely promoting cold chain packaging in the country, it has launched various schemes and subsidies for cold chain logistics in the country. A few of them are low-interest loans from the warehousing infrastructure fund (NABARD), 100% FDI through the automatic approval rule, etc.
Attributes | Statistics |
---|---|
China Market Value 2022 | US$ 1,503.7 million |
China Market Share | 11.2% |
China is considered to be the Asian hub for manufacturing and supply chains. The count of third-party logistic companies has rapidly increased over the past five years, giving a boost to the pharmaceutical cold chain packaging market.
Investors and pharmaceutical manufacturing companies are constantly eyeing the China market due to its large customer size, low cost of shipping, and presence of a large vendor base. Consumers’ preference for better healthcare, safety, and pharmaceutical packaging is helping the cold chain market to improve in the country.
China pharmaceutical cold chain packaging market is expected to exhibit higher growth across East Asia, registering nearly 17.8% CAGR by 2033.
Regional Pharmaceutical Cold Chain Packaging Markets | CAGR (2023 to 2033) |
---|---|
United Kingdom | 13.5% |
China | US$ 15,176.2 million |
India | 16.9% |
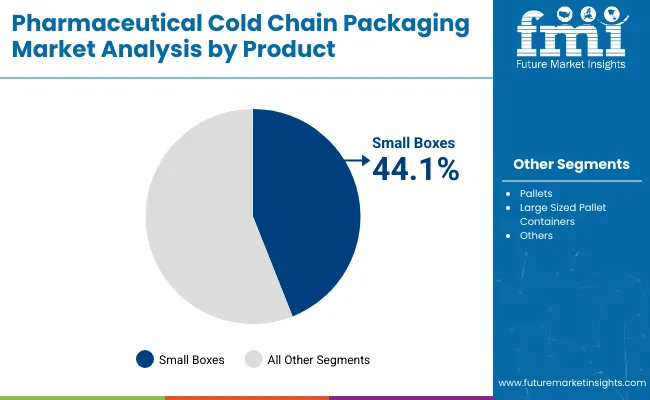
Large-sized pallet containers are heavy-duty containers and can carry up to 2,000 lbs. of load. Also, these containers can be reused and recycled which makes them a sustainable packaging option. The market for large-sized pallet containers is expected to expand at a CAGR of 16.6% during the forecast period.
Large-sized pallet containers contribute nearly 55.5% of global revenue in 2023 and are expected to reach US$ 33.3 billion by 2033.
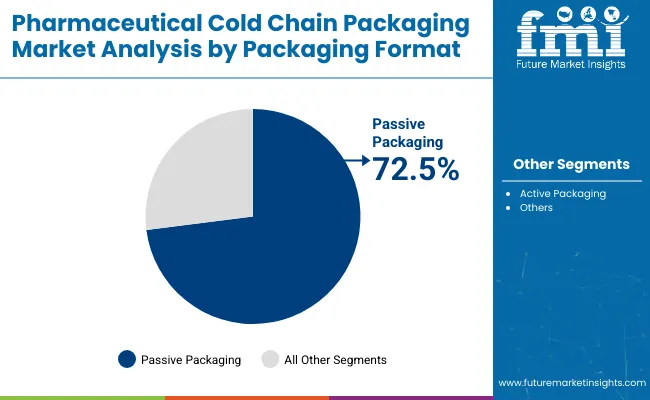
The passive packaging format is expected to reach a market value of US$ 8.0 billion in 2023 and register over 14.3% of the CAGR. Its sub-segment multi-use or reusable packaging segment is projected to grow by 4.4x during the forecast period.
Adding data loggers to passive packaging helps in better monitoring of goods and boosts the sales of the market. Packaging and logistics sustainability is the primary reason for the growth of the segment in the market.
In terms of end use, the market is segmented into diagnostic centers, clinical research organizations, blood banks, and vaccines packaging industry, pharmaceuticals, and other end-use industries.
As per FMI, demand in the pharmaceutical industry is expected to reach over US$ 13 billion in 2033. Demand for pharmaceutical cold chain packaging in vaccine packaging and logistics is expected to increase exponentially due to increasing demand following the outbreak of COVID-19 across the globe.
The vaccine packaging segment is expected to generate an opportunity of over US$ 17 billion by 2033. Increasing demand for vaccines due to COVID-19 is a significant driver for the vaccine packaging market.
Leading manufacturers in the pharmaceutical cold chain packaging market are involved in new product development, partnerships, and investment in advanced technology to reduce packaging prices and improve their market share.
Attribute | Details |
---|---|
Forecast Period | 2023 to 2033 |
Historical Data Available for | 2016 to 2022 |
Market Analysis | US$ million for Value, 000’ Units for Volume |
Key Regions Covered | North America; Latin America; Europe; East Asia; South Asia; Oceania; and the Middle East & Africa |
Key Countries Covered | United States, Canada, Brazil, Mexico, Argentina, Germany, Italy, France, United Kingdom, Spain, BENELUX, Russia, Nordics, Russia, Poland, India, Thailand, Indonesia, Malaysia, China, Japan, South Korea, Australia, New Zealand, GCC Countries, Türkiye, Northern Africa, and South Africa. |
Key Segments Covered | Packaging Format, Product, Material, Application, End Use, and Region |
Key Companies Profiled | Sonoco ThermoSafe; Cold Chain Technologies; Sealed Air Corporation; Nordic Cold Chain Solutions; Cryopak; CSafe Global LLC; TemperPack Technologies, Inc.; Insulated Product Corp.; Global Cooling, Inc.; Envirotainer AB; va-Q-tec AG; EMBALL'ISO; Softbox Systems; Sofrigam SAS; DGP Intelsius LLC; Tempack Packaging Solutions SL; TOWER Cold Chain Solutions; Pelican BioThermal LLC; Blue Star Limited; BIOBASE Group; Andores New Energy Co., Ltd.; Haier Biomedical Co. Ltd.; Tamai Kasei Co., Ltd.; Dhruvraj Syndicate; Valor Industries; KODIAKOOLER; WoolCool Ltd.; Allwin Roto Plast |
Report Coverage | Market Forecast, Company Share Analysis, Competition Intelligence, DROT Analysis, Market Dynamics and Challenges, and Strategic Growth Initiatives |
Customization & Pricing | Available upon Request |
The global pharmaceutical cold chain packaging market is to grow at 14.8% during the forecast period.
The global pharmaceutical cold chain packaging market is predicted to be valued at US$ 60,100.9 million by 2033.
The global pharmaceutical cold chain packaging market was valued at US$ 13,413 million in 2022.
The United States accounts for an 18.6% revenue share of the global pharmaceutical cold chain packaging market.
China is predicted to witness a CAGR of 17.7% through 2033 in the pharmaceutical cold chain packaging market.
1. Executive Summary | Pharmaceutical Cold Chain Packaging Market 1.1. Global Market Overview 1.2. Analysis and Recommendations 2. Market Overview 2.1. Market Definition 2.2. Market Taxonomy 3. Key Market Trends 3.1. Key Trends Impacting the Market 3.2. Product Innovation / Development Trends 4. Key Success Factors 4.1. Product Adoption / Usage Analysis 4.2. Product USPs / Features 5. Global Market Demand Analysis 2016 to 2022 and Forecast, 2023 to 2033 5.1. Historical Market Volume (‘000 Units) Analysis, 2016 to 2022 5.2. Current and Future Market Volume (‘000 Units) Projections, 2023 to 2033 5.3. Y-o-Y Growth Trend Analysis 6. Global Market - Pricing Analysis 6.1. Regional Pricing Analysis, by Material 6.2. Pricing Break-up 6.3. Global Average Pricing Analysis Benchmark 7. Global Market Demand (US$ Million) Analysis 2016 to 2022 and Forecast, 2023 to 2033 7.1. Historical Market Value (US$ Million) Analysis, 2016 to 2022 7.2. Current and Future Market Value (US$ Million) Projections, 2023 to 2033 7.2.1. Y-o-Y Growth Trend Analysis 7.2.2. Absolute $ Opportunity Analysis 8. Market Background 8.1. Global Packaging Market Overview 8.2. Global Plastic Packaging Market Overview 8.3. Global Rigid Packaging Market Outlook 8.4. Global Pharmaceutical Packaging Market Outlook 8.5. Global Healthcare Expenditure Outlook, for Key Region 8.6. Global Market Overview as per API, Part Finished, Finished Goods 8.7. Global Market Overview as per 3PL, Clinical Specialist Logistics, Airlines, Pharmaceutical Company, Contract Manufacturer, Clinical Trial Provider 8.8. Macro-Economic Factors & Co-relation Analysis 8.8.1. Global GDP 8.8.2. GDP Per Capita 8.8.3. Manufacturing Value Added 8.8.4. Rigid Packaging Industry 8.8.5. Packaging Industry 8.9. Forecast Factors - Relevance & Impact 8.9.1. GDP Growth 8.9.2. Segmental Revenue Growth of Key Players 8.9.3. Manufacturing Value Added Growth 8.9.4. Rigid Packaging Industry Growth 8.9.5. Packaging Industry Growth 8.10. Value Chain Analysis 8.10.1. Key Market Participants 8.10.1.1. Raw Material Suppliers 8.10.1.2. Manufacturers 8.10.1.3. End-users 8.10.2. Profitability Margin 8.11. Market Dynamics 8.11.1. Drivers 8.11.2. Restraints 8.11.3. Opportunity Analysis 8.12. Impact of COVID-19 8.12.1. Current Statistics and Probable Future Impact 8.12.2. Impact of COVID-19 on Market 9. Global Market Analysis 2016 to 2022 and Forecast 2023 to 2033, by Packaging Format 9.1. Introduction 9.2. Historical Market Size (US$ Million) and Volume (‘000 Units) Analysis, by Packaging Format, 2016 to 2022 9.3. Current and Future Market Size (US$ Million) and Volume (‘000 Units) Analysis and Forecast, by Packaging Format, 2023 to 2033 9.3.1. Passive Packaging 9.3.1.1. Single Use or One Way Use Packaging 9.3.1.2. Multiple Use or Re-Usable Packaging 9.3.2. Active Packaging 9.3.2.1. Reefer Trucks and Containers 9.3.2.2. Active Pallet Containers 9.4. Market Attractiveness Analysis, by Packaging Format 10. Global Market Analysis 2016 to 2022 and Forecast 2023 to 2033, by Product 10.1. Introduction 10.2. Historical Market Size (US$ Million) and Volume (‘000 Units) Analysis, by Product, 2016 to 2022 10.3. Current and Future Market Size (US$ Million) and Volume (‘000 Units) Analysis and Forecast, by Product, 2023 to 2033 10.3.1. Small Boxes 10.3.2. Pallets 10.3.2.1. Single Pallets 10.3.2.2. Double Pallets 10.3.3. Large Sized Pallet Containers 10.4. Market Attractiveness Analysis, by Product 11. Global Market Analysis 2016 to 2022 and Forecast 2023 to 2033, By Material 11.1. Introduction 11.2. Historical Market Size (US$ Million) and Volume (‘000 Units) Analysis, by Material, 2016 to 2022 11.3. Current and Future Market Size (US$ Million) and Volume (‘000 Units) Analysis and Forecast, by Material, 2023 to 2033 11.3.1. Polymer 11.3.1.1. Polyethylene 11.3.1.2. Polypropylene 11.3.1.3. PET 11.3.1.4. EPS 11.3.1.5. Polyurethane 11.3.1.6. Others 11.3.2. Metal 11.3.3. Paper 11.4. Market Attractiveness Analysis, by Material 12. Global Market Analysis 2016 to 2022 and Forecast 2023 to 2033, by Application 12.1. Introduction 12.2. Historical Market Size (US$ Million) and Volume (‘000 Units) Analysis, by Application, 2016 to 2022 12.3. Current and Future Market Size (US$ Million) and Volume (‘000 Units) Analysis and Forecast, by Application, 2023 to 2033 12.3.1. Biologics and Biological Samples 12.3.2. Vaccines and Diagnostics 12.3.3. Others 12.4. Market Attractiveness Analysis, by Application 13. Global Market Analysis 2016 to 2022 and Forecast 2023 to 2033, by End Use 13.1. Introduction 13.2. Historical Market Size (US$ Million) and Volume (‘000 Units) Analysis, by End Use, 2016 to 2022 13.3. Current and Future Market Size (US$ Million) and Volume (‘000 Units) Analysis and Forecast, by End Use, 2023 to 2033 13.3.1. Diagnostic Centres 13.3.2. Clinical Research Organization 13.3.3. Blood Banks 13.3.4. Vaccines Packaging Industry 13.3.5. Pharmaceuticals 13.3.6. Other Healthcare Units 13.4. Market Attractiveness Analysis, by End Use 14. Global Market Analysis 2016 to 2022 and Forecast 2023 to 2033, by Region 14.1. Introduction 14.2. Historical Market Size (US$ Million) and Volume (‘000 Units) Analysis, by Region, 2016 to 2022 14.3. Current Market Size (US$ Million) and Volume (‘000 Units) Analysis and Forecast, by Region, 2023 to 2033 14.3.1. North America 14.3.2. Latin America 14.3.3. Europe 14.3.4. Middle East and Africa (MEA) 14.3.5. East Asia 14.3.6. South Asia 14.3.7. Oceania 14.4. Market Attractiveness Analysis, by Region 15. North America Market Analysis 2016 to 2022 and Forecast 2023 to 2033 15.1. Introduction 15.2. Historical Market Size (US$ Million) and Volume (‘000 Units) Trend Analysis, by Market Taxonomy, 2016 to 2022 15.3. Market Size (US$ Million) and Volume (‘000 Units) Forecast, by Market Taxonomy, 2023 to 2033 15.3.1. By Country 15.3.1.1. The USA 15.3.1.2. Canada 15.3.2. By Packaging Format 15.3.3. By Product 15.3.4. By Material 15.3.5. By Application 15.3.6. By End Use 15.4. Market Attractiveness Analysis 15.4.1. By Country 15.4.2. By Packaging Format 15.4.3. By Product 15.4.4. By Material 15.4.5. By Application 15.4.6. By End Use 16. Latin America Market Analysis 2016 to 2022 and Forecast 2023 to 2033 16.1. Introduction 16.2. Historical Market Size (US$ Million) and Volume (‘000 Units) Trend Analysis, by Market Taxonomy, 2016 to 2022 16.3. Market Size (US$ Million) and Volume (‘000 Units) Forecast, by Market Taxonomy, 2023 to 2033 16.3.1. By Country 16.3.1.1. Brazil 16.3.1.2. Mexico 16.3.1.3. Argentina 16.3.1.4. Rest of Latin America 16.3.2. By Packaging Format 16.3.3. By Product 16.3.4. By Material 16.3.5. By Application 16.3.6. By End Use 16.4. Market Attractiveness Analysis 16.4.1. By Country 16.4.2. By Packaging Format 16.4.3. By Product 16.4.4. By Material 16.4.5. By Application 16.4.6. By End Use 17. Europe Market Analysis 2016 to 2022 and Forecast 2023 to 2033 17.1. Introduction 17.2. Historical Market Size (US$ Million) and Volume (‘000 Units) Trend Analysis, by Market Taxonomy, 2016 to 2022 17.3. Market Size (US$ Million) and Volume (‘000 Units) Forecast, by Market Taxonomy, 2023 to 2033 17.3.1. By Country 17.3.1.1. Germany 17.3.1.2. Italy 17.3.1.3. France 17.3.1.4. United Kingdom 17.3.1.5. Spain 17.3.1.6. BENELUX 17.3.1.7. Nordics 17.3.1.8. Russia 17.3.1.9. Poland 17.3.1.10. Rest of Europe 17.3.2. By Packaging Format 17.3.3. By Product 17.3.4. By Material 17.3.5. By Application 17.3.6. By End Use 17.4. Market Attractiveness Analysis 17.4.1. By Country 17.4.2. By Packaging Format 17.4.3. By Product 17.4.4. By Material 17.4.5. By Application 17.4.6. By End Use 18. South Asia Market Analysis 2016 to 2022 and Forecast 2023 to 2033 18.1. Introduction 18.2. Historical Market Size (US$ Million) and Volume (‘000 Units) Trend Analysis, by Market Taxonomy, 2016 to 2022 18.3. Market Size (US$ Million) and Volume (‘000 Units) Forecast, by Market Taxonomy, 2023 to 2033 18.3.1. By Country 18.3.1.1. India 18.3.1.2. Thailand 18.3.1.3. Indonesia 18.3.1.4. Malaysia 18.3.1.5. Rest of South Asia 18.3.2. By Packaging Format 18.3.3. By Product 18.3.4. By Material 18.3.5. By Application 18.3.6. By End Use 18.4. Market Attractiveness Analysis 18.4.1. By Country 18.4.2. By Packaging Format 18.4.3. By Product 18.4.4. By Material 18.4.5. By Application 18.4.6. By End Use 19. East Asia Market Analysis 2016 to 2022 and Forecast 2023 to 2033 19.1. Introduction 19.2. Historical Market Size (US$ Million) and Volume (‘000 Units) Trend Analysis, by Market Taxonomy, 2016 to 2022 19.3. Market Size (US$ Million) and Volume (‘000 Units) Forecast, by Market Taxonomy, 2023 to 2033 19.3.1. By Country 19.3.1.1. China 19.3.1.2. Japan 19.3.1.3. South Korea 19.3.2. By Packaging Format 19.3.3. By Product 19.3.4. By Material 19.3.5. By Application 19.3.6. By End Use 19.4. Market Attractiveness Analysis 19.4.1. By Country 19.4.2. By Packaging Format 19.4.3. By Product 19.4.4. By Material 19.4.5. By Application 19.4.6. By End Use 20. Oceania Market Analysis 2016 to 2022 and Forecast 2023 to 2033 20.1. Introduction 20.2. Historical Market Size (US$ Million) and Volume (‘000 Units) Trend Analysis, by Market Taxonomy, 2016 to 2022 20.3. Market Size (US$ Million) and Volume (‘000 Units) Forecast, by Market Taxonomy, 2023 to 2033 20.3.1. By Country 20.3.1.1. Australia 20.3.1.2. New Zealand 20.3.2. By Packaging Format 20.3.3. By Product 20.3.4. By Material 20.3.5. By Application 20.3.6. By End Use 20.4. Market Attractiveness Analysis 20.4.1. By Country 20.4.2. By Packaging Format 20.4.3. By Product 20.4.4. By Material 20.4.5. By Application 20.4.6. By End Use 21. Middle East and Africa Market Analysis 2016 to 2022 and Forecast 2023 to 2033 21.1. Introduction 21.2. Historical Market Size (US$ Million) and Volume (‘000 Units) Trend Analysis, by Market Taxonomy, 2016 to 2022 21.3. Market Size (US$ Million) and Volume (‘000 Units) Forecast, by Market Taxonomy, 2023 to 2033 21.3.1. By Country 21.3.1.1. GCC Countries 21.3.1.2. Turkey 21.3.1.3. Northern Africa 21.3.1.4. South Africa 21.3.1.5. Rest of Middle East and Africa 21.3.2. By Packaging Format 21.3.3. By Product 21.3.4. By Material 21.3.5. By Application 21.3.6. By End Use 21.4. Market Attractiveness Analysis 21.4.1. By Country 21.4.2. By Packaging Format 21.4.3. By Product 21.4.4. By Material 21.4.5. By Application 21.4.6. By End Use 22. Market Country-wise Analysis and Forecast 22.1. USA Market Analysis 2023 & 2033 22.1.1. Market Volume (‘000 Units) and Value (US$ Million) Analysis and Forecast, by Market Taxonomy 22.1.1.1. By Packaging Format 22.1.1.2. By Product 22.1.1.3. By Material 22.1.1.4. By Application 22.1.1.5. By End Use 22.2. Brazil Market Analysis 2023 & 2033 22.2.1. Market Volume (‘000 Units) and Value (US$ Million) Analysis and Forecast, by Market Taxonomy 22.2.1.1. By Packaging Format 22.2.1.2. By Product 22.2.1.3. By Material 22.2.1.4. By Application 22.2.1.5. By End Use 22.3. Germany Market Analysis 2023 & 2033 22.3.1. Market Volume (‘000 Units) and Value (US$ Million) Analysis and Forecast, by Market Taxonomy 22.3.1.1. By Packaging Format 22.3.1.2. By Product 22.3.1.3. By Material 22.3.1.4. By Application 22.3.1.5. By End Use 22.4. GCC Countries Market Analysis 2023 & 2033 22.4.1. Market Volume (‘000 Units) and Value (US$ Million) Analysis and Forecast, by Market Taxonomy 22.4.1.1. By Packaging Format 22.4.1.2. By Product 22.4.1.3. By Material 22.4.1.4. By Application 22.4.1.5. By End Use 22.5. India Market Analysis 2023 & 2033 22.5.1. Market Volume (‘000 Units) and Value (US$ Million) Analysis and Forecast, by Market Taxonomy 22.5.1.1. By Packaging Format 22.5.1.2. By Product 22.5.1.3. By Material 22.5.1.4. By Application 22.5.1.5. By End Use 23. Market Structure Analysis 23.1. Market Analysis, by Tier of Companies 23.2. Market Share Analysis of Top Players 23.3. Market Presence Analysis 23.3.1. By Regional footprint of Players 23.3.2. Product foot print by Players 23.3.3. Channel Foot Print by Players 24. Competition Analysis 24.1. Competition Dashboard 24.2. Competition Benchmarking 24.3. Competition Deep Dive 24.3.1. Global Players 24.3.1.1. Sonoco ThermoSafe 24.3.1.1.1. Overview 24.3.1.1.2. Product Portfolio 24.3.1.1.3. Profitability by Market Segments 24.3.1.1.4. Sales Footprint 24.3.1.1.5. Strategy Overview 24.3.1.1.5.1. Marketing Strategy 24.3.1.1.5.2. Product Strategy 24.3.1.1.5.3. Channel Strategy 24.3.1.2. Cold Chain Technologies 24.3.1.2.1. Overview 24.3.1.2.2. Product Portfolio 24.3.1.2.3. Profitability by Market Segments 24.3.1.2.4. Sales Footprint 24.3.1.2.5. Strategy Overview 24.3.1.2.5.1. Marketing Strategy 24.3.1.2.5.2. Product Strategy 24.3.1.2.5.3. Channel Strategy 24.3.1.3. Sealed Air Corporation 24.3.1.3.1. Overview 24.3.1.3.2. Product Portfolio 24.3.1.3.3. Profitability by Market Segments 24.3.1.3.4. Sales Footprint 24.3.1.3.5. Strategy Overview 24.3.1.3.5.1. Marketing Strategy 24.3.1.3.5.2. Product Strategy 24.3.1.3.5.3. Channel Strategy 24.3.1.4. Nordic Cold Chain Solutions 24.3.1.4.1. Overview 24.3.1.4.2. Product Portfolio 24.3.1.4.3. Profitability by Market Segments 24.3.1.4.4. Sales Footprint 24.3.1.4.5. Strategy Overview 24.3.1.4.5.1. Marketing Strategy 24.3.1.4.5.2. Product Strategy 24.3.1.4.5.3. Channel Strategy 24.3.1.5. Cryopak 24.3.1.5.1. Overview 24.3.1.5.2. Product Portfolio 24.3.1.5.3. Profitability by Market Segments 24.3.1.5.4. Sales Footprint 24.3.1.5.5. Strategy Overview 24.3.1.5.5.1. Marketing Strategy 24.3.1.5.5.2. Product Strategy 24.3.1.5.5.3. Channel Strategy 24.3.1.6. CSafe Global LLC 24.3.1.6.1. Overview 24.3.1.6.2. Product Portfolio 24.3.1.6.3. Profitability by Market Segments 24.3.1.6.4. Sales Footprint 24.3.1.6.5. Strategy Overview 24.3.1.6.5.1. Marketing Strategy 24.3.1.6.5.2. Product Strategy 24.3.1.6.5.3. Channel Strategy 24.3.1.7. TemperPack Technologies, Inc. 24.3.1.7.1. Overview 24.3.1.7.2. Product Portfolio 24.3.1.7.3. Profitability by Market Segments 24.3.1.7.4. Sales Footprint 24.3.1.7.5. Strategy Overview 24.3.1.7.5.1. Marketing Strategy 24.3.1.7.5.2. Product Strategy 24.3.1.7.5.3. Channel Strategy 24.3.1.8. Insulated Product Corp. 24.3.1.8.1. Overview 24.3.1.8.2. Product Portfolio 24.3.1.8.3. Profitability by Market Segments 24.3.1.8.4. Sales Footprint 24.3.1.8.5. Strategy Overview 24.3.1.8.5.1. Marketing Strategy 24.3.1.8.5.2. Product Strategy 24.3.1.8.5.3. Channel Strategy 24.3.1.9. Global Cooling, Inc. 24.3.1.9.1. Overview 24.3.1.9.2. Product Portfolio 24.3.1.9.3. Profitability by Market Segments 24.3.1.9.4. Sales Footprint 24.3.1.9.5. Strategy Overview 24.3.1.9.5.1. Marketing Strategy 24.3.1.9.5.2. Product Strategy 24.3.1.9.5.3. Channel Strategy 24.3.1.10. Envirotainer AB 24.3.1.10.1. Overview 24.3.1.10.2. Product Portfolio 24.3.1.10.3. Profitability by Market Segments 24.3.1.10.4. Sales Footprint 24.3.1.10.5. Strategy Overview 24.3.1.10.5.1. Marketing Strategy 24.3.1.10.5.2. Product Strategy 24.3.1.10.5.3. Channel Strategy 24.3.1.11. va-Q-tec AG 24.3.1.11.1. Overview 24.3.1.11.2. Product Portfolio 24.3.1.11.3. Profitability by Market Segments 24.3.1.11.4. Sales Footprint 24.3.1.11.5. Strategy Overview 24.3.1.11.5.1. Marketing Strategy 24.3.1.11.5.2. Product Strategy 24.3.1.11.5.3. Channel Strategy 24.3.1.12. EMBALL'ISO 24.3.1.12.1. Overview 24.3.1.12.2. Product Portfolio 24.3.1.12.3. Profitability by Market Segments 24.3.1.12.4. Sales Footprint 24.3.1.12.5. Strategy Overview 24.3.1.12.5.1. Marketing Strategy 24.3.1.12.5.2. Product Strategy 24.3.1.12.5.3. Channel Strategy 24.3.1.13. Softbox Systems 24.3.1.13.1. Overview 24.3.1.13.2. Product Portfolio 24.3.1.13.3. Profitability by Market Segments 24.3.1.13.4. Sales Footprint 24.3.1.13.5. Strategy Overview 24.3.1.13.5.1. Marketing Strategy 24.3.1.13.5.2. Product Strategy 24.3.1.13.5.3. Channel Strategy 24.3.1.14. Sofrigam SAS 24.3.1.14.1. Overview 24.3.1.14.2. Product Portfolio 24.3.1.14.3. Profitability by Market Segments 24.3.1.14.4. Sales Footprint 24.3.1.14.5. Strategy Overview 24.3.1.14.5.1. Marketing Strategy 24.3.1.14.5.2. Product Strategy 24.3.1.14.5.3. Channel Strategy 24.3.1.15. DGP Intelsius LLC 24.3.1.15.1. Overview 24.3.1.15.2. Product Portfolio 24.3.1.15.3. Profitability by Market Segments 24.3.1.15.4. Sales Footprint 24.3.1.15.5. Strategy Overview 24.3.1.15.5.1. Marketing Strategy 24.3.1.15.5.2. Product Strategy 24.3.1.15.5.3. Channel Strategy 24.3.1.16. Tempack Packaging Solutions SL 24.3.1.16.1. Overview 24.3.1.16.2. Product Portfolio 24.3.1.16.3. Profitability by Market Segments 24.3.1.16.4. Sales Footprint 24.3.1.16.5. Strategy Overview 24.3.1.16.5.1. Marketing Strategy 24.3.1.16.5.2. Product Strategy 24.3.1.16.5.3. Channel Strategy 24.3.1.17. TOWER Cold Chain Solutions 24.3.1.17.1. Overview 24.3.1.17.2. Product Portfolio 24.3.1.17.3. Profitability by Market Segments 24.3.1.17.4. Sales Footprint 24.3.1.17.5. Strategy Overview 24.3.1.17.5.1. Marketing Strategy 24.3.1.17.5.2. Product Strategy 24.3.1.17.5.3. Channel Strategy 24.3.1.18. Pelican BioThermal LLC 24.3.1.18.1. Overview 24.3.1.18.2. Product Portfolio 24.3.1.18.3. Profitability by Market Segments 24.3.1.18.4. Sales Footprint 24.3.1.18.5. Strategy Overview 24.3.1.18.5.1. Marketing Strategy 24.3.1.18.5.2. Product Strategy 24.3.1.18.5.3. Channel Strategy 24.3.1.19. Blue Star Limited 24.3.1.19.1. Overview 24.3.1.19.2. Product Portfolio 24.3.1.19.3. Profitability by Market Segments 24.3.1.19.4. Sales Footprint 24.3.1.19.5. Strategy Overview 24.3.1.19.5.1. Marketing Strategy 24.3.1.19.5.2. Product Strategy 24.3.1.19.5.3. Channel Strategy 24.3.1.20. BIOBASE Group 24.3.1.20.1. Overview 24.3.1.20.2. Product Portfolio 24.3.1.20.3. Profitability by Market Segments 24.3.1.20.4. Sales Footprint 24.3.1.20.5. Strategy Overview 24.3.1.20.5.1. Marketing Strategy 24.3.1.20.5.2. Product Strategy 24.3.1.20.5.3. Channel Strategy 24.3.1.21. Andores New Energy Co., Ltd. 24.3.1.21.1. Overview 24.3.1.21.2. Product Portfolio 24.3.1.21.3. Profitability by Market Segments 24.3.1.21.4. Sales Footprint 24.3.1.21.5. Strategy Overview 24.3.1.21.5.1. Marketing Strategy 24.3.1.21.5.2. Product Strategy 24.3.1.21.5.3. Channel Strategy 24.3.1.22. Haier Biomedical Co. Ltd. 24.3.1.22.1. Overview 24.3.1.22.2. Product Portfolio 24.3.1.22.3. Profitability by Market Segments 24.3.1.22.4. Sales Footprint 24.3.1.22.5. Strategy Overview 24.3.1.22.5.1. Marketing Strategy 24.3.1.22.5.2. Product Strategy 24.3.1.22.5.3. Channel Strategy 24.3.1.23. Tamai Kasei Co., Ltd. 24.3.1.23.1. Overview 24.3.1.23.2. Product Portfolio 24.3.1.23.3. Profitability by Market Segments 24.3.1.23.4. Sales Footprint 24.3.1.23.5. Strategy Overview 24.3.1.23.5.1. Marketing Strategy 24.3.1.23.5.2. Product Strategy 24.3.1.23.5.3. Channel Strategy 24.3.1.24. Dhruvraj Syndicate 24.3.1.24.1. Overview 24.3.1.24.2. Product Portfolio 24.3.1.24.3. Profitability by Market Segments 24.3.1.24.4. Sales Footprint 24.3.1.24.5. Strategy Overview 24.3.1.24.5.1. Marketing Strategy 24.3.1.24.5.2. Product Strategy 24.3.1.24.5.3. Channel Strategy 24.3.1.25. Valor Industries 24.3.1.25.1. Overview 24.3.1.25.2. Product Portfolio 24.3.1.25.3. Profitability by Market Segments 24.3.1.25.4. Sales Footprint 24.3.1.25.5. Strategy Overview 24.3.1.25.5.1. Marketing Strategy 24.3.1.25.5.2. Product Strategy 24.3.1.25.5.3. Channel Strategy 24.3.1.26. KODIAKOOLER 24.3.1.26.1. Overview 24.3.1.26.2. Product Portfolio 24.3.1.26.3. Profitability by Market Segments 24.3.1.26.4. Sales Footprint 24.3.1.26.5. Strategy Overview 24.3.1.26.5.1. Marketing Strategy 24.3.1.26.5.2. Product Strategy 24.3.1.26.5.3. Channel Strategy 24.3.1.27. WoolCool Ltd. 24.3.1.27.1. Overview 24.3.1.27.2. Product Portfolio 24.3.1.27.3. Profitability by Market Segments 24.3.1.27.4. Sales Footprint 24.3.1.27.5. Strategy Overview 24.3.1.27.5.1. Marketing Strategy 24.3.1.27.5.2. Product Strategy 24.3.1.27.5.3. Channel Strategy 24.3.1.28. Allwin Roto Plast 24.3.1.28.1. Overview 24.3.1.28.2. Product Portfolio 24.3.1.28.3. Profitability by Market Segments 24.3.1.28.4. Sales Footprint 24.3.1.28.5. Strategy Overview 24.3.1.28.5.1. Marketing Strategy 24.3.1.28.5.2. Product Strategy 24.3.1.28.5.3. Channel Strategy 25. Assumptions and Acronyms Used 26. Research Methodology
Explore Packaging Insights
View Reports