Reports

- Global Locations -

Headquarters

Future Market Insights, Inc.

Christiana Corporate, 200
Continental Drive, Suite 401,
Newark, Delaware - 19713,
United States

T: +1-845-579-5705

Americas

Future Market Insights, Inc.

616 Corporate Way, Suite 2-9018,
Valley Cottage, NY 10989, United States

T: +1-347-918-3531

MEA

Future Market Insights

1602-6 Jumeirah Bay X2 Tower, Plot No: JLT-PH2-X2A,
Jumeirah Lakes Towers, Dubai,
United Arab Emirates

Europe

Future Market Insights

3rd Floor, 207 Regent Street,
W1B 3HH London
United Kingdom

T: + 44 (0) 20 8123 9659
D: +44 (0) 20 3287 4268

Asia Pacific

Future Market Insights

IndiaLand Global Tech Park, Unit UG-1, Behind Grand HighStreet, Phase 1, Hinjawadi, MH, Pune – 411057, India

Pharmaceutical Grade Sodium Carbonate Market Outlook (2022-2028)

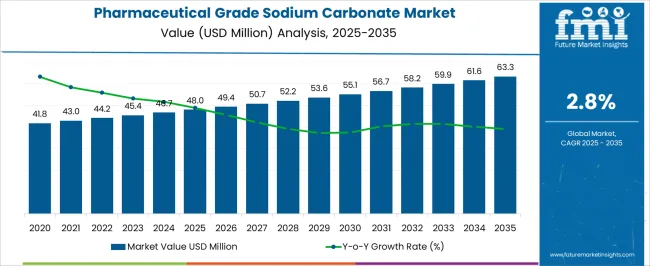
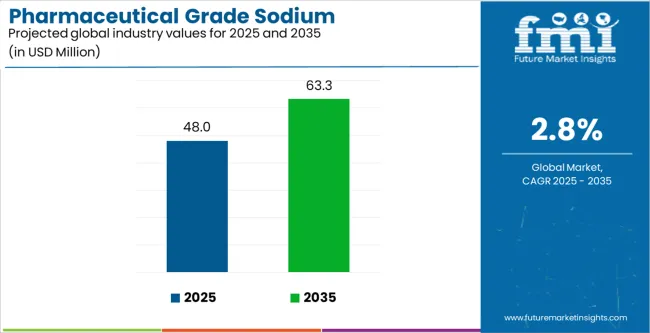
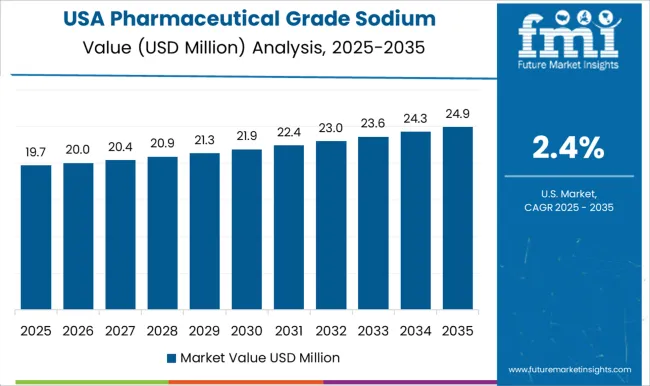
[208 pages Report]  The global pharmaceutical grade sodium carbonate market is expected to be worth US$ 44.1 Mn in 2022, and is predicted to progress at a CAGR of 2.5% to bring in revenue worth US$ 51 Mn by 2028.

Attribute Details
Pharmaceutical Grade Sodium Carbonate Market Size (2022) US$ 44.1 million
Pharmaceutical Grade Sodium Carbonate Sales Forecast (2028) US$ 51 million
Global Market Growth Rate (2022-2028) 2.5% CAGR
Dominant Application (2022) APIs – 45.8% Share

Sales of pharmaceutical grade sodium carbonate account for 1% share of the global sodium carbonate market. Increasing use of pharmaceutical grade sodium carbonate in drug manufacturing as an active pharmaceutical ingredients (APIs) is majorly driving market growth.

Don't pay for what you don't need

Customize your report by selecting specific countries or regions and save 30%!

How The Market Progressed Till June 2022?

Market Statistics Details
H1,2021 (A) 2.8%
H1,2022 Projected (P) 2.6%
H1,2022 Outlook (O) 2.5%
BPS Change : H1,2022 (O) - H1,2022 (P) (-) 30 ↓
BPS Change : H1,2022 (O) - H1,2021 (A) (-) 10 ↓

Future Market Insights anticipate a comparison and review analysis of the dynamics of the pharmaceutical grade sodium carbonate market. The market growth has been significantly influenced by certain macro-economic factors including medical sector growth, increase investments in healthcare sector and others.

Some new trends have been observed in the market, includes mergers & acquisitions activities to strengthen the global position in the global market. In addition to this, key players are also focusing on the expansion of their production capacities to fulfill the growing demand.

According to FMI analysis, the variation between the BPS values observed in the pharmaceutical grade sodium carbonate market in H1, 2022 - Outlook over H1, 2022 Projected reflects a decline of 30 units. However, compared to H1, 2021, the market is expected to again witness a decline of 10 BPS in H1 -2022.

Key reasons for this change in growth rate are attributed to the slow uptake of the market during the first half of the forecast period, owing to the high cost of pharma grade of sodium carbonate manufacturing and procurement.

Despite these challenges, some likely prospects lead the industry, which includes the use of pharmaceutical grade sodium carbonate in the personal care & cosmetics industry, where it is used in hair colors & skin products, and toothpaste. Pharmaceutical grade sodium carbonate sales are also expected to be boosted by expanding pharmaceutical grade sodium carbonate applications for the production of active pharmaceutical ingredients.

Pharmaceutical Grade Sodium Carbonate Consumption Analysis (2013 to 2021) Vs Market Forecasts (2022 to 2028)

Sodium carbonate, also known as soda ash, has seen substantial increase in demand over the past few years as its scope of application has increased across various industry verticals. The most prominent demand for pharmaceutical grade sodium carbonate is from the pharmaceutical sector, where it’s used as an API in drug manufacturing to upgrade the medication capacity of manufactured drugs.

During the historic period of 2013 to 2021, pharmaceutical grade sodium carbonate shipments increase at a steady CAGR of 3.3%.

Increasing demand for drugs, rising usage of pharmaceutical grade sodium carbonate as an API in drug manufacturing, and research & development increasing the scope of application are major factors propelling pharmaceutical grade sodium carbonate sales. However, high cost of pharmaceutical grade sodium carbonate manufacturing and procurement drives up the price, which affects market potential adversely and restrains pharmaceutical grade sodium carbonate sales to some extent.

Pharmaceutical Grade Sodium Carbonate Market

Use of pharmaceutical grade sodium carbonate in the personal care industry is also expected to significantly direct demand over the forecast period. Soda ash is used in personal care products such as toothpastes, hair colors, skin products, etc.

Pharmaceutical grade sodium carbonate shipments are anticipated to rise at a CAGR of 2.5% from 2022 to 2028.

What is the Outlook for Pharmaceutical Grade Sodium Carbonate in Different Regions?

This pharmaceutical grade sodium carbonate research report covers detailed analysis of regional markets such as North America, Latin America, Europe, East Asia, South Asia & Pacific, and the Middle East & Africa (MEA).

Pharmaceutical grade sodium carbonate consumption in North America is expected to be significant over the forecast period. This high demand for pharmaceutical grade sodium carbonate can be attributed to increased drug usage in the region as well as the presence of major pharmaceutical manufacturing companies.

The Europe pharmaceutical grade sodium carbonate market is anticipated to see an increase in demand at a similar growth rate to that of the North American market.

Pharmaceutical grade sodium carbonate demand in East Asia and South Asia is expected to see a major rise over the forecast period as these regions see increasing use of pharmaceutical grade sodium carbonate across multiple industry verticals and applications. Emergence of new pharmaceutical companies and increase in drug manufacturing are also expected to drive demand for pharmaceutical grade sodium carbonate in these regions.

Sales of pharmaceutical grade sodium carbonate in the MEA region are expected to see sluggish growth over the coming years. Demand is anticipated to rise as industrialization paces in the region and the use of pharmaceutical drugs increases.

Nikhil Kaitwade
Nikhil Kaitwade

Principal Consultant

Talk to Analyst

Find your sweet spots for generating winning opportunities in this market.

Country-wise Analysis

What Can Industry Players Expect from the India Pharmaceutical Grade Sodium Carbonate Market?

The developmental nature of the world’s second-largest populated nation of India makes it a very lucrative manufacturing as well as distribution market. India is seeing rapid urbanization and industrialization, which is fuelling the import as well as export of pharmaceutical grade sodium carbonate from the nation. India is an important market for drug sales and drug manufacturing, as both markets have untapped potential.

Pharmaceutical grade sodium carbonate providers in India are expected to see major changes over the forecast period as pharmaceutical grade sodium carbonate consumption changes and demand increases.

Why is China a Lucrative Market for Pharmaceutical Grade Sodium Carbonate Suppliers?

China has a well-established manufacturing sector and is known to be one of the most important manufacturing markets in the world. China is also a major provider of the raw materials required for pharmaceutical drugs, and is an important market for many pharmaceutical companies.

Increasing global demand for pharmaceutical grade sodium carbonate is expected to benefit Chinese pharmaceutical grade sodium carbonate suppliers as they are capable of ramping up their production capacity to meet the high demand.

Government support and rising investments from investors across the world are expected to provide an extremely profitable setting for the export of pharmaceutical grade sodium carbonate from China.

Category-wise Analysis

Which Application Dominates Pharmaceutical Grade Sodium Carbonate Demand?

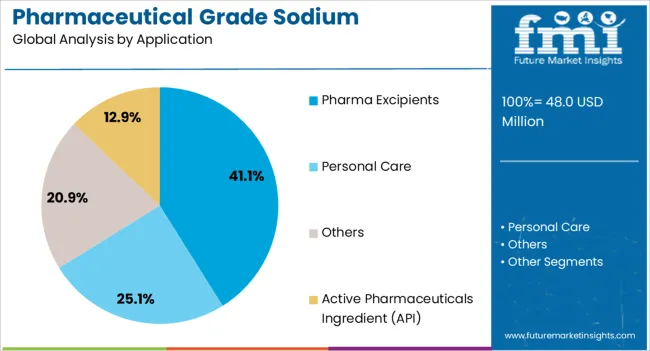
Pharmaceutical grade sodium carbonate is used in multiple applications and has a wide scope of application that is increasing with rising research & development by major pharmaceutical grade sodium carbonate producers. The most prominent application is APIs, with the segment expected to hold a majority share of 45.8% of the global pharmaceutical grade sodium carbonate sector.

Dominance is expected to continue over the forecast period due to the high scope of use in many pharmaceutical companies. It is used for drug enhancement and also as a pharmaceutical excipient.

COVID-19 Crisis Survey

In the first quarter of 2020, the world was faced with the COVID-19 crisis that completely redefined the way we function. The healthcare industry majorly saw changes in terms of demand and ways of operation as well.

Demand for pharmaceutical drugs saw a major increase during the pandemic, but limited manufacturing potential due to lockdown restrictions caused a gap in demand and supply chains. As the demand for drugs increased so did the consumption of pharmaceutical grade sodium carbonate, as it is an important ingredient in drug manufacturing.

The complete potential of the pharmaceutical grade sodium carbonate market was restrained during the pandemic, but as the world returns to normalcy in the post-pandemic era, pharmaceutical grade sodium carbonate shipments are expected to see a steady increase.

Increasing scope of pharmaceutical grade sodium carbonate application across multiple industry verticals due to research & development is also anticipated to fuel pharmaceutical grade sodium carbonate sales.

Get the data you need at a Fraction of the cost

Personalize your report by choosing insights you need
and save 40%!

Competitive Landscape

Pharmaceutical grade sodium carbonate providers are focusing and investing in expanding their production capabilities to cater to increasing demand. Pharmaceutical grade sodium carbonate manufacturers are also focusing on mergers and acquisitions to increase their geographical presence and market share on a global scale.

  • In November 2021, Turkish soda ash companies - ?i?ecam and Ciner Group - announced that they would collaboratively invest US$ 4 Bn in the market to increase their business output. Ciner Group entered the U.S. market with the purchase of OCI Chemical in Wyoming. With this new deal, ?i?ecam is set to increase its ownership in the Wyoming plant and the Pacific project up to 60%.
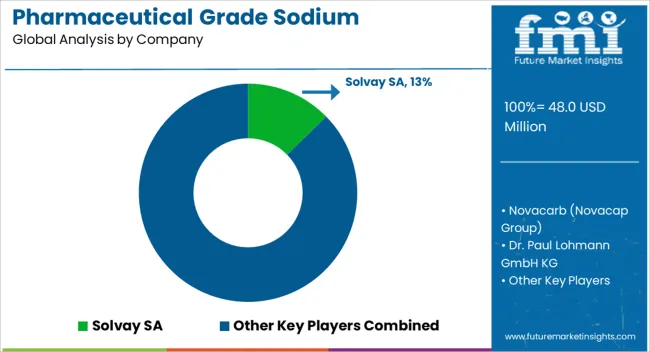
  • Solvay, the world’s largest producer of sodium carbonate (soda ash), announced its plans to make its soda ash business a completely separate entity, and this will also be part of the company’s emission control efforts. The firm aims to phase out the use of coal in soda ash plants by the end of 2030. Its soda ash plant in Rheinberg, Germany, in 2021, became the first plant to be completely powered by renewable energy.

Pharmaceutical Grade Sodium Carbonate Industry Report Scope

Attribute Details
Forecast Period 2022 to 2028
Historical Data Available for 2013 to 2021
Market Analysis US$ Mn for Value
Key Regions Covered
  • North America
  • Latin America
  • Europe
  • East Asia
  • South Asia & Pacific
  • Middle East & Africa (MEA)
Key Countries Covered
  • United States
  • Canada
  • Brazil
  • Mexico
  • Germany
  • UK
  • France
  • Spain
  • Italy
  • China
  • Japan
  • South Korea
  • India
  • Indonesia
  • Malaysia
  • Singapore
  • Australia
  • New Zealand
  • Turkey
  • South Africa
  • and GCC Countries
Key Market Segments Covered
  • Grade
  • Application
  • Region
Key Companies Profiled
  • Solvay SA
  • Novacarb (Novacap Group)
  • Dr. Paul Lohmann GmbH KG
  • CIECH S.A.
  • Natural Soda LLC
  • Jost Chemical Co.
  • Tianjin Chengyuan Chemical Co. Ltd.
  • Weifang Hongyuan Chemical Co. Ltd.
  • Tronox Alkali Corporation
Pricing Available upon Request

Key Segments of Pharmaceutical Grade Sodium Carbonate Industry Survey

Pharmaceutical Grade Sodium Carbonate Market by Grade:

  • Fine Pharmaceutical Grade Sodium Carbonate
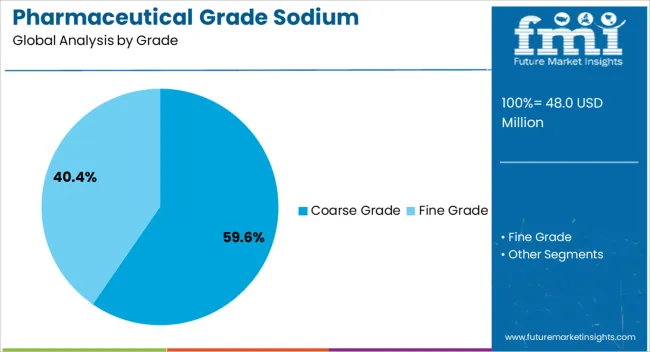
  • Coarse Pharmaceutical Grade Sodium Carbonate

Pharmaceutical Grade Sodium Carbonate Market by Application:

  • Pharmaceutical Grade Sodium Carbonate for API
  • Pharmaceutical Grade Sodium Carbonate for Pharma Excipients
  • Pharmaceutical Grade Sodium Carbonate for Personal Care
  • Others

Pharmaceutical Grade Sodium Carbonate Market by Region:

  • North America Pharmaceutical Grade Sodium Carbonate Market
  • Latin America Pharmaceutical Grade Sodium Carbonate Market
  • Europe Pharmaceutical Grade Sodium Carbonate Market
  • East Asia Pharmaceutical Grade Sodium Carbonate Market
  • South Asia & Pacific Pharmaceutical Grade Sodium Carbonate Market
  • Middle East & Africa (MEA) Pharmaceutical Grade Sodium Carbonate Market

Frequently Asked Questions

What is the expected pharmaceutical grade sodium carbonate market revenue for 2022?

As per these pharmaceutical grade sodium carbonate industry insights, sales revenue is expected to rake in US$ 44.1 Mn in 2022.

Which pharmaceutical grade sodium carbonate application holds the highest market share?

Active pharmaceutical ingredient application of pharmaceutical grade sodium carbonate holds a major market share of 45.8%.

At what pace is the global market for pharmaceutical grade sodium carbonate estimated to grow?

The global pharmaceutical grade sodium carbonate industry is estimated to rise at a sluggish CAGR of 2.5% through 2028.

What is the estimated net worth for pharmaceutical grade sodium carbonate market by 2028?

By 2028, the pharmaceutical grade sodium carbonate market is predicted to reach a market value of US$ 51 Mn.

What was the market growth rate from 2013 to 2021?

Pharmaceutical grade sodium carbonate sales saw evolution at a CAGR of 3.3% from 2013 to 2021.

Table of Content

1. Executive Summary

    1.1. Overview

    1.2. Market Analysis

    1.3. Market Scenario

    1.4. FMI Analysis and Recommendations

    1.5. Wheel of Fortune

2. Market Introduction

    2.1. Market Taxonomy

    2.2. Market Definition

3. Market Viewpoint

    3.1. Macro-Economic Factors

        3.1.1. Global GDP Growth Rate Outlook

        3.1.2. Global Chemicals Industry Outlook

        3.1.3. Global Pharmaceutical Industry Outlook

        3.1.4. Global Sodium Carbonate Industry Outlook 

            3.1.4.1. Soda Ash World Resources

            3.1.4.2. Sodium Carbonate: Supply Demand Scenario

            3.1.4.3. Sodium Carbonate per capita consumption in developing economies

            3.1.4.4. Global Sodium Carbonate Supply Demand Analysis

                3.1.4.4.1. North America (Export, Import) Analysis

                3.1.4.4.2. Latin America (Export, Import) Analysis

                3.1.4.4.3. India (Production, Consumption, Export, Import) Analysis

                3.1.4.4.4. Japan (Export, Import) Analysis

                3.1.4.4.5. Western Europe (Production, Export, Import) Analysis

                3.1.4.4.6. Middle East and Africa (Production, Export, Import) Analysis

                3.1.4.4.7. Eastern Europe (Production, Export, Import) Analysis

                3.1.4.4.8. Asia Pacific excluding Japan (Production, Export, Import) Analysis

    3.2. Key Regulations

4. Global Pharmaceutical Grade Sodium Carbonate Market Analysis 2013–2021 and Forecast 2022–2028

    4.1. Introduction

        4.1.1. Market Value Projections

        4.1.2. Market Volume Projections

        4.1.3. Market Size and Y-o-Y Growth

        4.1.4. Absolute $ Opportunity

    4.2. Global Supply Demand Scenario

    4.3. Global Market Dynamics

        4.3.1. Drivers

        4.3.2. Restraints

        4.3.3. Trends

    4.4. Value Chain Analysis

    4.5. Global Pricing Analysis

    4.6. Forecast Factors: Relevance and Impact

    4.7. Potential End Users in API and Excipients Segment

    4.8. Potential End Users in Personal Care Segment

5. Global Pharmaceutical Grade Sodium Carbonate Market Analysis 2013–2021 and Forecast 2022–2028 By Application

    5.1. Introduction / Key Findings

    5.2. Historical Market Size (US$ Mn) and Volume Analysis By Application, 2013–2021

    5.3. Current Market Size (US$ Mn) and Volume Forecast By Application, 2022–2028

        5.3.1. API

        5.3.2. Pharma excipients

        5.3.3. Personal Care

        5.3.4. Others 

    5.4. Market Attractiveness Analysis By Application

6. Global Pharmaceutical Grade Sodium Carbonate Market Analysis 2013–2021 and Forecast 2022–2028 By Grade

    6.1. Introduction / Key Findings

    6.2. Historical Market Size (US$ Mn) and Volume Analysis By Grade, 2013–2021

    6.3. Current Market Size (US$ Mn) and Volume Forecast By Grade, 2022–2028

        6.3.1. Fine

        6.3.2. Coarse

    6.4. Market Attractiveness Analysis By Grade

7. Global Pharmaceutical Grade Sodium Carbonate Market Analysis 2013–2021 and Forecast 2022–2028 By Region

    7.1. Introduction / Key Findings

    7.2. Historical Market Size (US$ Mn) and Volume Analysis By Region, 2013–2021

    7.3. Current Market Size (US$ Mn) and Volume Forecast By Region, 2022–2028

        7.3.1. North America

        7.3.2. Latin America

        7.3.3. Asia Pacific Excluding Japan

        7.3.4. Western Europe

        7.3.5. Eastern Europe

        7.3.6. Middle East and Africa

        7.3.7. Japan

        7.3.8. India

    7.4. Market Attractiveness Analysis By Region

8. North America Pharmaceutical Grade Sodium Carbonate Market Analysis 2013–2021 and Forecast 2022–2028

    8.1. Introduction

    8.2. Historical Market Size (US$ Mn) and Volume Analysis By Market Taxonomy, 2013–2021

        8.2.1. By Country

        8.2.2. By Application

        8.2.3. By Grade

    8.3. Current Market Size (US$ Mn) and Volume Forecast By Country 2022–2028

        8.3.1. U.S.

        8.3.2. Canada

    8.4. Current Market Size (US$ Mn) and Volume Forecast By Application 2022–2028

        8.4.1. API

        8.4.2. Pharma excipients

        8.4.3. Personal Care

        8.4.4. Others

    8.5. Current Market Size (US$ Mn) and Volume Forecast By Grade 2022–2028

        8.5.1. Fine

        8.5.2. Coarse

    8.6. Market Attractiveness Analysis

        8.6.1. By Country

        8.6.2. By Application

        8.6.3. By Grade

9. Latin America Pharmaceutical Grade Sodium Carbonate Market Analysis 2013–2021 and Forecast 2022–2028

    9.1. Introduction

    9.2. Historical Market Size (US$ Mn) and Volume Analysis By Market Taxonomy, 2013–2021

        9.2.1. By Country

        9.2.2. By Application

        9.2.3. By Grade

    9.3. Current Market Size (US$ Mn) and Volume Forecast By Country 2022–2028

        9.3.1. Brazil

        9.3.2. Mexico

        9.3.3. Rest of Latin America

    9.4. Current Market Size (US$ Mn) and Volume Forecast By Application 2022–2028

        9.4.1. API

        9.4.2. Pharma excipients

        9.4.3. Personal Care

        9.4.4. Others

    9.5. Current Market Size (US$ Mn) and Volume Forecast By Grade 2022–2028

        9.5.1. Fine

        9.5.2. Coarse

    9.6. Drivers and Restraints: Impact Analysis

    9.7. Market Attractiveness Analysis

        9.7.1. By Country

        9.7.2. By Application

        9.7.3. By Grade

10. Asia Pacific Excl. Japan Pharmaceutical Grade Sodium Carbonate Market Analysis 2013–2021 and Forecast 2022–2028

    10.1. Introduction

    10.2. Key Regulations

    10.3. Pricing Analysis

    10.4. Historical Market Size (US$ Mn) and Volume Analysis By Market Taxonomy, 2013–2021

        10.4.1. By Country

        10.4.2. By Application

        10.4.3. By Grade

    10.5. Current Market Size (US$ Mn) and Volume Forecast By Country 2022–2028

        10.5.1. China

        10.5.2. ASEAN

        10.5.3. Australia and New Zealand

        10.5.4. Rest of APEJ

    10.6. Current Market Size (US$ Mn) and Volume Forecast By Application 2022–2028

        10.6.1. API

        10.6.2. Pharma excipients

        10.6.3. Personal Care

        10.6.4. Others

    10.7. Current Market Size (US$ Mn) and Volume Forecast By Grade 2022–2028

        10.7.1. Fine

        10.7.2. Coarse

    10.8. Drivers and Restraints: Impact Analysis

    10.9. Market Attractiveness Analysis

        10.9.1. By Country

        10.9.2. By Application

        10.9.3. By Grade

11. Western Europe Pharmaceutical Grade Sodium Carbonate Market Analysis 2013–2021 and Forecast 2022–2028

    11.1. Introduction

    11.2. Historical Market Size (US$ Mn) and Volume Analysis By Market Taxonomy, 2013–2021

        11.2.1. By Country

        11.2.2. By Application

        11.2.3. By Grade

    11.3. Current Market Size (US$ Mn) and Volume Forecast By Country 2022–2028

        11.3.1. Germany

        11.3.2. Italy

        11.3.3. France

        11.3.4. U.K.

        11.3.5. Spain

        11.3.6. Rest of Western Europe

    11.4. Current Market Size (US$ Mn) and Volume Forecast By Application 2022–2028

        11.4.1. API

        11.4.2. Pharma excipients

        11.4.3. Personal Care

        11.4.4. Others

    11.5. Current Market Size (US$ Mn) and Volume Forecast By Grade 2022–2028

        11.5.1. Fine

        11.5.2. Coarse

    11.6. Drivers and Restraints: Impact Analysis

    11.7. Market Attractiveness Analysis

        11.7.1. By Country

        11.7.2. By Application

        11.7.3. By Grade

12. Eastern Europe Pharmaceutical Grade Sodium Carbonate Market Analysis 2013–2021 and Forecast 2022–2028

    12.1. Introduction

    12.2. Historical Market Size (US$ Mn) and Volume Analysis By Market Taxonomy, 2013–2021

        12.2.1. By Country

        12.2.2. By Application

        12.2.3. By Grade

    12.3. Current Market Size (US$ Mn) and Volume Forecast By Country 2022–2028

        12.3.1. Russia

        12.3.2. Poland

        12.3.3. Rest of Eastern Europe

    12.4. Current Market Size (US$ Mn) and Volume Forecast By Application 2022–2028

        12.4.1. API

        12.4.2. Pharma excipients

        12.4.3. Personal Care

        12.4.4. Others

    12.5. Current Market Size (US$ Mn) and Volume Forecast By Grade 2022–2028

        12.5.1. Fine

        12.5.2. Coarse

    12.6. Drivers and Restraints: Impact Analysis

    12.7. Market Attractiveness Analysis

        12.7.1. By Country

        12.7.2. By Application

        12.7.3. By Grade

13. India Pharmaceutical Grade Sodium Carbonate Analysis 2013–2021 and Forecast 2022–2028

    13.1. Introduction

    13.2. Historical Market Size (US$ Mn) and Volume Analysis By Market Taxonomy, 2013–2021

        13.2.1. By Application

        13.2.2. By Grade

    13.3. Current Market Size (US$ Mn) and Volume Forecast By Application 2022–2028

        13.3.1. API

        13.3.2. Pharma excipients

        13.3.3. Personal Care

        13.3.4. Others

    13.4. Current Market Size (US$ Mn) and Volume Forecast By Grade 2022–2028

        13.4.1. Fine

        13.4.2. Coarse

    13.5. Market Attractiveness Analysis

        13.5.1. By Application

        13.5.2. By Grade

14. Japan Pharmaceutical Grade Sodium Carbonate Analysis 2013–2021 and Forecast 2022–2028

    14.1. Introduction

    14.2. Historical Market Size (US$ Mn) and Volume Analysis By Market Taxonomy, 2013–2021

        14.2.1. By Application

        14.2.2. By Grade

    14.3. Current Market Size (US$ Mn) and Volume Forecast By Application 2022–2028

        14.3.1. API

        14.3.2. Pharma excipients

        14.3.3. Personal Care

        14.3.4. Others

    14.4. Current Market Size (US$ Mn) and Volume Forecast By Grade 2022–2028

        14.4.1. Fine

        14.4.2. Coarse

    14.5. Market Attractiveness Analysis

        14.5.1. By Application

        14.5.2. By Grade

15. Middle East and Africa Pharmaceutical Grade Sodium Carbonate Market Analysis 2013–2021 and Forecast 2022–2028

    15.1. Introduction

    15.2. Historical Market Size (US$ Mn) and Volume Analysis By Market Taxonomy, 2013–2021

        15.2.1. By Country

        15.2.2. By Application

        15.2.3. By Grade

    15.3. Current Market Size (US$ Mn) and Volume Forecast By Country 2022–2028

        15.3.1. Gulf Co-Operation Council (GCC) Countries

        15.3.2. Northern Africa

        15.3.3. Turkey

        15.3.4. South Africa

        15.3.5. Rest of MEA

    15.4. Current Market Size (US$ Mn) and Volume Forecast By Application 2022–2028

        15.4.1. API

        15.4.2. Pharma excipients

        15.4.3. Personal Care

        15.4.4. Others

    15.5. Current Market Size (US$ Mn) and Volume Forecast By Grade 2022–2028

        15.5.1. Fine

        15.5.2. Coarse

    15.6. Market Attractiveness Analysis

        15.6.1. By Country

        15.6.2. By Application

        15.6.3. By Grade

16. Competition Landscape

    16.1. Market Structure

    16.2. Competition Dashboard

    16.3. Company Profiles (Details – Overview, Financials, Strategy, Recent Developments)

        16.3.1. Solvay SA

        16.3.2. Novacarb (Novacap Group)

        16.3.3. Dr. Paul Lohmann GmbH KG

        16.3.4. CIECH S.A.

        16.3.5. Natural Soda LLC

        16.3.6. Jost Chemical Co.

        16.3.7. Tianjin Chengyuan Chemical Co., Ltd.

        16.3.8. Weifang Hongyuan Chemical Co., Ltd

        16.3.9. Tronox Alkali Corporation

17. Research Methodology

Don't pay for what you don't need

Customize your report by selecting specific countries or regions and save 30%!

List of Tables

Table 01: Key Metrics of Carbonate Salts

Table 02: World Chemicals Sales (US$ Bn), 2021

Table 03: Potential End-Users of Pharmaceutical Grade Sodium Carbonate (API & Excipients Segment)

Table 04: Potential End-Users of Pharmaceutical Grade Sodium Carbonate (Personal Care Segment)

Table 05: Estimated World Production of Soda Ash, By Country, 2011 - 2015

Table 06: Global Pharmaceutical Grade Sodium Carbonate Market Value (US$ Mn) and Volume (MT) by Grade, 2013 – 2028

Table 07: Global Pharmaceutical Grade Sodium Carbonate Market Value (US$ Mn) and Volume (MT) by Application, 2013 – 2028

Table 08: Global Pharmaceutical Grade Sodium Carbonate Market Value (US$ Mn) and Volume (MT) by Region, 2013 – 2028

Table 09: North America Pharmaceutical Grade Sodium Carbonate Market Value (US$ Mn) and Volume (MT) by Grade, 2013 – 2028

Table 10: North America Pharmaceutical Grade Sodium Carbonate Market Value (US$ Mn) and Volume (MT) by Application, 2013 – 2028

Table 11: North America Pharmaceutical Grade Sodium Carbonate Market Value (US$ Mn) and Volume (MT) by Country, 2013 – 2028

Table 12: Latin America Pharmaceutical Grade Sodium Carbonate Market Value (US$ Mn) and Volume (MT) by Grade, 2013 – 2028

Table 13: Latin America Pharmaceutical Grade Sodium Carbonate Market Value (US$ Mn) and Volume (MT) by Application, 2013 – 2028

Table 14: Latin America Pharmaceutical Grade Sodium Carbonate Market Value (US$ Mn) and Volume (MT) by Country, 2013 – 2028

Table 15: Western Europe Pharmaceutical Grade Sodium Carbonate Market Value (US$ Mn) and Volume (MT) by Grade, 2013 – 2028

Table 16: Western Europe Pharmaceutical Grade Sodium Carbonate Market Value (US$ Mn) and Volume (MT) by Application, 2013 – 2028

Table 17: Western Europe Pharmaceutical Grade Sodium Carbonate Market Value (US$ Mn) and Volume (MT) by Country, 2013 – 2028

Table 18: Eastern Europe Pharmaceutical Grade Sodium Carbonate Market Value (US$ Mn) and Volume (MT) by Grade, 2013 – 2028

Table 19: Eastern Europe Pharmaceutical Grade Sodium Carbonate Market Value (US$ Mn) and Volume (MT) by Application, 2013 – 2028

Table 20: Eastern Europe Pharmaceutical Grade Sodium Carbonate Market Value (US$ Mn) and Volume (MT) by Country, 2013 – 2028

Table 21: APEJ Pharmaceutical Grade Sodium Carbonate Market Value (US$ Mn) and Volume (MT) by Grade, 2013 – 2028

Table 22: APEJ Pharmaceutical Grade Sodium Carbonate Market Value (US$ Mn) and Volume (MT) by Application, 2013 – 2028

Table 23: APEJ Pharmaceutical Grade Sodium Carbonate Market Value (US$ Mn) and Volume (MT) by Country, 2013 – 2028

Table 24: India Pharmaceutical Grade Sodium Carbonate Market Value (US$ Mn) and Volume (MT) by Grade, 2013 – 2028

Table 25: India Pharmaceutical Grade Sodium Carbonate Market Value (US$ Mn) and Volume (MT) by Application, 2013 – 2028

Table 26: Japan Pharmaceutical Grade Sodium Carbonate Market Value (US$ Mn) and Volume (MT) by Grade, 2013 – 2028

Table 27: Japan Pharmaceutical Grade Sodium Carbonate Market Value (US$ Mn) and Volume (MT) by Application, 2013 – 2028

Table 28: MEA Pharmaceutical Grade Sodium Carbonate Market Value (US$ Mn) and Volume (MT) by Grade, 2013 – 2028

Table 29: MEA Pharmaceutical Grade Sodium Carbonate Market Value (US$ Mn) and Volume (MT) by Application, 2013 – 2028

Table 30: MEA Pharmaceutical Grade Sodium Carbonate Market Value (US$ Mn) and Volume (MT) by Country, 2013 – 2028
Nikhil Kaitwade
Nikhil Kaitwade

Principal Consultant

Talk to Analyst

Find your sweet spots for generating winning opportunities in this market.

List of Charts

Figure 01: GDP Growth Rate (Y-o-Y), 2013-2021 

Figure 02: Global chemical Outlook by Pharmaceuticals Segment (Y-O-Y Projection)

Figure 03: World Pharmaceuticals Market, 2013 A, Sales Data

Figure 04: Pharmaceutical Consumption of drugs for peptic ulcer & gastro-oesophageal diseases, (2006 – 2015)

Figure 05: Antacids Consumption, (2006 – 2015)

Figure 06: Key OTC Products Sales Value in U.S., (Millions US$, 2013– 2021)

Figure 07: Global Market Demand (2022)

Figure 08: Global Market Supply (2022)

Figure 09: Global Market Demand By End Use (2022)

Figure 10: Global Market Demand By Geography (2022)

Figure 11: Share of Global Production Capacity by Region

Figure 12: Soda Ash per capita consumption (Kg/person)

Figure 13: Western Europe, Soda Ash Production (2011 – 2015, 000’ MT)

Figure 14: Eastern Europe, Soda Ash Production (2011 – 2015, 000’ MT)

Figure 15: Asia Pacific, Soda Ash Production (2011 – 2015, 000’ MT)

Figure 16: Middle East & Africa, Soda Ash Production (2011 – 2015, 000’ MT)

Figure 17: APEJ Sodium Carbonate Import (Mn MT, US$ Mn)

Figure 18: APEJ Sodium Carbonate Export (MT, 000’ US$)

Figure 19: Latin America Sodium Carbonate Import (MT, 000’ US$)

Figure 20: Latin America Sodium Carbonate Export (MT, 000’ US$)

Figure 21: Europe Sodium Carbonate Import (MT, 000’ US$)

Figure 22: Europe Sodium Carbonate Export (MT, 000’ US$)

Figure 23: North America Sodium Carbonate Import (MT, 000’ US$)

Figure 24: North America Sodium Carbonate Export (MT, 000’ US$)

Figure 25: MEA Sodium Carbonate Import (MT, 000’ US$)

Figure 26: MEA Sodium Carbonate Export (MT, 000’ US$)

Figure 27: Japan Sodium Carbonate Import (MT, 000’ US$)

Figure 28: Japan Sodium Carbonate Export (MT, 000’ US$)

Figure 29: Concentration of chemical industry

Figure 30: Composition of Indian chemical industry

Figure 31: India Sodium Carbonate Market Overview by Application, 2021

Figure 32: India Sodium Carbonate Capacity Share of Indian players, 2021

Figure 33: Production Growth of soda ash, (000’ MT)

Figure 34: Consumption of soda ash, (000’ MT)

Figure 35: Exports of Soda Ash (Kilo Tons, US$ Mn)

Figure 36: Imports of Soda Ash (Kilo Tons, US$ Mn)

Figure 37: Top 5 Export Destinations of Soda Ash (MT, US$ Mn), 2015-2021

Figure 38: Top 5 Import Destinations of Soda Ash (MT, US$ Mn), 2015-2021

Figure 39: Global Historical Market Size (US$ Mn) and Volume (MT) Analysis, 2013 – 2021

Figure 40: Global Current and Future Market Size (US$ Mn) and Volume (MT) Analysis, 2022 – 2028

Figure 41: Global Market Demand Scenario (2022)

Figure 42: Global Pharmaceutical Grade Sodium Carbonate Market Historical Value (US$ Mn), 2013 – 2021

Figure 43: Global Pharmaceutical Grade Sodium Carbonate Market Value (US$ Mn) and Y-o-Y Growth Forecast, 2022 – 2028

Figure 44: Global Pharmaceutical Grade Sodium Carbonate Market Absolute $ Opportunity, 2021 – 2028

Figure 45: Global Pharmaceutical Grade Sodium Carbonate Market Share and BPS Analysis by Grade – 2013, 2022 & 2028

Figure 46: Global Pharmaceutical Grade Sodium Carbonate Market Y-o-Y (%) Growth Projections by Type, 2013 – 2028

Figure 47: Global Pharmaceutical Grade Sodium Carbonate Market Absolute $ Opportunity (US$ Mn), 2022 – 2028 by Grade

Figure 48: Global Pharmaceutical Grade Sodium Carbonate Market Attractiveness Analysis by Grade, 2022 – 2028

Figure 49: Global Pharmaceutical Grade Sodium Carbonate Market Share and BPS Analysis by Application – 2013, 2022 & 2028

Figure 50: Global Pharmaceutical Grade Sodium Carbonate Market Y-o-Y (%) Growth Projections by Application, 2013 – 2028

Figure 51: Global Pharmaceutical Grade Sodium Carbonate Market Absolute $ Opportunity (US$ Mn), 2022 – 2028 by Application

Figure 52: Global Pharmaceutical Grade Sodium Carbonate Market Attractiveness Analysis by Application, 2022 – 2028

Figure 53: Global Pharmaceutical Grade Sodium Carbonate Market Share and BPS Analysis by Region – 2013, 2022 & 2028

Figure 54: Global Pharmaceutical Grade Sodium Carbonate Market Y-o-Y (%) Growth Projections by Region, 2013 – 2028

Figure 55: Global Pharmaceutical Grade Sodium Carbonate Market Absolute $ Opportunity (US$ Mn), 2022 – 2028 by Region

Figure 56: Global Pharmaceutical Grade Sodium Carbonate Market Attractiveness Analysis by Region, 2022 – 2028

Figure 57: North America Pharmaceutical Grade Sodium Carbonate Market Share and BPS Analysis by Grade – 2013, 2022 & 2028

Figure 58: North America Pharmaceutical Grade Sodium Carbonate Market Y-o-Y (%) Growth Projections by Grade, 2013 – 2028

Figure 59: North America Pharmaceutical Grade Sodium Carbonate Market Absolute $ Opportunity (US$ Mn), 2022 – 2028 by Grade

Figure 60: North America Pharmaceutical Grade Sodium Carbonate Market Share and BPS Analysis by Application – 2013, 2022 & 2028

Figure 61: North America Pharmaceutical Grade Sodium Carbonate Market Y-o-Y (%) Growth Projections by Application, 2013 – 2028

Figure 62: North America Pharmaceutical Grade Sodium Carbonate Market Absolute $ Opportunity (US$ Mn), 2022 – 2028 by Application

Figure 63: North America Pharmaceutical Grade Sodium Carbonate Market Share and BPS Analysis by Country – 2013, 2022 & 2028

Figure 64: North America Pharmaceutical Grade Sodium Carbonate Market Y-o-Y (%) Growth Projections by Country, 2013 – 2028

Figure 65: North America Pharmaceutical Grade Sodium Carbonate Market Absolute $ Opportunity (US$ Mn), 2022 – 2028 by Country

Figure 66: Pharmaceutical Grade Sodium Carbonate Market Attractiveness Analysis by Grade, 2022 – 2028

Figure 67: Pharmaceutical Grade Sodium Carbonate Market Attractiveness Analysis by Application, 2022 – 2028

Figure 68: Pharmaceutical Grade Sodium Carbonate Market Attractiveness Analysis by Country, 2022 – 2028

Figure 69: Latin America Pharmaceutical Grade Sodium Carbonate Market Share and BPS Analysis by Grade – 2013, 2022 & 2028

Figure 70: Latin America Pharmaceutical Grade Sodium Carbonate Market Y-o-Y (%) Growth Projections by Grade, 2013 – 2028

Figure 71: Latin America Pharmaceutical Grade Sodium Carbonate Market Absolute $ Opportunity (US$ Mn), 2022 – 2028 by Grade

Figure 72: Latin America Pharmaceutical Grade Sodium Carbonate Market Share and BPS Analysis by Application – 2013, 2022 & 2028

Figure 73: Latin America Pharmaceutical Grade Sodium Carbonate Market Y-o-Y (%) Growth Projections by Application, 2013 – 2028

Figure 74: Latin America Pharmaceutical Grade Sodium Carbonate Market Absolute $ Opportunity (US$ Mn), 2022 – 2028 by Application

Figure 75: Latin America Pharmaceutical Grade Sodium Carbonate Market Share and BPS Analysis by Country – 2013, 2022 & 2028

Figure 76: Latin America Pharmaceutical Grade Sodium Carbonate Market Y-o-Y (%) Growth Projections by Country, 2013 – 2028

Figure 77: Latin America Pharmaceutical Grade Sodium Carbonate Market Absolute $ Opportunity (US$ Mn), 2022 – 2028 by Country

Figure 78: Pharmaceutical Grade Sodium Carbonate Market Attractiveness Analysis by Grade, 2022 – 2028

Figure 79: Pharmaceutical Grade Sodium Carbonate Market Attractiveness Analysis by Application, 2022 – 2028

Figure 80: Pharmaceutical Grade Sodium Carbonate Market Attractiveness Analysis by Country, 2022 – 2028

Figure 81: Western Europe Pharmaceutical Grade Sodium Carbonate Market Share and BPS Analysis by Grade – 2013, 2022 & 2028

Figure 82: Western Europe Pharmaceutical Grade Sodium Carbonate Market Y-o-Y (%) Growth Projections by Grade, 2013 – 2028

Figure 83: Western Europe Pharmaceutical Grade Sodium Carbonate Market Absolute $ Opportunity (US$ Mn), 2022 – 2028 by Grade

Figure 84: Western Europe Pharmaceutical Grade Sodium Carbonate Market Share and BPS Analysis by Application – 2013, 2022 & 2028

Figure 85: Western Europe Pharmaceutical Grade Sodium Carbonate Market Y-o-Y (%) Growth Projections by Application, 2013 – 2028

Figure 86: Western Europe Pharmaceutical Grade Sodium Carbonate Market Absolute $ Opportunity (US$ Mn), 2022 – 2028 by Application

Figure 87: Western Europe Pharmaceutical Grade Sodium Carbonate Market Share and BPS Analysis by Country – 2013, 2022 & 2028

Figure 88: Western Europe Pharmaceutical Grade Sodium Carbonate Market Y-o-Y (%) Growth Projections by Country, 2013 – 2028

Figure 89: Western Europe Pharmaceutical Grade Sodium Carbonate Market Absolute $ Opportunity (US$ Mn), 2022 – 2028 by Country

Figure 90: Pharmaceutical Grade Sodium Carbonate Market Attractiveness Analysis by Grade, 2022 – 2028

Figure 91: Pharmaceutical Grade Sodium Carbonate Market Attractiveness Analysis by Application, 2022 – 2028

Figure 92: Pharmaceutical Grade Sodium Carbonate Market Attractiveness Analysis by Country, 2022 – 2028

Figure 93: Eastern Europe Pharmaceutical Grade Sodium Carbonate Market Share and BPS Analysis by Grade – 2013, 2022 & 2028

Figure 94: Eastern Europe Pharmaceutical Grade Sodium Carbonate Market Y-o-Y (%) Growth Projections by Grade, 2013 – 2028

Figure 95: Eastern Europe Pharmaceutical Grade Sodium Carbonate Market Absolute $ Opportunity (US$ Mn), 2022 – 2028 by Grade

Figure 96: Eastern Europe Pharmaceutical Grade Sodium Carbonate Market Share and BPS Analysis by Application – 2013, 2022 & 2028

Figure 97: Eastern Europe Pharmaceutical Grade Sodium Carbonate Market Y-o-Y (%) Growth Projections by Application, 2013 – 2028

Figure 98: Eastern Europe Pharmaceutical Grade Sodium Carbonate Market Absolute $ Opportunity (US$ Mn), 2022 – 2028 by Application

Figure 99: Eastern Europe Pharmaceutical Grade Sodium Carbonate Market Share and BPS Analysis by Country – 2013, 2022 & 2028

Figure 100: Eastern Europe Pharmaceutical Grade Sodium Carbonate Market Y-o-Y (%) Growth Projections by Country, 2013 – 2028

Figure 101: Eastern Europe Pharmaceutical Grade Sodium Carbonate Market Absolute $ Opportunity (US$ Mn), 2022 – 2028 by Country

Figure 102: Pharmaceutical Grade Sodium Carbonate Market Attractiveness Analysis by Grade, 2022 – 2028

Figure 103: Pharmaceutical Grade Sodium Carbonate Market Attractiveness Analysis by Application, 2022 – 2028

Figure 104: Pharmaceutical Grade Sodium Carbonate Market Attractiveness Analysis by Country, 2022 – 2028

Figure 105: APEJ Pharmaceutical Grade Sodium Carbonate Market Share and BPS Analysis by Grade – 2013, 2022 & 2028

Figure 106: APEJ Pharmaceutical Grade Sodium Carbonate Market Y-o-Y (%) Growth Projections by Grade, 2013 – 2028

Figure 107: APEJ Pharmaceutical Grade Sodium Carbonate Market Absolute $ Opportunity (US$ Mn), 2022 – 2028 by Grade

Figure 108: APEJ Pharmaceutical Grade Sodium Carbonate Market Share and BPS Analysis by Application – 2013, 2022 & 2028

Figure 109: APEJ Pharmaceutical Grade Sodium Carbonate Market Y-o-Y (%) Growth Projections by Application, 2013 – 2028

Figure 110: APEJ Pharmaceutical Grade Sodium Carbonate Market Absolute $ Opportunity (US$ Mn), 2022 – 2028 by Application

Figure 111: APEJ Pharmaceutical Grade Sodium Carbonate Market Share and BPS Analysis by Country – 2013, 2022 & 2028

Figure 112: APEJ Pharmaceutical Grade Sodium Carbonate Market Y-o-Y (%) Growth Projections by Country, 2013 – 2028

Figure 113: APEJ Pharmaceutical Grade Sodium Carbonate Market Absolute $ Opportunity (US$ Mn), 2022 – 2028 by Country

Figure 114: Pharmaceutical Grade Sodium Carbonate Market Attractiveness Analysis by Grade, 2022 – 2028

Figure 115: Pharmaceutical Grade Sodium Carbonate Market Attractiveness Analysis by Application, 2022 – 2028

Figure 116: Pharmaceutical Grade Sodium Carbonate Market Attractiveness Analysis by Country, 2022 – 2028

Figure 117: India Pharmaceutical Grade Sodium Carbonate Market Share and BPS Analysis by Grade – 2013, 2022 & 2028

Figure 118: India Pharmaceutical Grade Sodium Carbonate Market Y-o-Y (%) Growth Projections by Grade, 2013 – 2028

Figure 119: India Pharmaceutical Grade Sodium Carbonate Market Absolute $ Opportunity (US$ Mn), 2022 – 2028 by Grade

Figure 120: India Pharmaceutical Grade Sodium Carbonate Market Share and BPS Analysis by Application – 2013, 2022 & 2028

Figure 121: India Pharmaceutical Grade Sodium Carbonate Market Y-o-Y (%) Growth Projections by Application, 2013 – 2028

Figure 122: India Pharmaceutical Grade Sodium Carbonate Market Absolute $ Opportunity (US$ Mn), 2022 – 2028 by Application

Figure 123: Pharmaceutical Grade Sodium Carbonate Market Attractiveness Analysis by Grade, 2022 – 2028

Figure 124: Pharmaceutical Grade Sodium Carbonate Market Attractiveness Analysis by Application, 2022 – 2028

Figure 125: Japan Pharmaceutical Grade Sodium Carbonate Market Share and BPS Analysis by Grade – 2013, 2022 & 2028

Figure 126: Japan Pharmaceutical Grade Sodium Carbonate Market Y-o-Y (%) Growth Projections by Grade, 2013 – 2028

Figure 127: Japan Pharmaceutical Grade Sodium Carbonate Market Absolute $ Opportunity (US$ Mn), 2022 – 2028 by Grade

Figure 128: Japan Pharmaceutical Grade Sodium Carbonate Market Share and BPS Analysis by Application – 2013, 2022 & 2028

Figure 129: Japan Pharmaceutical Grade Sodium Carbonate Market Y-o-Y (%) Growth Projections by Application, 2013 – 2028

Figure 130: Japan Pharmaceutical Grade Sodium Carbonate Market Absolute $ Opportunity (US$ Mn), 2022 – 2028 by Application

Figure 131: Pharmaceutical Grade Sodium Carbonate Market Attractiveness Analysis by Grade, 2022 – 2028

Figure 132: Pharmaceutical Grade Sodium Carbonate Market Attractiveness Analysis by Application, 2022 – 2028

Figure 133: MEA Pharmaceutical Grade Sodium Carbonate Market Share and BPS Analysis by Grade – 2013, 2022 & 2028

Figure 134: MEA Pharmaceutical Grade Sodium Carbonate Market Y-o-Y (%) Growth Projections by Grade, 2013 – 2028

Figure 135: MEA Pharmaceutical Grade Sodium Carbonate Market Absolute $ Opportunity (US$ Mn), 2022 – 2028 by Grade

Figure 136: MEA Pharmaceutical Grade Sodium Carbonate Market Share and BPS Analysis by Application – 2013, 2022 & 2028

Figure 137: MEA Pharmaceutical Grade Sodium Carbonate Market Y-o-Y (%) Growth Projections by Application, 2013 – 2028

Figure 138: MEA Pharmaceutical Grade Sodium Carbonate Market Absolute $ Opportunity (US$ Mn), 2022 – 2028 by Application

Figure 139: MEA Pharmaceutical Grade Sodium Carbonate Market Share and BPS Analysis by Country – 2013, 2022 & 2028

Figure 140: MEA Pharmaceutical Grade Sodium Carbonate Market Y-o-Y (%) Growth Projections by Country, 2013 – 2028

Figure 141: MEA Pharmaceutical Grade Sodium Carbonate Market Absolute $ Opportunity (US$ Mn), 2022 – 2028 by Country

Figure 142: Pharmaceutical Grade Sodium Carbonate Market Attractiveness Analysis by Grade, 2022 – 2028

Figure 143: Pharmaceutical Grade Sodium Carbonate Market Attractiveness Analysis by Application, 2022 – 2028

Figure 144: Pharmaceutical Grade Sodium Carbonate Market Attractiveness Analysis by Country, 2022 – 2028

Recommendations

Chemicals & Materials

Sodium Bicarbonate Market

Published : June 2023

Chemicals & Materials

Pharmaceuticals Grade Sodium Bicarbonate Market

Published : February 2023

Chemicals & Materials

Pharmaceutical Grade Sodium Chloride Market

Published : July 2022

Chemicals & Materials

Pharmaceutical Grade Sodium Carbonate Market

Published : July 2022

Explore Chemicals & Materials Insights

View Reports

Pharmaceutical Grade Sodium Carbonate Market