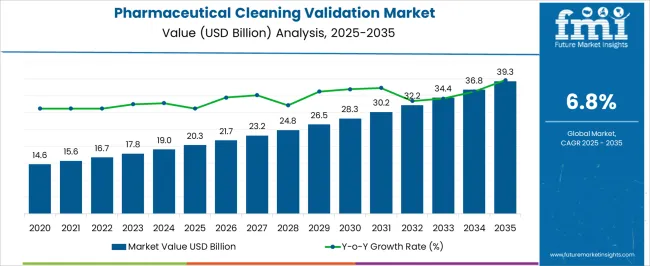
The Pharmaceutical Cleaning Validation Market is estimated to be valued at USD 20.3 billion in 2025 and is projected to reach USD 39.3 billion by 2035, registering a compound annual growth rate (CAGR) of 6.8% over the forecast period.
| Metric | Value |
|---|---|
| Pharmaceutical Cleaning Validation Market Estimated Value in (2025 E) | USD 20.3 billion |
| Pharmaceutical Cleaning Validation Market Forecast Value in (2035 F) | USD 39.3 billion |
| Forecast CAGR (2025 to 2035) | 6.8% |
The pharmaceutical cleaning validation market is experiencing consistent growth driven by stringent regulatory standards, increased production of highly potent active pharmaceutical ingredients, and the rising demand for product safety and cross contamination prevention. As pharmaceutical manufacturing scales up globally, cleaning validation has become an essential component of quality assurance programs.
Advances in analytical instrumentation and the adoption of risk based approaches are helping manufacturers meet evolving compliance requirements efficiently. The market is further supported by the emphasis on good manufacturing practices and the need to maintain equipment integrity during product changeovers.
As industry focus sharpens on contamination control and audit readiness, the demand for validated cleaning protocols is expected to expand across manufacturing environments involved in both traditional and advanced therapeutics.
The market is segmented by Validation Test and Product Type and region. By Validation Test, the market is divided into Non-specific Tests and Product-specific Analytical Tests. In terms of Product Type, the market is classified into Small Molecule Drug, Peptides, Proteins, and Cleaning Detergent. Regionally, the market is classified into North America, Latin America, Western Europe, Eastern Europe, Balkan & Baltic Countries, Russia & Belarus, Central Asia, East Asia, South Asia & Pacific, and the Middle East & Africa.
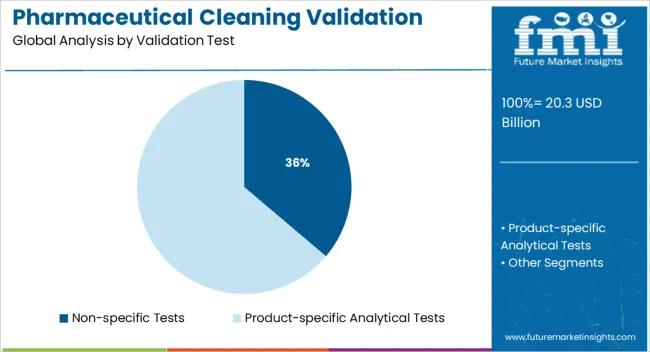
The non specific tests segment is projected to account for 36.20% of the total market revenue by 2025 within the validation test category, making it a key contributor. Its growth is being fueled by its broad applicability across multiple drug types and manufacturing environments.
These tests offer a cost effective and streamlined method for residue detection without requiring specific compound identification, making them ideal for routine validation procedures. The simplicity and efficiency of implementation, combined with acceptable accuracy for many cleaning validation requirements, have reinforced the segment’s adoption in both generic and branded drug production settings.
As the industry seeks time saving and reliable testing methods, non specific tests continue to serve as a practical choice for meeting regulatory expectations.
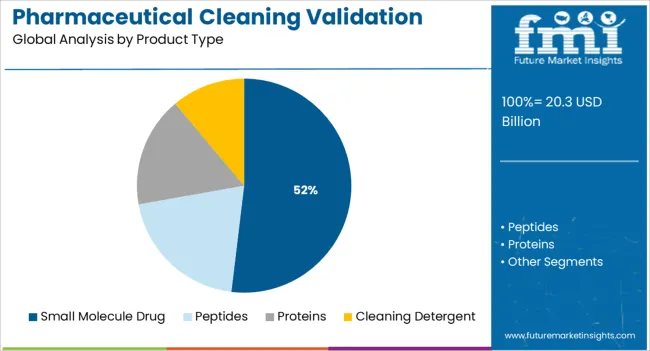
The small molecule drug segment is expected to represent 51.90% of the overall market revenue by 2025 under the product type category, establishing itself as the leading segment. This dominance is attributed to the high volume of small molecule pharmaceuticals manufactured globally and their extensive use in chronic disease treatments.
The requirement for frequent equipment cleaning and product changeovers in small molecule production environments creates ongoing demand for robust cleaning validation strategies. Furthermore, the relatively simpler chemical structure of small molecules allows for effective detection through established analytical methods.
With regulatory bodies maintaining a strong focus on preventing cross contamination and ensuring product purity, small molecule manufacturing facilities continue to prioritize comprehensive cleaning validation protocols, thereby securing the segment’s leading position.
The global market for Cleaning Validations in the Pharmaceutical industry expanded at a CAGR of 6% from 2020 to 2024. The market growth is projected to augment because of updates and revisions to existing cleaning validation guidelines in the pharmaceutical sector along with the release of new guidelines.
It is anticipated that organizations like the European Medicines Agency (EMA) will be instrumental in the increase in avenues for the key industry players shaping the Pharmaceutical Cleaning Validation Market in the forthcoming years.
The global Pharmaceutical Cleaning Validation market is predicted to surge ahead at a CAGR of 6.8% and record sales worth USD 39.3 Billion by the end of 2035. The USA will continue to be the largest market throughout the analysis period accounting for over USD 5.1 Billion absolute dollar opportunity in the coming 10-year epoch.
European Medicines Agency (EMA) is the pacesetter with regard to the development of risk-based cleaning validation guidelines for the prevention of cross-contamination in numerous shared facilities for manufacturing across the globe.
In May 2024, the Pharmaceutical Inspection Co-Operation Scheme (PIC/S), initiated documents containing guidelines and QnAs pertaining to the Implementation of Risk-based Prevention of Cross-Contamination in Production and the setting of Health-Based Exposure Limits (HBEL) in order to identify risks in the manufacturing of various pharmaceutical products in numerous shared facilities.
These regulations are based on the 2020 EMA guidelines. In 2024, the FDA’s Center for Drug Evaluation and Research (CDER) approved 50 new novel therapeutics. As of November 2024, EMA’s Committee for Medicinal Products for Human Use (CHMP) issued recommendations for the approval of as many as 57 new medicines, vaccines, and therapeutic biologics, of which around 36 had been granted marketing authorization.
Owing to these newly approved drugs and therapeutics, the Pharmaceutical Cleaning Validation Market is set to witness growth during the forthcoming years, in order to keep up with the strict guidelines of regulatory agencies such as EMA and the USA FDA for cleaning validation processes.
The driving factors behind the growth of the Pharmaceutical Cleaning Validation Market in the Asia-Pacific region during the forthcoming years are recognized to be the augmented funding by the intercontinental Pharmaceutical corporations in big production enterprises.
In September 2020, the primordial ISPE Asia-Pacific Pharmaceutical Manufacturing Conference was arranged by the International Society of Pharmaceutical Engineering, and the following year, in September 2024, the second edition. Included among the considerable points of discussion were the control of cross-contamination and cleaning validation. As of 2024, the net sales of Shimadzu Corporation in Japan witnessed an increase of around 3% in comparison to the previous year.
Shimadzu Corporation’s sales in China rose by an extensive 20% in 2024 relative to that of 2020. This increase is mainly attributed to the increased requirement for Liquid chromatographs and mass spectrometers owing to Pharmacopoeia revisions.
The Pharmaceutical Cleaning Validation Market in China is projected to witness a growth of 8.6% CAGR during the coming 10-year epoch to reach a total market valuation of USD 39.3 Billion by the end of 2035. This is among the various attributes responsible for the growth of the Pharmaceutical Cleaning Validation Market in Asia-Pacific during the forthcoming years.
With a market share of approximately more than 40%, the Pharmaceutical Cleaning Validation Market in the North American region is expected to maintain its dominant position in the market during the forthcoming years. The binding guidelines of authorization organizations like the USA FDA and Health Canada have generated and augmented the requirement for cleaning validation processes in the Pharmaceutical Industry for the prevention of cross-contamination and expanding their control processes related to product quality.
The Cleaning Validation Guide (GUI-0028) published by Health Canada in June 2024, with its revised guidelines, lays heavy emphasis on a Cleaning Validation Master Plan or any equivalent document, outlining the general cleaning policies at the manufacturing site for any and all players in the Pharmaceutical Industry.
The FDA ensures complete compliance with the CGMP regulations by thoroughly examining the manufacturing procedures in the Pharmaceutical Industry. This is attributed to its Code of Federal Regulations (CFR). The 21 CFR Part 211 contains the Current Good Manufacturing Practice (CGMP) rules for Finished Pharmaceuticals. This is projected to be advantageous for the Pharmaceutical Cleaning Validation Market in the North-American region.
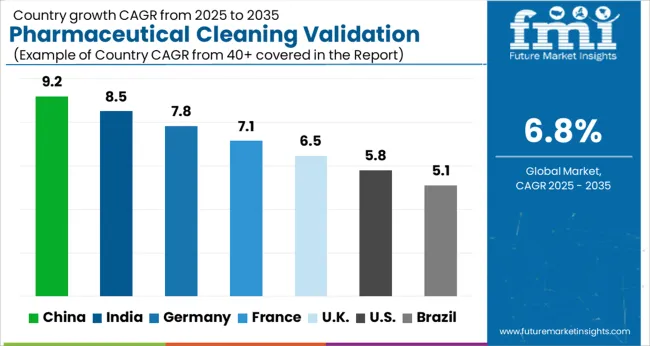
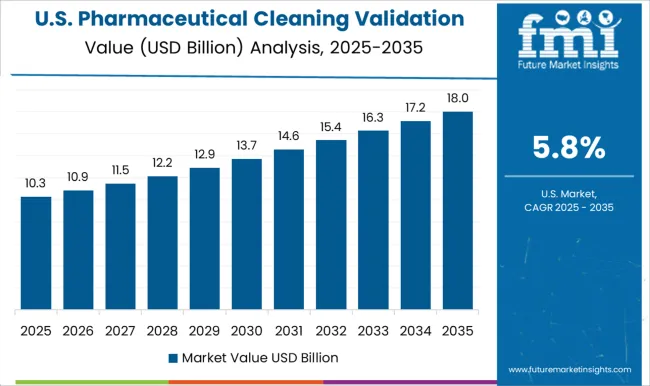
The USA is projected to keep its market share of over 30% in the Global Pharmaceutical Cleaning Validation Market intact with a CAGR of 6.5% during the forthcoming years. It is anticipated that the Pharmaceutical Cleaning Validation Market in the country will reach total market revenue of USD 10.9 Billion by experiencing an absolute dollar opportunity of USD 5.1 Billion during the forecast period.
Purdue University, collaborated with the USA pharmacopeia, beginning in August 2024, following impetus from Aprecia Pharmaceuticals, to advance the pharmaceutical validation market technology forum.
Taking into account February 2024, Article of Aptitude Health, the USA FDA’s Center for Drug Evaluation and Research (CDER) approved as many as 53 novel drugs, both as new molecular entities (NMEs) and new therapeutic biologics in 2024.
This is forecasted to have a positive impact on the role of the USA in the Global Cleaning Validation Demand in the Pharmaceutical Industry owing to the guidelines of the FDA, which emphasize strict adherence to the Cleaning Validation Procedures.
The market in the United Kingdom is projected to reach a valuation of USD 39.3 Billion by 2035. With a CAGR of 8% from 2025 to 2035, the market in the country is expected to gross an absolute dollar opportunity of USD 824 Million.
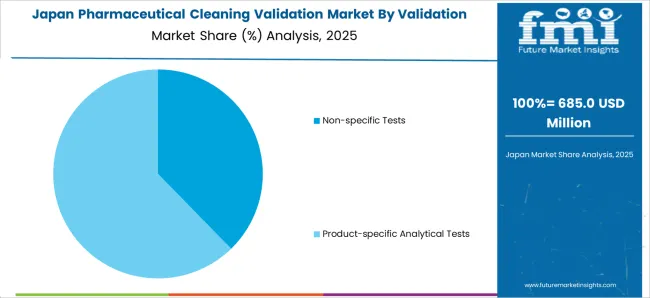
In Japan, the market is expected to reach USD 1.2 Billion by 2035, growing at a CAGR of 6.7% during the forecast period. From 2025 to 2035, the market is likely to register an absolute dollar opportunity of USD 577 Million.
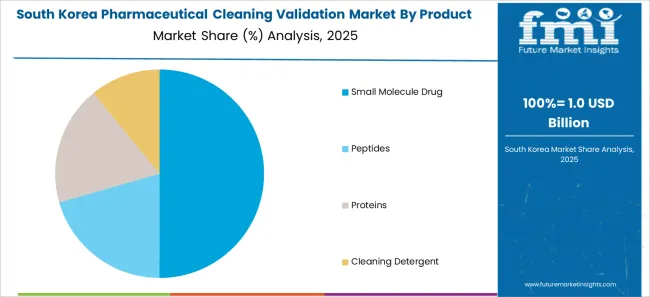
The market in South Korea is expected to reach a valuation of USD 614 Million by 2035. With a CAGR of 6.3% during the forecast period, the market is likely to gross an absolute dollar opportunity of USD 281 Million.
The Product-specific Analytical Tests segment is anticipated to expand with a CAGR of 6.4% by the end of 2035. The Product-Specific Analytical Test segment is forecasted to benefit from the increase in the requirement for High-Performance Liquid Chromatography (HPLC) testing, due to its growing importance in the procedures related to drug approvals.
The customary use of High-Performance Liquid Chromatography (HPLC) testing during the manufacturing procedures of the Pharmaceutical Industry finds additional corroboration in the fact that it provides required precise results, further helping the key market players to be on par with the various guidelines of the regulatory agencies during the upcoming 10-year forecast epoch.
The Small Molecule Drug segment is forecasted to grow with an 8.1% CAGR during the 10-year epoch. Factors like the FDA’s Center for Drug Evaluation and Research (CDER) granting authorization to as many as 53 recent drugs, 38 of which were small molecule drugs in 2024 are projected to be advantageous to the Small Molecule Drug segment by Product-type of the Pharmaceutical Cleaning Validation Market during the forthcoming years.
Even in 2024, with 34 approvals the small molecule drugs made up half of as many as 50 novel drug approvals. Due to the stringent guidelines and regulations of the authorities like the EMA (European Medicines Agency) and the USA FDA (USA Food and Drug Administration), the requirement for better cleaning validation in these increasing levels of production of Small Molecule Drugs is set to rise, leading to better avenues for the key players of the Pharmaceutical Cleaning Validation Industry during the upcoming 10-year forecast epoch.
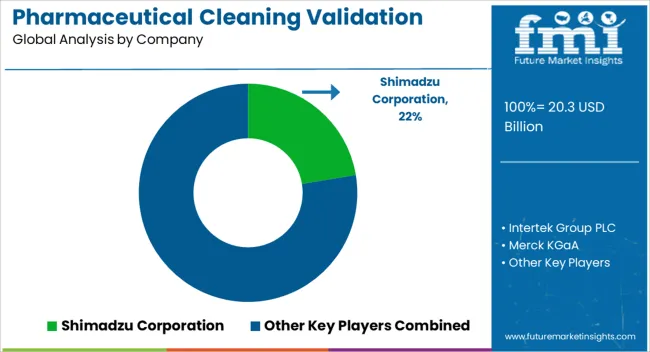
Shimadzu Corporation, Intertek Group PLC, Merck KGaA, SUEZ, Hach, Avomeen LLC, QPharma Inc., SGS SA, ProPharma Group, Kymos S.L., Waters Corporation, and Lucideon Limited are among the key players in the global pharmaceutical cleaning validation market.
Some of the recent developments in the market are:
The global pharmaceutical cleaning validation market is estimated to be valued at USD 20.3 billion in 2025.
The market size for the pharmaceutical cleaning validation market is projected to reach USD 39.3 billion by 2035.
The pharmaceutical cleaning validation market is expected to grow at a 6.8% CAGR between 2025 and 2035.
The key product types in pharmaceutical cleaning validation market are non-specific tests, _total carbon analysis (tc), _total organic carbon testing (toc), _non-purgeable organic carbon (npoc), _conductivity, _other non-specific tests, product-specific analytical tests, _ultraviolet-visible spectroscopy (us/vis), _high-performance liquid chromatography (hplc), _liquid chromatography/mass spectrometry (lc/ms) and _other product-specific analytical tests.
In terms of product type, small molecule drug segment to command 51.9% share in the pharmaceutical cleaning validation market in 2025.


Our Research Products

The "Full Research Suite" delivers actionable market intel, deep dives on markets or technologies, so clients act faster, cut risk, and unlock growth.

The Leaderboard benchmarks and ranks top vendors, classifying them as Established Leaders, Leading Challengers, or Disruptors & Challengers.

Locates where complements amplify value and substitutes erode it, forecasting net impact by horizon

We deliver granular, decision-grade intel: market sizing, 5-year forecasts, pricing, adoption, usage, revenue, and operational KPIs—plus competitor tracking, regulation, and value chains—across 60 countries broadly.

Spot the shifts before they hit your P&L. We track inflection points, adoption curves, pricing moves, and ecosystem plays to show where demand is heading, why it is changing, and what to do next across high-growth markets and disruptive tech

Real-time reads of user behavior. We track shifting priorities, perceptions of today’s and next-gen services, and provider experience, then pace how fast tech moves from trial to adoption, blending buyer, consumer, and channel inputs with social signals (#WhySwitch, #UX).

Partner with our analyst team to build a custom report designed around your business priorities. From analysing market trends to assessing competitors or crafting bespoke datasets, we tailor insights to your needs.
Supplier Intelligence
Discovery & Profiling
Capacity & Footprint
Performance & Risk
Compliance & Governance
Commercial Readiness
Who Supplies Whom
Scorecards & Shortlists
Playbooks & Docs
Category Intelligence
Definition & Scope
Demand & Use Cases
Cost Drivers
Market Structure
Supply Chain Map
Trade & Policy
Operating Norms
Deliverables
Buyer Intelligence
Account Basics
Spend & Scope
Procurement Model
Vendor Requirements
Terms & Policies
Entry Strategy
Pain Points & Triggers
Outputs
Pricing Analysis
Benchmarks
Trends
Should-Cost
Indexation
Landed Cost
Commercial Terms
Deliverables
Brand Analysis
Positioning & Value Prop
Share & Presence
Customer Evidence
Go-to-Market
Digital & Reputation
Compliance & Trust
KPIs & Gaps
Outputs
Full Research Suite comprises of:
Market outlook & trends analysis
Interviews & case studies
Strategic recommendations
Vendor profiles & capabilities analysis
5-year forecasts
8 regions and 60+ country-level data splits
Market segment data splits
12 months of continuous data updates
DELIVERED AS:
PDF EXCEL ONLINE
Pharmaceutical Excipient SNAC Market Size and Share Forecast Outlook 2025 to 2035
Pharmaceutical Zinc Powder Market Size and Share Forecast Outlook 2025 to 2035
Pharmaceutical Grade Magnesium Sulfate Market Size and Share Forecast Outlook 2025 to 2035
Pharmaceutical Secondary Packaging Market Size and Share Forecast Outlook 2025 to 2035
Pharmaceutical Glass Packaging Market Size and Share Forecast Outlook 2025 to 2035
Pharmaceutical Manufacturing Equipment Market Forecast and Outlook 2025 to 2035
Pharmaceutical Plastic Bottle Market Forecast and Outlook 2025 to 2035
Pharmaceutical Grade Sodium Carbonate Market Forecast and Outlook 2025 to 2035
Pharmaceutical Industry Analysis in Saudi Arabia Forecast and Outlook 2025 to 2035
Pharmaceutical Packaging Market Size and Share Forecast Outlook 2025 to 2035
Pharmaceutical Grade Sodium Chloride Market Size and Share Forecast Outlook 2025 to 2035
Pharmaceutical Plastic Packaging Market Size and Share Forecast Outlook 2025 to 2035
Pharmaceutical Plastic Pots Market Size and Share Forecast Outlook 2025 to 2035
Pharmaceuticals Pouch Market Size and Share Forecast Outlook 2025 to 2035
Pharmaceutical Unit Dose Packaging Market Size and Share Forecast Outlook 2025 to 2035
Pharmaceutical Mini Batch Blender Market Size and Share Forecast Outlook 2025 to 2035
Pharmaceutical Continuous Manufacturing Equipment Market Size and Share Forecast Outlook 2025 to 2035
Pharmaceutical Liquid Prefilters Market Size and Share Forecast Outlook 2025 to 2035
Pharmaceutical Grade P-Toluenesulfonic Acid Market Size and Share Forecast Outlook 2025 to 2035
Pharmaceutical Glass Container Industry Analysis in Europe Size and Share Forecast Outlook 2025 to 2035

Thank you!
You will receive an email from our Business Development Manager. Please be sure to check your SPAM/JUNK folder too.
Chat With
MaRIA