Pharmaceutical Packaging Equipment Market
Market Insights on Pharmaceutical Packaging Equipment covering sales outlook, demand forecast & up-to-date key trends
Pharmaceutical Packaging Equipment Market By Automation, Machine Type, Application & Region - Forecast 2022 – 2032
Pharmaceutical Packaging Equipment Market Outlook (2022-2032)
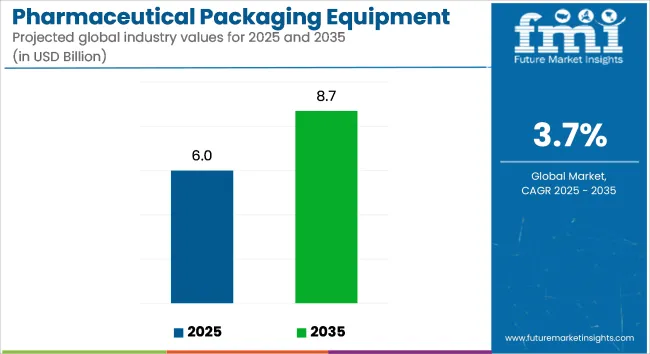
[225 Pages Report] The global pharmaceutical packaging equipment market is reach a valuation of US$ 5.1 Bn in 2022. With demand growing at a robust 8.9% CAGR over the assessment period, the market size is projected to reach US$ 12 Bn by 2032. The pharmaceutical packaging equipment market was valued at US$ 4.7 Bn at the end of 2021, registered a year-over-year growth of 10.1%.
Pharmaceutical Packaging Equipment Market Estimated Size (2022E) |
US$ 5.1 Bn |
Projected Market Valuation (2032F) |
US$ 12.0 Bn |
Value-based CAGR (2022-2032) |
8.9% |
Top 3 Countries Market Share |
30-35% |
Revenues in the blister packing segment of the pharmaceutical packaging equipment market grew a robust 9.1% year-over-year in 2021. Demand for bottling line will increase 2.8 times over cartooning machines during the forecast period.
Let us know your requirement to get
100% FREE customization
2015-2021 Pharmaceutical Packaging Market Historic Outlook Vs 2022-2032 Forecast
Packaging is an important aspect in the pharmaceutical industry. Pharmaceutical packaging equipment provide pharmaceutical items with high-quality packaging and safety. During the historic period of 2015-2021, sales of pharmaceutical packaging equipment increased at a CAGR of 5.7%.
Increasing production of generic and biopharma products, OTC drug deals, growing preference for adjustable and integrated packaging equipment, expanded offshore pharmaceutical manufacturing, and stringent anti-counterfeiting norms are driving the market.
Over the forecast period, growing demand for flexible pharma packaging will augment the growth in the market. Rising need for flexible and integrated packaging equipment is a key factor boosting the global pharmaceutical packaging equipment market.
How is Rising Demand for Flexible Packaging in the Pharmaceutical Sector Augmenting Growth?
Rapid evolution of pharmaceutical packaging is compelling manufacturers to invest in technological advancements to improve sales. The advent of COVID-19, as well as intense efforts to supply vaccines effectively across various countries has led to the development of robust pharmaceutical packaging equipment.
The pharmaceutical packaging sector follows strict criteria and offers modern, specialized technology. Manufacturers are launching sophisticated solutions such as blister lines to increase the production and output. These automated, integrated processes are designed to quickly package blisters into attractive cartons and bundle them.
On the other hand, some players have introduced comprehensive solutions that include manufacturing, quality inspection, and packaging machinery. From blister/carton packaging gear and tablet presses to serialization devices for trace and track applications, these platforms include a wide spectrum of equipment.
These automated systems reduce human-machine interactions while maintaining contamination-free, high-precision machinery. Footprint, batching, digitization, and efficiency are some of the other important advancements in the pharmaceutical packaging equipment market.
Find your sweet spots for generating winning opportunities in this market.
Talk to AnalystCountry-wise Insights
How is the U.S. Pharmaceutical Packaging Equipment Market Faring?
“Increasing Sales of Pharma Packaging Machines in the U.S. Will fuel Growth”
As per the report, the U.S. is expected to account for 1/4th of the total market share over the forecast period. Rising per capita spending and investment on pharmaceutical products, as well as the existence of large pharmaceutical companies are driving sales in the market.
What is Driving the India Pharmaceutical Packaging Equipment Market?
“Rising Demand for Cartoning Machines in the Pharmaceutical Sector in India Will Boost Sales”
Sales in the India pharmaceutical packaging equipment market are slated to grow by 2.5x over the assessment period. Pharmaceutical companies in India are increasing their manufacturing facilities due to the low cost of production and packaging.
Furthermore, growing private and public sector investment in pharmaceutical research and development in India has boosted medication output significantly. These factors are expected to augment the growth in the India market over the forecast period.
Category-wise Insights
Why is Demand for Automatic Pharmaceutical Packaging Equipment Increasing?
“Adoption of Automatic Pharmaceutical Packaging Equipment To Gain Traction”
As per FMI, sales of automatic pharmaceutical equipment are expected to increase at a 7.6% CAGR during the assessment period. Hygiene maintenance and cleanliness in manufacturing facilities is a key concern among pharmaceutical vendors. These concerns have significantly increased due to the spread of novel coronavirus. Therefore, drug manufacturers are focusing on the installation of automatic machines that requires minimum human intervention.
The adoption of automatic machines is expected to increase owing to rising processing speed and filling and sealing of drugs without contamination. Increasing demand for child-resistant, interactive, and active packaging in pharmaceutical sector will continue pushing sales in this segment.
Which is the Most Preferred Machine Type?
“Sales of Blister Packaging Equipment for Tablets Will Increase”
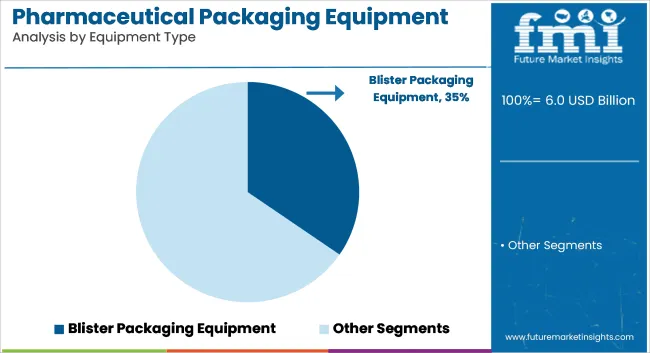
In terms of machine type, the blister packaging segment dominated the market in 2021 and the trend is expected to continue over the forecast period. Sales in this segment are slated to increase at a 7.1% CAGR over the assessment period.

An unified Market Research Subscription Platform, built for today’s disparate research needs.
Competitive Landscape
Some of the market's major companies are IMA, Bosch, Uhlmann, Körber AG, Multivac, Marchesini Group, Optima, Bausch & Strobel, Gerhard Schubert, CKD Corporation. Leading players are investing in production facility expansions to gain a competitive edge in the market. For instance:
- Serpa Packaging Solutions, a provider of cartooning and end-of-line packaging systems for the pharmaceutical, medical device, nutraceutical, food, cosmetics, and personal care industries, was purchased by ProMach. Serpa's addition to ProMach's portfolio expands the company's specialized secondary packaging machinery and line integration capabilities.
- Sharp, a contract packaging and clinical supply services provider, announced a US$ 10 million investment in equipment capabilities to directly support client demand in the biologics and injectables market.
Scope of the Report
Attribute |
Details |
Estimated Market Size (2022) |
US$ 5.1 Bn |
Projected Market Valuation (2032) |
US$ 12 Bn |
Value-based CAGR (2022-2032) |
8.9% |
Forecast Period |
2022-2032 |
Historical Data Available for |
2015-2021 |
Market Analysis |
US$ Mn for Value and Units for Volume |
Key Regions Covered |
North America, Latin America, Europe, East Asia, South Asia, and the Middle East & Africa |
Key Countries Covered |
The U.S., Brazil, Mexico, Germany, the U.K., China, India, Japan, Australia, Canada, Germany, Spain, France, BENELUX, Nordic, and GCC Countries |
Key Segments Covered |
Automation, Machine Type, Application, Region |
Key Companies Profiled |
|
Report Coverage |
Market Forecast, Company Share Analysis, Competition Intelligence, DROT Analysis, Market Dynamics and Challenges, and Strategic Growth Initiatives |
Global Pharmaceutical Packaging Equipment Market by Category
By Automation:
- Automatic
- Semi-automatic
- Manual
By Machine Type:
- Bottling Line
- Cartoning
- Form-fill-seal (FFS)
- Blister Packaging
- Capping & Closing
- Filling & Sealing
- Labelling, Decorating & Coding
- Palletizing
- Wrapping & Bundling
By Application:
- Tablets
- Powders
- Cream
- Syrup
- Aerosol
By Region:
- North America
- Latin America
- Europe
- The Middle East and Africa
- East Asia
- South Asia
- Oceania
Frequently Asked Questions
The Global pharmaceutical packaging equipment market was valued at US $ 4.7 Bn in 2021, and it is expected to grow at a CAGR of 8.9% from 2022 to 2032.
Blister packaging machine is estimated to gain traction during the assessment period.
India is expected to reflect an incremental growth by 2.5x during the forecast period.
Gerresheimer, Robert Bosch GmbH, I.M.A. Industria Macchine Automatiche SpA, Marchesini Group S.p.A, Bausch+Ströbel Maschinefabrik Ilshofen GmbH+Co. KG are some of the leading players in the global market.
Table of Content
1. Executive Summary
1.1. Global Market Outlook
1.2. Demand-side Trends
1.3. Supply-side Trends
1.4. Technology Roadmap Analysis
1.5. Analysis and Recommendations
2. Market Overview
2.1. Market Coverage / Taxonomy
2.2. Market Definition / Scope / Limitations
3. Market Background
3.1. Market Dynamics
3.1.1. Drivers
3.1.2. Restraints
3.1.3. Opportunity
3.1.4. Trends
3.2. Impact of Covid-19
3.2.1. Demand in Optimistic Scenario
3.2.2. Demand in Likely Scenario
3.2.3. Demand in Conservative Scenario
3.3. Macro Factors and Forecast Factors
3.4. Value Chain Analysis
3.4.1. Profit Margin Analysis
3.4.2. Raw Automation Suppliers
3.4.3. Manufacturers, Wholesalers and Distributors
3.4.4. End Users/ Customers
3.5. Regional Parent Market Outlook
3.6. Production and Consumption Statistics
3.7. Global Average Pricing Analysis Benchmark
4. Global Pharmaceutical Packaging Equipment Market Analysis 2015-2021 and Forecast, 2022-2032
4.1. Historical Market Size Value (US$ Bn) & Volume (Units) Analysis, 2015-2021
4.2. Current and Future Market Size Value (US$ Bn) & Volume (Units) Projections, 2022-2032
4.2.1. Y-o-Y Growth Trend Analysis
4.2.2. Absolute $ Opportunity Analysis
5. Global Pharmaceutical Packaging Equipment Market Analysis 2015–2021 and Forecast 2022–2032, By Automation
5.1. Introduction / Key Findings
5.2. Historical Market Size Value (US$ Bn) & Volume (Units) Analysis By Automation, 2015-2021
5.3. Current and Future Market Size Value (US$ Bn) & Volume (Units) Analysis and Forecast By Automation, 2022-2032
5.3.1. Automatic
5.3.2. Semi-automatic
5.3.3. Manual
5.4. Y-o-Y Growth Trend Analysis By Automation, 2015-2021
5.5. Absolute $ Opportunity Analysis By Automation, 2022-2032
6. Global Pharmaceutical Packaging Equipment Market Analysis 2015–2021 and Forecast 2022–2032, By Machine Type
6.1. Introduction / Key Findings
6.2. Historical Market Size Value (US$ Bn) & Volume (Units) Analysis By Machine Type, 2015-2021
6.3. Current and Future Market Size Value (US$ Bn) & Volume (Units) Analysis and Forecast By Machine Type, 2022-2032
6.3.1. Bottling Line
6.3.2. Cartoning
6.3.3. Form-fill-seal (FFS)
6.3.4. Blister Packaging
6.3.5. Capping & Closing
6.3.6. Filling & Sealing
6.3.7. Labelling, Decorating & Coding
6.3.8. Palletizing
6.3.9. Wrapping & Bundling
6.4. Y-o-Y Growth Trend Analysis By Machine Type, 2015-2021
6.5. Absolute $ Opportunity Analysis By Machine Type, 2022-2032
7. Global Pharmaceutical Packaging Equipment Market Analysis 2015–2021 and Forecast 2022–2032, By Application
7.1. Introduction / Key Findings
7.2. Historical Market Size Value (US$ Bn) & Volume (Units) Analysis By Application, 2015-2021
7.3. Current and Future Market Size Value (US$ Bn) & Volume (Units) Analysis and Forecast By Application, 2022-2032
7.3.1. Tablet
7.3.2. Powder
7.3.3. Cream
7.3.4. Syrup
7.3.5. Aerosol
7.4. Y-o-Y Growth Trend Analysis By Application, 2015-2021
7.5. Absolute $ Opportunity Analysis By Application, 2022-2032
8. Global Pharmaceutical Packaging Equipment Market Analysis 2015–2021 and Forecast 2022–2032, By Region
8.1. Introduction / Key Findings
8.2. Historical Market Size Value (US$ Bn) & Volume (Units) Analysis By Region, 2015-2021
8.3. Current and Future Market Size Value (US$ Bn) & Volume (Units) Analysis and Forecast By Region, 2022-2032
8.3.1. North America
8.3.2. Latin America
8.3.3. Europe
8.3.4. East Asia
8.3.5. South Asia
8.3.6. Oceania
8.3.7. Middle East and Africa (MEA)
8.4. Market Attractiveness Analysis, by Region
9. North America Pharmaceutical Packaging Equipment Market Analysis 2015–2021 and Forecast 2022–2032, By Country
9.1. Historical Market Size Value (US$ Bn) & Volume (Units) Trend Analysis By Market Taxonomy, 2015-2021
9.2. Market Size Value (US$ Bn) & Volume (Units) Forecast By Market Taxonomy, 2022-2032
9.2.1. By Country
9.2.1.1. U.S.
9.2.1.2. Canada
9.2.2. By Automation
9.2.3. By Machine Type
9.2.4. By Application
9.3. Market Attractiveness Analysis
9.3.1. By Country
9.3.2. By Automation
9.3.3. By Machine Type
9.3.4. By Application
9.4. Key Takeaways
10. Latin America Pharmaceutical Packaging Equipment Market Analysis 2015–2021 and Forecast 2022–2032, By Country
10.1. Historical Market Size Value (US$ Bn) & Volume (Units) Trend Analysis By Market Taxonomy, 2015-2021
10.2. Market Size Value (US$ Bn) & Volume (Units) Forecast By Market Taxonomy, 2022-2032
10.2.1. By Country
10.2.1.1. Brazil
10.2.1.2. Mexico
10.2.1.3. Argentina
10.2.1.4. Chile
10.2.1.5. Peru
10.2.1.6. Rest of Latin America
10.2.2. By Automation
10.2.3. By Machine Type
10.2.4. By Application
10.3. Market Attractiveness Analysis
10.3.1. By Country
10.3.2. By Automation
10.3.3. By Machine Type
10.3.4. By Application
10.4. Key Takeaways
11. Europe Pharmaceutical Packaging Equipment Market Analysis 2015–2021 and Forecast 2022–2032, By Country
11.1. Historical Market Size Value (US$ Bn) & Volume (Units) Trend Analysis By Market Taxonomy, 2015-2021
11.2. Market Size Value (US$ Bn) & Volume (Units) Forecast By Market Taxonomy, 2022-2032
11.2.1. By Country
11.2.1.1. Germany
11.2.1.2. Italy
11.2.1.3. France
11.2.1.4. U.K.
11.2.1.5. Spain
11.2.1.6. BENELUX
11.2.1.7. Nordic
11.2.1.8. Russia
11.2.1.9. Poland
11.2.1.10. Rest of Europe
11.2.2. By Automation
11.2.3. By Machine Type
11.2.4. By Application
11.3. Market Attractiveness Analysis
11.3.1. By Country
11.3.2. By Automation
11.3.3. By Machine Type
11.3.4. By Application
11.4. Key Takeaways
12. East Asia Pharmaceutical Packaging Equipment Market Analysis 2015–2021 and Forecast 2022–2032, By Country
12.1. Historical Market Size Value (US$ Bn) & Volume (Units) Trend Analysis By Market Taxonomy, 2015-2021
12.2. Market Size Value (US$ Bn) & Volume (Units) Forecast By Market Taxonomy, 2022-2032
12.2.1. By Country
12.2.1.1. China
12.2.1.2. Japan
12.2.1.3. South Korea
12.2.2. By Automation
12.2.3. By Machine Type
12.2.4. By Application
12.3. Market Attractiveness Analysis
12.3.1. By Country
12.3.2. By Automation
12.3.3. By Machine Type
12.3.4. By Application
12.4. Key Takeaways
13. South Asia Pharmaceutical Packaging Equipment Market Analysis 2015–2021 and Forecast 2022–2032, By Country
13.1. Historical Market Size Value (US$ Bn) & Volume (Units) Trend Analysis By Market Taxonomy, 2015-2021
13.2. Market Size Value (US$ Bn) & Volume (Units) Forecast By Market Taxonomy, 2022-2032
13.2.1. By Country
13.2.1.1. India
13.2.1.2. Thailand
13.2.1.3. Malaysia
13.2.1.4. Indonesia
13.2.1.5. Rest of South Asia
13.2.2. By Automation
13.2.3. By Machine Type
13.2.4. By Application
13.3. Market Attractiveness Analysis
13.3.1. By Country
13.3.2. By Automation
13.3.3. By Machine Type
13.3.4. By Application
13.4. Key Takeaways
14. Oceania Pharmaceutical Packaging Equipment Market Analysis 2015–2021 and Forecast 2022–2032, By Country
14.1. Historical Market Size Value (US$ Bn) & Volume (Units) Trend Analysis By Market Taxonomy, 2015-2021
14.2. Market Size Value (US$ Bn) & Volume (Units) Forecast By Market Taxonomy, 2022-2032
14.2.1. By Country
14.2.1.1. Australia
14.2.1.2. New Zealand
14.2.2. By Automation
14.2.3. By Machine Type
14.2.4. By Application
14.3. Market Attractiveness Analysis
14.3.1. By Country
14.3.2. By Automation
14.3.3. By Machine Type
14.3.4. By Application
14.4. Key Takeaways
15. Middle East & Africa Pharmaceutical Packaging Equipment Market Analysis 2015–2021 and Forecast 2022–2032, By Country
15.1. Historical Market Size Value (US$ Bn) & Volume (Units) Trend Analysis By Market Taxonomy, 2015-2021
15.2. Market Size Value (US$ Bn) & Volume (Units) Forecast By Market Taxonomy, 2022-2032
15.2.1. By Country
15.2.1.1. GCC Countries
15.2.1.2. Turkey
15.2.1.3. Northern Africa
15.2.1.4. South Africa
15.2.1.5. Rest of MEA
15.2.2. By Automation
15.2.3. By Machine Type
15.2.4. By Application
15.3. Market Attractiveness Analysis
15.3.1. By Country
15.3.2. By Automation
15.3.3. By Machine Type
15.3.4. By Application
15.4. Key Takeaways
16. Country wise Pharmaceutical Packaging Equipment Market Analysis
16.1. United States (U.S.)
16.1.1. Market Share Analysis, 2022
16.1.2. By Automation
16.1.3. By Machine Type
16.1.4. By Application
16.2. Canada
16.2.1. Market Share Analysis, 2022
16.2.2. By Automation
16.2.3. By Machine Type
16.2.4. By Application
16.3. Brazil
16.3.1. Market Share Analysis, 2022
16.3.2. By Automation
16.3.3. By Machine Type
16.3.4. By Application
16.4. Mexico
16.4.1. Market Share Analysis, 2022
16.4.2. By Automation
16.4.3. By Machine Type
16.4.4. By Application
16.5. Germany
16.5.1. Market Share Analysis, 2022
16.5.2. By Automation
16.5.3. By Machine Type
16.5.4. By Application
16.6. Italy
16.6.1. Market Share Analysis, 2022
16.6.2. By Automation
16.6.3. By Machine Type
16.6.4. By Application
16.7. France
16.7.1. Market Share Analysis, 2022
16.7.2. By Automation
16.7.3. By Machine Type
16.7.4. By Application
16.8. Spain
16.8.1. Market Share Analysis, 2022
16.8.2. By Automation
16.8.3. By Machine Type
16.8.4. By Application
16.9. U.K.
16.9.1. Market Share Analysis, 2022
16.9.2. By Automation
16.9.3. By Machine Type
16.9.4. By Application
16.10. Russia
16.10.1. Market Share Analysis, 2022
16.10.2. By Automation
16.10.3. By Machine Type
16.10.4. By Application
16.11. China
16.11.1. Market Share Analysis, 2022
16.11.2. By Automation
16.11.3. By Machine Type
16.11.4. By Application
16.12. Japan
16.12.1. Market Share Analysis, 2022
16.12.2. By Automation
16.12.3. By Machine Type
16.12.4. By Application
16.13. India
16.13.1. Market Share Analysis, 2022
16.13.2. By Automation
16.13.3. By Machine Type
16.13.4. By Application
16.14. GCC Countries
16.14.1. Market Share Analysis, 2022
16.14.2. By Automation
16.14.3. By Machine Type
16.14.4. By Application
16.15. Australia
16.15.1. Market Share Analysis, 2022
16.15.2. By Automation
16.15.3. By Machine Type
16.15.4. By Application
17. Market Structure Analysis
17.1. Competition Dashboard
17.2. Competition Benchmarking
17.3. Market Share Analysis of Top Players
17.3.1. By Region
17.3.2. By Product Portfolio
18. Competition Analysis
18.1. Competition Dashboard
18.2. Competition Benchmarking
18.3. Competition Deep Dive
18.3.1.1. (Global Based/Operating Key Market Players)
18.3.2. Gerresheimer
18.3.2.1. Overview
18.3.2.2. Product Portfolio
18.3.2.3. Profitability by Market Segments (Product/Channel/Region)
18.3.2.4. Sales Footprint
18.3.2.5. Strategy Overview
18.3.2.5.1. Marketing Strategy
18.3.2.5.2. Product Strategy
18.3.2.5.3. Channel Strategy
18.3.3. Robert Bosch GmbH
18.3.3.1. Overview
18.3.3.2. Product Portfolio
18.3.3.3. Profitability by Market Segments (Product/Channel/Region)
18.3.3.4. Sales Footprint
18.3.3.5. Strategy Overview
18.3.3.5.1. Marketing Strategy
18.3.3.5.2. Product Strategy
18.3.3.5.3. Channel Strategy
18.3.4. I.M.A. Industria Macchine Automatiche SpA
18.3.4.1. Overview
18.3.4.2. Product Portfolio
18.3.4.3. Profitability by Market Segments (Product/Channel/Region)
18.3.4.4. Sales Footprint
18.3.4.5. Strategy Overview
18.3.4.5.1. Marketing Strategy
18.3.4.5.2. Product Strategy
18.3.4.5.3. Channel Strategy
18.3.5. Marchesini Group S.p.A
18.3.5.1. Overview
18.3.5.2. Product Portfolio
18.3.5.3. Profitability by Market Segments (Product/Channel/Region)
18.3.5.4. Sales Footprint
18.3.5.5. Strategy Overview
18.3.5.5.1. Marketing Strategy
18.3.5.5.2. Product Strategy
18.3.5.5.3. Channel Strategy
18.3.6. Bausch+Ströbel Maschinefabrik Ilshofen GmbH+Co. KG
18.3.6.1. Overview
18.3.6.2. Product Portfolio
18.3.6.3. Profitability by Market Segments (Product/Channel/Region)
18.3.6.4. Sales Footprint
18.3.6.5. Strategy Overview
18.3.6.5.1. Marketing Strategy
18.3.6.5.2. Product Strategy
18.3.6.5.3. Channel Strategy
18.3.7. Romaco Group
18.3.7.1. Overview
18.3.7.2. Product Portfolio
18.3.7.3. Profitability by Market Segments (Product/Channel/Region)
18.3.7.4. Sales Footprint
18.3.7.5. Strategy Overview
18.3.7.5.1. Marketing Strategy
18.3.7.5.2. Product Strategy
18.3.7.5.3. Channel Strategy
18.3.8. Dara Pharmaceutical Equipment
18.3.8.1. Overview
18.3.8.2. Product Portfolio
18.3.8.3. Profitability by Market Segments (Product/Channel/Region)
18.3.8.4. Sales Footprint
18.3.8.5. Strategy Overview
18.3.8.5.1. Marketing Strategy
18.3.8.5.2. Product Strategy
18.3.8.5.3. Channel Strategy
18.3.9. MULTIVAC Group
18.3.9.1. Overview
18.3.9.2. Product Portfolio
18.3.9.3. Profitability by Market Segments (Product/Channel/Region)
18.3.9.4. Sales Footprint
18.3.9.5. Strategy Overview
18.3.9.5.1. Marketing Strategy
18.3.9.5.2. Product Strategy
18.3.9.5.3. Channel Strategy
18.3.10. Accutek Pharmaceutical Equipment Companies, Inc.
18.3.10.1. Overview
18.3.10.2. Product Portfolio
18.3.10.3. Profitability by Market Segments (Product/Channel/Region)
18.3.10.4. Sales Footprint
18.3.10.5. Strategy Overview
18.3.10.5.1. Marketing Strategy
18.3.10.5.2. Product Strategy
18.3.10.5.3. Channel Strategy
18.3.11. OPTIMA Packaging Group
18.3.11.1. Overview
18.3.11.2. Product Portfolio
18.3.11.3. Profitability by Market Segments (Product/Channel/Region)
18.3.11.4. Sales Footprint
18.3.11.5. Strategy Overview
18.3.11.5.1. Marketing Strategy
18.3.11.5.2. Product Strategy
18.3.11.5.3. Channel Strategy
18.3.12. Trustar Pharma Pack Equipment, Co. Ltd.
18.3.12.1. Overview
18.3.12.2. Product Portfolio
18.3.12.3. Profitability by Market Segments (Product/Channel/Region)
18.3.12.4. Sales Footprint
18.3.12.5. Strategy Overview
18.3.12.5.1. Marketing Strategy
18.3.12.5.2. Product Strategy
18.3.12.5.3. Channel Strategy
18.3.13. MG2 s.r.l.
18.3.13.1. Overview
18.3.13.2. Product Portfolio
18.3.13.3. Profitability by Market Segments (Product/Channel/Region)
18.3.13.4. Sales Footprint
18.3.13.5. Strategy Overview
18.3.13.5.1. Marketing Strategy
18.3.13.5.2. Product Strategy
18.3.13.5.3. Channel Strategy
18.3.14. Inline Filling Systems
18.3.14.1. Overview
18.3.14.2. Product Portfolio
18.3.14.3. Profitability by Market Segments (Product/Channel/Region)
18.3.14.4. Sales Footprint
18.3.14.5. Strategy Overview
18.3.14.5.1. Marketing Strategy
18.3.14.5.2. Product Strategy
18.3.14.5.3. Channel Strategy
18.3.15. nVenia LLC
18.3.15.1. Overview
18.3.15.2. Product Portfolio
18.3.15.3. Profitability by Market Segments (Product/Channel/Region)
18.3.15.4. Sales Footprint
18.3.15.5. Strategy Overview
18.3.15.5.1. Marketing Strategy
18.3.15.5.2. Product Strategy
18.3.15.5.3. Channel Strategy
18.3.16. ACIC Pharmaceuticals Inc.
18.3.16.1. Overview
18.3.16.2. Product Portfolio
18.3.16.3. Profitability by Market Segments (Product/Channel/Region)
18.3.16.4. Sales Footprint
18.3.16.5. Strategy Overview
18.3.16.5.1. Marketing Strategy
18.3.16.5.2. Product Strategy
18.3.16.5.3. Channel Strategy
18.3.17. Harro Höfliger
18.3.17.1. Overview
18.3.17.2. Product Portfolio
18.3.17.3. Profitability by Market Segments (Product/Channel/Region)
18.3.17.4. Sales Footprint
18.3.17.5. Strategy Overview
18.3.17.5.1. Marketing Strategy
18.3.17.5.2. Product Strategy
18.3.17.5.3. Channel Strategy
18.3.18. NJM Packaging
18.3.18.1. Overview
18.3.18.2. Product Portfolio
18.3.18.3. Profitability by Market Segments (Product/Channel/Region)
18.3.18.4. Sales Footprint
18.3.18.5. Strategy Overview
18.3.18.5.1. Marketing Strategy
18.3.18.5.2. Product Strategy
18.3.18.5.3. Channel Strategy
18.3.19. CKD Corporation
18.3.19.1. Overview
18.3.19.2. Product Portfolio
18.3.19.3. Profitability by Market Segments (Product/Channel/Region)
18.3.19.4. Sales Footprint
18.3.19.5. Strategy Overview
18.3.19.5.1. Marketing Strategy
18.3.19.5.2. Product Strategy
18.3.19.5.3. Channel Strategy
18.3.20. Herma GmbH
18.3.20.1. Overview
18.3.20.2. Product Portfolio
18.3.20.3. Profitability by Market Segments (Product/Channel/Region)
18.3.20.4. Sales Footprint
18.3.20.5. Strategy Overview
18.3.20.5.1. Marketing Strategy
18.3.20.5.2. Product Strategy
18.3.20.5.3. Channel Strategy
18.3.21. ProMach, Inc.
18.3.21.1. Overview
18.3.21.2. Product Portfolio
18.3.21.3. Profitability by Market Segments (Product/Channel/Region)
18.3.21.4. Sales Footprint
18.3.21.5. Strategy Overview
18.3.21.5.1. Marketing Strategy
18.3.21.5.2. Product Strategy
18.3.21.5.3. Channel Strategy
19. Assumptions and Acronyms Used
20. Research Methodology
Let us know your requirement to get
100% FREE customization
List of Tables
Table 01: Global Pharmaceutical Packaging Equipment Market Value (US$ Bn) Forecast by Region, 2015-2032
Table 02: Global Pharmaceutical Packaging Equipment Market Volume (Units) Forecast by Region, 2015-2032
Table 03: Global Pharmaceutical Packaging Equipment Market Value (US$ Bn) Forecast by Automation, 2015-2032
Table 04: Global Pharmaceutical Packaging Equipment Market Volume (Units) Forecast by Automation, 2015-2032
Table 05: Global Pharmaceutical Packaging Equipment Market Value (US$ Bn) Forecast by Machine Type, 2015-2032
Table 06: Global Pharmaceutical Packaging Equipment Market Volume (Units) Forecast by Machine Type, 2015-2032
Table 07: Global Pharmaceutical Packaging Equipment Market Value (US$ Bn) Forecast by Application, 2015-2032
Table 08: Global Pharmaceutical Packaging Equipment Market Volume (Units) Forecast by Application, 2015-2032
Table 09: North America Pharmaceutical Packaging Equipment Market Value (US$ Bn) Forecast by Country, 2015-2032
Table 10: North America Pharmaceutical Packaging Equipment Market Volume (Units) Forecast by Country, 2015-2032
Table 11: North America Pharmaceutical Packaging Equipment Market Value (US$ Bn) Forecast by Automation, 2015-2032
Table 12: North America Pharmaceutical Packaging Equipment Market Volume (Units) Forecast by Automation, 2015-2032
Table 13: North America Pharmaceutical Packaging Equipment Market Value (US$ Bn) Forecast by Machine Type, 2015-2032
Table 14: North America Pharmaceutical Packaging Equipment Market Volume (Units) Forecast by Machine Type, 2015-2032
Table 15: North America Pharmaceutical Packaging Equipment Market Value (US$ Bn) Forecast by Application, 2015-2032
Table 16: North America Pharmaceutical Packaging Equipment Market Volume (Units) Forecast by Application, 2015-2032
Table 17: Latin America Pharmaceutical Packaging Equipment Market Value (US$ Bn) Forecast by Country, 2015-2032
Table 18: Latin America Pharmaceutical Packaging Equipment Market Volume (Units) Forecast by Country, 2015-2032
Table 19: Latin America Pharmaceutical Packaging Equipment Market Value (US$ Bn) Forecast by Automation, 2015-2032
Table 20: Latin America Pharmaceutical Packaging Equipment Market Volume (Units) Forecast by Automation, 2015-2032
Table 21: Latin America Pharmaceutical Packaging Equipment Market Value (US$ Bn) Forecast by Machine Type, 2015-2032
Table 22: Latin America Pharmaceutical Packaging Equipment Market Volume (Units) Forecast by Machine Type, 2015-2032
Table 23: Latin America Pharmaceutical Packaging Equipment Market Value (US$ Bn) Forecast by Application, 2015-2032
Table 24: Latin America Pharmaceutical Packaging Equipment Market Volume (Units) Forecast by Application, 2015-2032
Table 25: Europe Pharmaceutical Packaging Equipment Market Value (US$ Bn) Forecast by Country, 2015-2032
Table 26: Europe Pharmaceutical Packaging Equipment Market Volume (Units) Forecast by Country, 2015-2032
Table 27: Europe Pharmaceutical Packaging Equipment Market Value (US$ Bn) Forecast by Automation, 2015-2032
Table 28: Europe Pharmaceutical Packaging Equipment Market Volume (Units) Forecast by Automation, 2015-2032
Table 29: Europe Pharmaceutical Packaging Equipment Market Value (US$ Bn) Forecast by Machine Type, 2015-2032
Table 30: Europe Pharmaceutical Packaging Equipment Market Volume (Units) Forecast by Machine Type, 2015-2032
Table 31: Europe Pharmaceutical Packaging Equipment Market Value (US$ Bn) Forecast by Application, 2015-2032
Table 32: Europe Pharmaceutical Packaging Equipment Market Volume (Units) Forecast by Application, 2015-2032
Table 33: East Asia Pharmaceutical Packaging Equipment Market Value (US$ Bn) Forecast by Country, 2015-2032
Table 34: East Asia Pharmaceutical Packaging Equipment Market Volume (Units) Forecast by Country, 2015-2032
Table 35: East Asia Pharmaceutical Packaging Equipment Market Value (US$ Bn) Forecast by Automation, 2015-2032
Table 36: East Asia Pharmaceutical Packaging Equipment Market Volume (Units) Forecast by Automation, 2015-2032
Table 37: East Asia Pharmaceutical Packaging Equipment Market Value (US$ Bn) Forecast by Machine Type, 2015-2032
Table 38: East Asia Pharmaceutical Packaging Equipment Market Volume (Units) Forecast by Machine Type, 2015-2032
Table 39: East Asia Pharmaceutical Packaging Equipment Market Value (US$ Bn) Forecast by Application, 2015-2032
Table 40: East Asia Pharmaceutical Packaging Equipment Market Volume (Units) Forecast by Application, 2015-2032
Table 41: South Asia Pharmaceutical Packaging Equipment Market Value (US$ Bn) Forecast by Country, 2015-2032
Table 42: South Asia Pharmaceutical Packaging Equipment Market Volume (Units) Forecast by Country, 2015-2032
Table 43: South Asia Pharmaceutical Packaging Equipment Market Value (US$ Bn) Forecast by Automation, 2015-2032
Table 44: South Asia Pharmaceutical Packaging Equipment Market Volume (Units) Forecast by Automation, 2015-2032
Table 45: South Asia Pharmaceutical Packaging Equipment Market Value (US$ Bn) Forecast by Machine Type, 2015-2032
Table 46: South Asia Pharmaceutical Packaging Equipment Market Volume (Units) Forecast by Machine Type, 2015-2032
Table 47: South Asia Pharmaceutical Packaging Equipment Market Value (US$ Bn) Forecast by Application, 2015-2032
Table 48: South Asia Pharmaceutical Packaging Equipment Market Volume (Units) Forecast by Application, 2015-2032
Table 49: Oceania Pharmaceutical Packaging Equipment Market Value (US$ Bn) Forecast by Country, 2015-2032
Table 50: Oceania Pharmaceutical Packaging Equipment Market Volume (Units) Forecast by Country, 2015-2032
Table 51: Oceania Pharmaceutical Packaging Equipment Market Value (US$ Bn) Forecast by Automation, 2015-2032
Table 52: Oceania Pharmaceutical Packaging Equipment Market Volume (Units) Forecast by Automation, 2015-2032
Table 53: Oceania Pharmaceutical Packaging Equipment Market Value (US$ Bn) Forecast by Machine Type, 2015-2032
Table 54: Oceania Pharmaceutical Packaging Equipment Market Volume (Units) Forecast by Machine Type, 2015-2032
Table 55: Oceania Pharmaceutical Packaging Equipment Market Value (US$ Bn) Forecast by Application, 2015-2032
Table 56: Oceania Pharmaceutical Packaging Equipment Market Volume (Units) Forecast by Application, 2015-2032
Table 57: MEA Pharmaceutical Packaging Equipment Market Value (US$ Bn) Forecast by Country, 2015-2032
Table 58: MEA Pharmaceutical Packaging Equipment Market Volume (Units) Forecast by Country, 2015-2032
Table 59: MEA Pharmaceutical Packaging Equipment Market Value (US$ Bn) Forecast by Automation, 2015-2032
Table 60: MEA Pharmaceutical Packaging Equipment Market Volume (Units) Forecast by Automation, 2015-2032
Table 61: MEA Pharmaceutical Packaging Equipment Market Value (US$ Bn) Forecast by Machine Type, 2015-2032
Table 62: MEA Pharmaceutical Packaging Equipment Market Volume (Units) Forecast by Machine Type, 2015-2032
Table 63: MEA Pharmaceutical Packaging Equipment Market Value (US$ Bn) Forecast by Application, 2015-2032
Table 64: MEA Pharmaceutical Packaging Equipment Market Volume (Units) Forecast by Application, 2015-2032
Table 65: U.S. Pharmaceutical Packaging Equipment Market Value (US$ Bn) Forecast by Automation, Machine Type, and Application (2022(E) & 2032(F))
Table 66: Brazil Pharmaceutical Packaging Equipment Market Value (US$ Bn) Forecast by Automation, Machine Type, and Application (2022(E) & 2032(F))
Table 67: Mexico Pharmaceutical Packaging Equipment Market Value (US$ Bn) Forecast by Automation, Machine Type, and Application (2022(E) & 2032(F))
Table 68: Germany Pharmaceutical Packaging Equipment Market Value (US$ Bn) Forecast by Automation, Machine Type, and Application (2022(E) & 2032(F))
Table 69: Italy Pharmaceutical Packaging Equipment Market Value (US$ Bn) Forecast by Automation, Machine Type, and Application (2022(E) & 2032(F))
Table 70: France Pharmaceutical Packaging Equipment Market Value (US$ Bn) Forecast by Automation, Machine Type, and Application (2022(E) & 2032(F))
Table 71: Spain Pharmaceutical Packaging Equipment Market Value (US$ Bn) Forecast by Automation, Machine Type, and Application (2022(E) & 2032(F))
Table 72: U.K. Pharmaceutical Packaging Equipment Market Value (US$ Bn) Forecast by Automation, Machine Type, and Application (2022(E) & 2032(F))
Table 73: China Pharmaceutical Packaging Equipment Market Value (US$ Bn) Forecast by Automation, Machine Type, and Application (2022(E) & 2032(F))
Table 74: Japan Pharmaceutical Packaging Equipment Market Value (US$ Bn) Forecast by Automation, Machine Type, and Application (2022(E) & 2032(F))
Table 75: India Pharmaceutical Packaging Equipment Market Value (US$ Bn) Forecast by Automation, Machine Type, and Application (2022(E) & 2032(F))
Table 76: Australia Pharmaceutical Packaging Equipment Market Value (US$ Bn) Forecast by Automation, Machine Type, and Application (2022(E) & 2032(F))
Find your sweet spots for generating winning opportunities in this market.
Talk to AnalystList of Charts
Figure 01: Global Pharmaceutical Packaging Equipment Market Value (US$ Bn) by Automation, 2022-2032
Figure 02: Global Pharmaceutical Packaging Equipment Market Value (US$ Bn) by Machine Type, 2022-2032
Figure 03: Global Pharmaceutical Packaging Equipment Market Value (US$ Bn) by Application, 2022-2032
Figure 04: Global Pharmaceutical Packaging Equipment Market Value (US$ Bn) by Region, 2022-2032
Figure 05: Global Pharmaceutical Packaging Equipment Market Value (US$ Bn) Analysis by Region, 2015-2021
Figure 06: Global Pharmaceutical Packaging Equipment Market Volume (Units) Analysis by Region, 2015-2032
Figure 07: Global Pharmaceutical Packaging Equipment Market Value Share (%) and BPS Analysis by Region, 2022 & 2032
Figure 08: Global Pharmaceutical Packaging Equipment Market Y-o-Y Growth (%) Projections by Region, 2022-2032
Figure 09: Global Pharmaceutical Packaging Equipment Market Value (US$ Bn) Analysis by Automation, 2015-2021
Figure 10: Global Pharmaceutical Packaging Equipment Market Volume (Units) Analysis by Automation, 2015-2032
Figure 11: Global Pharmaceutical Packaging Equipment Market Value Share (%) and BPS Analysis by Automation, 2022 & 2032
Figure 12: Global Pharmaceutical Packaging Equipment Market Y-o-Y Growth (%) Projections by Automation, 2022-2032
Figure 13: Global Pharmaceutical Packaging Equipment Market Value (US$ Bn) Analysis by Machine Type, 2015-2021
Figure 14: Global Pharmaceutical Packaging Equipment Market Volume (Units) Analysis by Machine Type, 2015-2032
Figure 15: Global Pharmaceutical Packaging Equipment Market Value Share (%) and BPS Analysis by Machine Type, 2022 & 2032
Figure 16: Global Pharmaceutical Packaging Equipment Market Y-o-Y Growth (%) Projections by Machine Type, 2022-2032
Figure 17: Global Pharmaceutical Packaging Equipment Market Value (US$ Bn) Analysis by Application, 2015-2021
Figure 18: Global Pharmaceutical Packaging Equipment Market Volume (Units) Analysis by Application, 2015-2032
Figure 19: Global Pharmaceutical Packaging Equipment Market Value Share (%) and BPS Analysis by Application, 2022 & 2032
Figure 20: Global Pharmaceutical Packaging Equipment Market Y-o-Y Growth (%) Projections by Application, 2022-2032
Figure 21: Global Pharmaceutical Packaging Equipment Market Attractiveness by Automation, 2022-2032
Figure 22: Global Pharmaceutical Packaging Equipment Market Attractiveness by Machine Type, 2022-2032
Figure 23: Global Pharmaceutical Packaging Equipment Market Attractiveness by Application, 2022-2032
Figure 24: Global Pharmaceutical Packaging Equipment Market Attractiveness by Application, 2022-2032
Figure 25: Global Pharmaceutical Packaging Equipment Market Attractiveness by Region, 2022-2032
Figure 26: North America Pharmaceutical Packaging Equipment Market Value (US$ Bn) by Automation, 2022-2032
Figure 27: North America Pharmaceutical Packaging Equipment Market Value (US$ Bn) by Machine Type, 2022-2032
Figure 28: North America Pharmaceutical Packaging Equipment Market Value (US$ Bn) by Application, 2022-2032
Figure 29: North America Pharmaceutical Packaging Equipment Market Value (US$ Bn) by Country, 2022-2032
Figure 30: North America Pharmaceutical Packaging Equipment Market Value (US$ Bn) Analysis by Country, 2015-2021
Figure 31: North America Pharmaceutical Packaging Equipment Market Volume (Units) Analysis by Country, 2015-2032
Figure 32: North America Pharmaceutical Packaging Equipment Market Value Share (%) and BPS Analysis by Country, 2022 & 2032
Figure 33: North America Pharmaceutical Packaging Equipment Market Y-o-Y Growth (%) Projections by Country, 2022-2032
Figure 34: North America Pharmaceutical Packaging Equipment Market Value (US$ Bn) Analysis by Automation, 2015-2021
Figure 35: North America Pharmaceutical Packaging Equipment Market Volume (Units) Analysis by Automation, 2015-2032
Figure 36: North America Pharmaceutical Packaging Equipment Market Value Share (%) and BPS Analysis by Automation, 2022 & 2032
Figure 37: North America Pharmaceutical Packaging Equipment Market Y-o-Y Growth (%) Projections by Automation, 2022-2032
Figure 38: North America Pharmaceutical Packaging Equipment Market Value (US$ Bn) Analysis by Machine Type, 2015-2021
Figure 39: North America Pharmaceutical Packaging Equipment Market Volume (Units) Analysis by Machine Type, 2015-2032
Figure 40: North America Pharmaceutical Packaging Equipment Market Value Share (%) and BPS Analysis by Machine Type, 2022 & 2032
Figure 41: North America Pharmaceutical Packaging Equipment Market Y-o-Y Growth (%) Projections by Machine Type, 2022-2032
Figure 42: North America Pharmaceutical Packaging Equipment Market Value (US$ Bn) Analysis by Application, 2015-2021
Figure 43: North America Pharmaceutical Packaging Equipment Market Volume (Units) Analysis by Application, 2015-2032
Figure 44: North America Pharmaceutical Packaging Equipment Market Value Share (%) and BPS Analysis by Application, 2022 & 2032
Figure 45: North America Pharmaceutical Packaging Equipment Market Y-o-Y Growth (%) Projections by Application, 2022-2032
Figure 46: North America Pharmaceutical Packaging Equipment Market Attractiveness by Automation, 2022-2032
Figure 47: North America Pharmaceutical Packaging Equipment Market Attractiveness by Machine Type, 2022-2032
Figure 48: North America Pharmaceutical Packaging Equipment Market Attractiveness by Application, 2022-2032
Figure 49: North America Pharmaceutical Packaging Equipment Market Attractiveness by Country, 2022-2032
Figure 50: Latin America Pharmaceutical Packaging Equipment Market Value (US$ Bn) by Automation, 2022 & 2032
Figure 51: Latin America Pharmaceutical Packaging Equipment Market Value (US$ Bn) by Machine Type, 2022-2032
Figure 52: Latin America Pharmaceutical Packaging Equipment Market Value (US$ Bn) by Application, 2022-2032
Figure 53: Latin America Pharmaceutical Packaging Equipment Market Value (US$ Bn) by Country, 2022-2032
Figure 54: Latin America Pharmaceutical Packaging Equipment Market Value (US$ Bn) Analysis by Country, 2015-2021
Figure 55: Latin America Pharmaceutical Packaging Equipment Market Volume (Units) Analysis by Country, 2015-2032
Figure 56: Latin America Pharmaceutical Packaging Equipment Market Value Share (%) and BPS Analysis by Country, 2022 & 2032
Figure 57: Latin America Pharmaceutical Packaging Equipment Market Y-o-Y Growth (%) Projections by Country, 2022-2032
Figure 58: Latin America Pharmaceutical Packaging Equipment Market Value (US$ Bn) Analysis by Automation, 2015-2021
Figure 59: Latin America Pharmaceutical Packaging Equipment Market Volume (Units) Analysis by Automation, 2015-2032
Figure 60: Latin America Pharmaceutical Packaging Equipment Market Value Share (%) and BPS Analysis by Automation, 2022 & 2032
Figure 61: Latin America Pharmaceutical Packaging Equipment Market Y-o-Y Growth (%) Projections by Automation, 2022-2032
Figure 62: Latin America Pharmaceutical Packaging Equipment Market Value (US$ Bn) Analysis by Machine Type, 2015-2021
Figure 63: Latin America Pharmaceutical Packaging Equipment Market Volume (Units) Analysis by Machine Type, 2015-2032
Figure 64: Latin America Pharmaceutical Packaging Equipment Market Value Share (%) and BPS Analysis by Machine Type, 2022 & 2032
Figure 65: Latin America Pharmaceutical Packaging Equipment Market Y-o-Y Growth (%) Projections by Machine Type, 2022-2032
Figure 66: Latin America Pharmaceutical Packaging Equipment Market Value (US$ Bn) Analysis by Application, 2015-2021
Figure 67: Latin America Pharmaceutical Packaging Equipment Market Volume (Units) Analysis by Application, 2015-2032
Figure 68: Latin America Pharmaceutical Packaging Equipment Market Value Share (%) and BPS Analysis by Application, 2022 & 2032
Figure 69: Latin America Pharmaceutical Packaging Equipment Market Y-o-Y Growth (%) Projections by Application, 2022-2032
Figure 70: Latin America Pharmaceutical Packaging Equipment Market Attractiveness by Automation, 2022-2032
Figure 71: Latin America Pharmaceutical Packaging Equipment Market Attractiveness by Machine Type, 2022-2032
Figure 72: Latin America Pharmaceutical Packaging Equipment Market Attractiveness by Application, 2022-2032
Figure 73: Latin America Pharmaceutical Packaging Equipment Market Attractiveness by Country, 2022-2032
Figure 74: Europe Pharmaceutical Packaging Equipment Market Value (US$ Bn) by Automation, 2022-2032
Figure 75: Europe Pharmaceutical Packaging Equipment Market Value (US$ Bn) by Machine Type, 2022-2032
Figure 76: Europe Pharmaceutical Packaging Equipment Market Value (US$ Bn) by Application, 2022-2032
Figure 77: Europe Pharmaceutical Packaging Equipment Market Value (US$ Bn) by Country, 2022-2032
Figure 78: Europe Pharmaceutical Packaging Equipment Market Value (US$ Bn) Analysis by Country, 2015-2021
Figure 79: Europe Pharmaceutical Packaging Equipment Market Volume (Units) Analysis by Country, 2015-2032
Figure 80: Europe Pharmaceutical Packaging Equipment Market Value Share (%) and BPS Analysis by Country, 2022 & 2032
Figure 81: Europe Pharmaceutical Packaging Equipment Market Y-o-Y Growth (%) Projections by Country, 2022-2032
Figure 82: Europe Pharmaceutical Packaging Equipment Market Value (US$ Bn) Analysis by Automation, 2015-2021
Figure 83: Europe Pharmaceutical Packaging Equipment Market Volume (Units) Analysis by Automation, 2015-2032
Figure 84: Europe Pharmaceutical Packaging Equipment Market Value Share (%) and BPS Analysis by Automation, 2022 & 2032
Figure 85: Europe Pharmaceutical Packaging Equipment Market Y-o-Y Growth (%) Projections by Automation, 2022-2032
Figure 86: Europe Pharmaceutical Packaging Equipment Market Value (US$ Bn) Analysis by Machine Type, 2015-2021
Figure 87: Europe Pharmaceutical Packaging Equipment Market Volume (Units) Analysis by Machine Type, 2015-2032
Figure 88: Europe Pharmaceutical Packaging Equipment Market Value Share (%) and BPS Analysis by Machine Type, 2022 & 2032
Figure 89: Europe Pharmaceutical Packaging Equipment Market Y-o-Y Growth (%) Projections by Machine Type, 2022-2032
Figure 90: Europe Pharmaceutical Packaging Equipment Market Value (US$ Bn) Analysis by Application, 2015-2021
Figure 91: Europe Pharmaceutical Packaging Equipment Market Volume (Units) Analysis by Application, 2015-2032
Figure 92: Europe Pharmaceutical Packaging Equipment Market Value Share (%) and BPS Analysis by Application, 2022 & 2032
Figure 93: Europe Pharmaceutical Packaging Equipment Market Y-o-Y Growth (%) Projections by Application, 2022-2032
Figure 94: Europe Pharmaceutical Packaging Equipment Market Attractiveness by Automation, 2022-2032
Figure 95: Europe Pharmaceutical Packaging Equipment Market Attractiveness by Machine Type, 2022-2032
Figure 96: Europe Pharmaceutical Packaging Equipment Market Attractiveness by Application, 2022-2032
Figure 97: Europe Pharmaceutical Packaging Equipment Market Attractiveness by Country, 2022-2032
Figure 98: East Asia Pharmaceutical Packaging Equipment Market Value (US$ Bn) by Automation, 2022-2032
Figure 99: East Asia Pharmaceutical Packaging Equipment Market Value (US$ Bn) by Machine Type, 2022-2032
Figure 100: East Asia Pharmaceutical Packaging Equipment Market Value (US$ Bn) by Application, 2022-2032
Figure 101: East Asia Pharmaceutical Packaging Equipment Market Value (US$ Bn) by Country, 2022-2032
Figure 102: East Asia Pharmaceutical Packaging Equipment Market Value (US$ Bn) Analysis by Country, 2015-2021
Figure 103: East Asia Pharmaceutical Packaging Equipment Market Volume (Units) Analysis by Country, 2015-2032
Figure 104: East Asia Pharmaceutical Packaging Equipment Market Value Share (%) and BPS Analysis by Country, 2022 & 2032
Figure 105: East Asia Pharmaceutical Packaging Equipment Market Y-o-Y Growth (%) Projections by Country, 2022-2032
Figure 106: East Asia Pharmaceutical Packaging Equipment Market Value (US$ Bn) Analysis by Automation, 2015-2021
Figure 107: East Asia Pharmaceutical Packaging Equipment Market Volume (Units) Analysis by Automation, 2015-2032
Figure 108: East Asia Pharmaceutical Packaging Equipment Market Value Share (%) and BPS Analysis by Automation, 2022 & 2032
Figure 109: East Asia Pharmaceutical Packaging Equipment Market Y-o-Y Growth (%) Projections by Automation, 2022-2032
Figure 110: East Asia Pharmaceutical Packaging Equipment Market Value (US$ Bn) Analysis by Machine Type, 2015-2021
Figure 111: East Asia Pharmaceutical Packaging Equipment Market Volume (Units) Analysis by Machine Type, 2015-2032
Figure 112: East Asia Pharmaceutical Packaging Equipment Market Value Share (%) and BPS Analysis by Machine Type, 2022 & 2032
Figure 113: East Asia Pharmaceutical Packaging Equipment Market Y-o-Y Growth (%) Projections by Machine Type, 2022-2032
Figure 114: East Asia Pharmaceutical Packaging Equipment Market Value (US$ Bn) Analysis by Application, 2015-2021
Figure 115: East Asia Pharmaceutical Packaging Equipment Market Volume (Units) Analysis by Application, 2015-2032
Figure 116: East Asia Pharmaceutical Packaging Equipment Market Value Share (%) and BPS Analysis by Application, 2022 & 2032
Figure 117: East Asia Pharmaceutical Packaging Equipment Market Y-o-Y Growth (%) Projections by Application, 2022-2032
Figure 118: East Asia Pharmaceutical Packaging Equipment Market Attractiveness by Automation, 2022-2032
Figure 119: East Asia Pharmaceutical Packaging Equipment Market Attractiveness by Machine Type, 2022-2032
Figure 120: East Asia Pharmaceutical Packaging Equipment Market Attractiveness by Application, 2022-2032
Figure 121: East Asia Pharmaceutical Packaging Equipment Market Attractiveness by Country, 2022-2032
Figure 122: South Asia Pharmaceutical Packaging Equipment Market Value (US$ Bn) by Automation, 2022-2032
Figure 123: South Asia Pharmaceutical Packaging Equipment Market Value (US$ Bn) by Machine Type, 2022-2032
Figure 124: South Asia Pharmaceutical Packaging Equipment Market Value (US$ Bn) by Application, 2022-2032
Figure 125: South Asia Pharmaceutical Packaging Equipment Market Value (US$ Bn) by Country, 2022-2032
Figure 126: South Asia Pharmaceutical Packaging Equipment Market Value (US$ Bn) Analysis by Country, 2015-2021
Figure 127: South Asia Pharmaceutical Packaging Equipment Market Volume (Units) Analysis by Country, 2015-2032
Figure 128: South Asia Pharmaceutical Packaging Equipment Market Value Share (%) and BPS Analysis by Country, 2022 & 2032
Figure 129: South Asia Pharmaceutical Packaging Equipment Market Y-o-Y Growth (%) Projections by Country, 2022-2032
Figure 130: South Asia Pharmaceutical Packaging Equipment Market Value (US$ Bn) Analysis by Automation, 2015-2021
Figure 131: South Asia Pharmaceutical Packaging Equipment Market Volume (Units) Analysis by Automation, 2015-2032
Figure 132: South Asia Pharmaceutical Packaging Equipment Market Value Share (%) and BPS Analysis by Automation, 2022 & 2032
Figure 133: South Asia Pharmaceutical Packaging Equipment Market Y-o-Y Growth (%) Projections by Automation, 2022-2032
Figure 134: South Asia Pharmaceutical Packaging Equipment Market Value (US$ Bn) Analysis by Machine Type, 2015-2021
Figure 135: South Asia Pharmaceutical Packaging Equipment Market Volume (Units) Analysis by Machine Type, 2015-2032
Figure 136: South Asia Pharmaceutical Packaging Equipment Market Value Share (%) and BPS Analysis by Machine Type, 2022 & 2032
Figure 137: South Asia Pharmaceutical Packaging Equipment Market Y-o-Y Growth (%) Projections by Machine Type, 2022-2032
Figure 138: South Asia Pharmaceutical Packaging Equipment Market Value (US$ Bn) Analysis by Application, 2015-2021
Figure 139: South Asia Pharmaceutical Packaging Equipment Market Volume (Units) Analysis by Application, 2015-2032
Figure 140: South Asia Pharmaceutical Packaging Equipment Market Value Share (%) and BPS Analysis by Application, 2022 & 2032
Figure 141: South Asia Pharmaceutical Packaging Equipment Market Y-o-Y Growth (%) Projections by Application, 2022-2032
Figure 142: South Asia Pharmaceutical Packaging Equipment Market Attractiveness by Automation, 2022-2032
Figure 143: South Asia Pharmaceutical Packaging Equipment Market Attractiveness by Machine Type, 2022-2032
Figure 144: South Asia Pharmaceutical Packaging Equipment Market Attractiveness by Application, 2022-2032
Figure 145: South Asia Pharmaceutical Packaging Equipment Market Attractiveness by Country, 2022-2032
Figure 146: Oceania Pharmaceutical Packaging Equipment Market Value (US$ Bn) by Automation, 2022-2032
Figure 147: Oceania Pharmaceutical Packaging Equipment Market Value (US$ Bn) by Machine Type, 2022-2032
Figure 148: Oceania Pharmaceutical Packaging Equipment Market Value (US$ Bn) by Application, 2022-2032
Figure 149: Oceania Pharmaceutical Packaging Equipment Market Value (US$ Bn) by Country, 2022-2032
Figure 150: Oceania Pharmaceutical Packaging Equipment Market Value (US$ Bn) Analysis by Country, 2015-2021
Figure 151: Oceania Pharmaceutical Packaging Equipment Market Volume (Units) Analysis by Country, 2015-2032
Figure 152: Oceania Pharmaceutical Packaging Equipment Market Value Share (%) and BPS Analysis by Country, 2022 & 2032
Figure 153: Oceania Pharmaceutical Packaging Equipment Market Y-o-Y Growth (%) Projections by Country, 2022-2032
Figure 154: Oceania Pharmaceutical Packaging Equipment Market Value (US$ Bn) Analysis by Automation, 2015-2021
Figure 155: Oceania Pharmaceutical Packaging Equipment Market Volume (Units) Analysis by Automation, 2015-2032
Figure 156: Oceania Pharmaceutical Packaging Equipment Market Value Share (%) and BPS Analysis by Automation, 2022 & 2032
Figure 157: Oceania Pharmaceutical Packaging Equipment Market Y-o-Y Growth (%) Projections by Automation, 2022-2032
Figure 158: Oceania Pharmaceutical Packaging Equipment Market Value (US$ Bn) Analysis by Machine Type, 2015-2021
Figure 159: Oceania Pharmaceutical Packaging Equipment Market Volume (Units) Analysis by Machine Type, 2015-2032
Figure 160: Oceania Pharmaceutical Packaging Equipment Market Value Share (%) and BPS Analysis by Machine Type, 2022 & 2032
Figure 161: Oceania Pharmaceutical Packaging Equipment Market Y-o-Y Growth (%) Projections by Machine Type, 2022-2032
Figure 162: Oceania Pharmaceutical Packaging Equipment Market Value (US$ Bn) Analysis by Application, 2015-2021
Figure 163: Oceania Pharmaceutical Packaging Equipment Market Volume (Units) Analysis by Application, 2015-2032
Figure 164: Oceania Pharmaceutical Packaging Equipment Market Value Share (%) and BPS Analysis by Application, 2022 & 2032
Figure 165: Oceania Pharmaceutical Packaging Equipment Market Y-o-Y Growth (%) Projections by Application, 2022-2032
Figure 166: Oceania Pharmaceutical Packaging Equipment Market Attractiveness by Automation, 2022-2032
Figure 167: Oceania Pharmaceutical Packaging Equipment Market Attractiveness by Machine Type, 2022-2032
Figure 168: Oceania Pharmaceutical Packaging Equipment Market Attractiveness by Application, 2022-2032
Figure 169 Oceania Pharmaceutical Packaging Equipment Market Attractiveness by Country, 2022-2032
Figure 170: MEA Pharmaceutical Packaging Equipment Market Value (US$ Bn) by Automation, 2022-2032
Figure 171: MEA Pharmaceutical Packaging Equipment Market Value (US$ Bn) by Machine Type, 2022-2032
Figure 172: MEA Pharmaceutical Packaging Equipment Market Value (US$ Bn) by Application, 2022-2032
Figure 173: MEA Pharmaceutical Packaging Equipment Market Value (US$ Bn) by Country, 2022-2032
Figure 174: MEA Pharmaceutical Packaging Equipment Market Value (US$ Bn) Analysis by Country, 2015-2021
Figure 175: MEA Pharmaceutical Packaging Equipment Market Volume (Units) Analysis by Country, 2015-2032
Figure 176: MEA Pharmaceutical Packaging Equipment Market Value Share (%) and BPS Analysis by Country, 2022 & 2032
Figure 177: MEA Pharmaceutical Packaging Equipment Market Y-o-Y Growth (%) Projections by Country, 2022-2032
Figure 178: MEA Pharmaceutical Packaging Equipment Market Value (US$ Bn) Analysis by Automation, 2015-2021
Figure 179: MEA Pharmaceutical Packaging Equipment Market Volume (Units) Analysis by Automation, 2015-2032
Figure 180: MEA Pharmaceutical Packaging Equipment Market Value Share (%) and BPS Analysis by Automation, 2022 & 2032
Figure 181: MEA Pharmaceutical Packaging Equipment Market Y-o-Y Growth (%) Projections by Automation, 2022-2032
Figure 182: MEA Pharmaceutical Packaging Equipment Market Value (US$ Bn) Analysis by Machine Type, 2015-2021
Figure 183: MEA Pharmaceutical Packaging Equipment Market Volume (Units) Analysis by Machine Type, 2015-2032
Figure 184: MEA Pharmaceutical Packaging Equipment Market Value Share (%) and BPS Analysis by Machine Type, 2022 & 2032
Figure 185: MEA Pharmaceutical Packaging Equipment Market Y-o-Y Growth (%) Projections by Machine Type, 2022-2032
Figure 186: MEA Pharmaceutical Packaging Equipment Market Value (US$ Bn) Analysis by Application, 2015-2021
Figure 187: MEA Pharmaceutical Packaging Equipment Market Volume (Units) Analysis by Application, 2015-2032
Figure 188: MEA Pharmaceutical Packaging Equipment Market Value Share (%) and BPS Analysis by Application, 2022 & 2032
Figure 189: MEA Pharmaceutical Packaging Equipment Market Y-o-Y Growth (%) Projections by Application, 2022-2032
Figure 190: MEA Pharmaceutical Packaging Equipment Market Attractiveness by Automation, 2022-2032
Figure 191: MEA Pharmaceutical Packaging Equipment Market Attractiveness by Machine Type, 2022-2032
Figure 192: MEA Pharmaceutical Packaging Equipment Market Attractiveness by Application, 2022-2032
Figure 193 MEA Pharmaceutical Packaging Equipment Market Attractiveness by Country, 2022-2032
Need specific information?
Request CustomizationExplore Packaging Insights
View Reports