Pharmaceutical Container Market
Market Insights on Pharmaceutical Container covering sales outlook, demand forecast & up-to-date key trends
Pharmaceutical Container Market By Product, Material & Region - Forecast 2022 – 2032
Pharmaceutical Container Market Outlook (2022-2032)
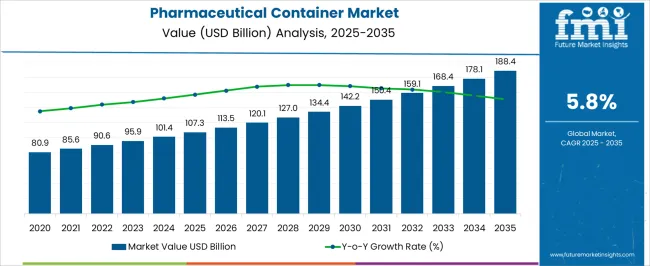
[333 Pages Report] The global pharmaceutical container market is all set to grow at a CAGR of 7.2% from US$ 90 Billion in 2022 to US$ to US$ 180.38 Billion in 2032.
The pharmaceutical containers are an important component of the medical industry. Since the time the covid-19 pandemic struck the world, the demand for pharmaceutical container has grown even more, especially for storing vaccines.
Report Attribute |
Details |
Pharmaceutical Containers Market Value (2022) |
US$ 90 Billion |
Pharmaceutical Containers Market Anticipated Forecast Value (2032) |
US$ 180.38 Billion |
Pharmaceutical Containers Market Projected Growth Rate (2022-2032) |
7.2% |
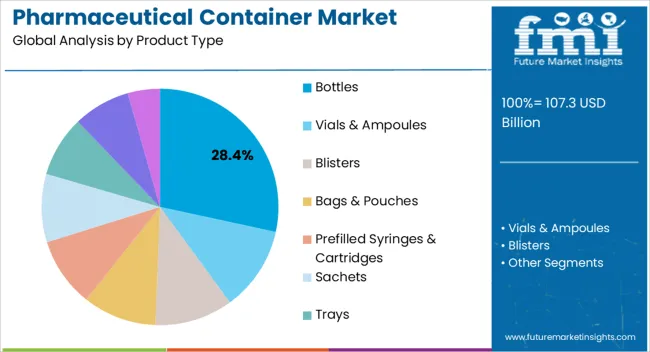
Pharmaceutical bottles are packaging systems specifically designed to meet the packaging requirements for pharmaceutical substances such as tablets, capsules, solutions & suspensions, sterile injectable and others, whereas vials are small containers that are mainly used to certify that patients take their dosage of drug in a precise quantity with timely manner. Plastic Bottles and vials play vital role in growth of pharmaceutical container market globally.
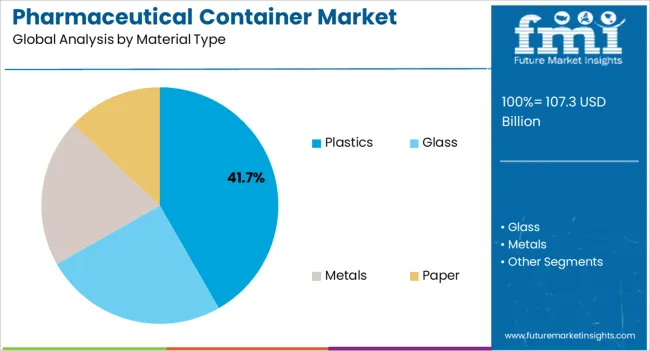
Plastic bottle accounts for the significant share of the pharmaceutical container market due to the low cost, durability, and versatility. Plastic bottles are cheaper to produce, easier to replace, and convenient to transport to long distances, hence driving the demand of pharmaceutical container market.
Whereas vials ensure precise dosages which helps patients prefer self-administration of the medicine and are without any formal medical training. Owing to its manufacturing and formulation design, ampoules and vials can be stored easily due to its crack resistant covering/shield in which it is stored and transported.
Let us know your requirement to get
100% FREE customization
What are the Key Market Drivers influencing the Sales of Pharmaceutical Container Market?
The biggest advantage of using pharmaceutical containers is that, we can add preservatives in the type of container we want to, as a result of which the shelf life of the syrup/tablet increases. Moreover, the transportation of the medicine also becomes easier, as a result of which, patients across the globe can be treated. These factors have increased the demand for pharmaceutical containers across the world.
Thanks to the initiatives and proactive steps taken by the government bodies and other NGOs, that more and more people have started taking their health seriously, and would conduct periodic health check-ups. This has ultimately increased the sales of pharmaceutical containers.
The pharmaceutical companies also give us the liberty of customisation. The drug company can select the shape of size of the container suitable for its medicine, and can accordingly place the order for the required containers. The option of customisation has increased the demand for pharmaceutical containers.
In the present era, with the technology getting advanced, and the companies working towards sustainable future for the coming generations, the main principle behind developing the pharmaceutical containers has been 3R, which stands for Reduce, Reuse, Recycle.
Reduce means to reduce the presence of non-biodegradable components, and making use of biodegradable components. Reuse means to develop containers in such a manner, so that they can be reused and are environmentally friendly as well. Recycle, as the name implies, if the container is of no use, it should be in a position to be recycled, instead of increasing pollution. Keeping all these things in mind, the sales of pharmaceutical containers would go high, and these containers will be valuable for creating a sustainable environment.
Of late, there have been huge followers of ayurveda. Ayurveda also provides certain medications to the respective patients. If the container manufacturers somehow manage to tap into the ayurveda market, the demand for pharmaceutical containers would certainly boom and they will capture a huge market.
What is the Regional Outlook for the Pharmaceutical Containers Market?
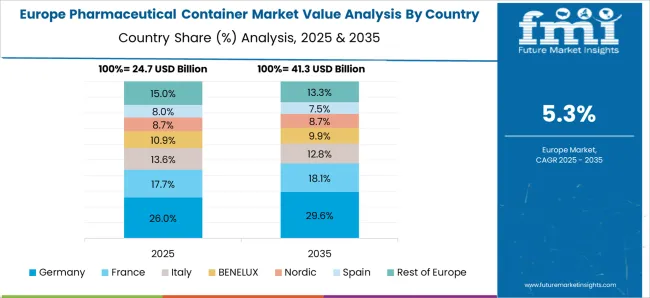
At present, North America is the biggest market for pharmaceutical containers. Even Europe is a huge market for the pharmaceutical containers.
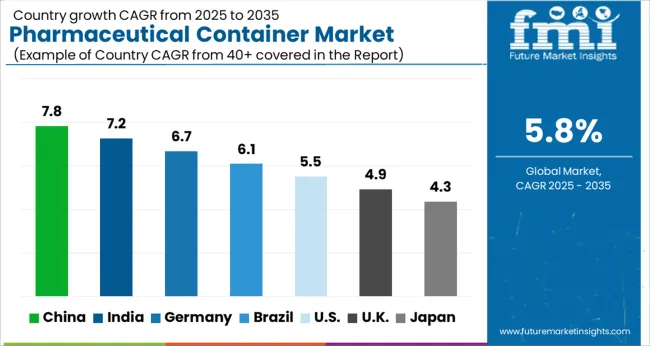
In the coming times, Asia Pacific is predicted to be the fastest growing market. The reason being increasing consumer awareness and initiatives taken by the governments. Apart from that, the increase in the disposable income of the general public would also increase the sales of pharmaceutical containers.
Find your sweet spots for generating winning opportunities in this market.
Talk to AnalystWho are Some of the Key Players in the Pharmaceutical Containers Market?
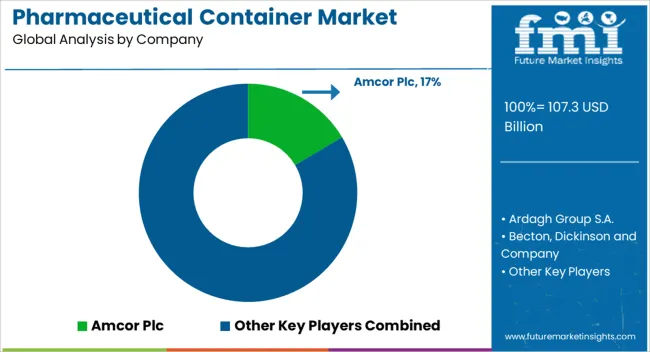
Some of the key players in the pharmaceutical containers market are Amcor plc; Becton Dickinson and Company; AptarGroup, Inc.; Drug Plastics Group; Gerresheimer AG; Schott AG; Owens Illinois, Inc.; West Pharmaceutical Services, Inc.; Berry Global, Inc.; WestRock Company; SGD Pharma; International Paper; Comar, LLC; CCL Industries, Inc.; Vetter Pharma International.
Report Scope
Report Attribute |
Details |
Growth Rate |
CAGR of 7.2% from 2022 to 2032 |
Base Year for Estimation |
2021 |
Historical Data |
2015-2021 |
Forecast Period |
2022-2032 |
Quantitative Units |
Revenue in USD Million, Volume in Kilotons and CAGR from 2022-2032 |
Report Coverage |
Revenue Forecast, Volume Forecast, Company Ranking, Competitive Landscape, Growth Factors, Trends and Pricing Analysis |
Segments Covered |
|
Regions Covered |
|
Key Countries Profiled |
|
Key Companies Profiled |
|
Customization |
Available Upon Request |

An unified Market Research Subscription Platform, built for today’s disparate research needs.
Key Segments Profiled in the Pharmaceutical Containers Market Survey
By Product:
- Bottles
- Standard
- Dispensing
- Jars
- Vials
- Cans
- IV Containers
- Semi Rigid IV Containers
- Premixed IV Mini bags
- Ampoules
- Others
By Material:
- Plastic
- PE
- LDPE
- HDPE
- Polystyrene
- Polycarbonate
- Polypropylene
- PVC
- PET
- Glass
- Type-1
- Type-2
- Type-3
- Others
By Region:
- North America
- Latin America
- Europe
- East Asia
- South Asia
- Oceania
- Middle East and Africa
Frequently Asked Questions
The pharmaceutical containers market is projected to grow at a CAGR of 7.2% during the forecast period (2022-2032).
The reason being increasing consumer awareness, initiatives taken by the governments, and increasing disposable income.
The pharmaceutical container market size is expected to be valued at around US$ 180.38 Billion in 2032
Table of Content
1. Executive Summary
1.1. Global Market Outlook
1.2. Demand Side Trends
1.3. Supply Side Trends
1.4. Analysis and Recommendations
2. Market Overview
2.1. Market Coverage / Taxonomy
2.2. Market Definition / Scope / Limitations
2.3. Inclusions/Exclusions
3. Key Market Trends
3.1. Key Trends Impacting the Market
3.2. Product modifications /Innovation
4. Key Success Factors
4.1. Strategic Developments
4.2. Key regulations
4.3. Product USPs /Technology
4.4. List of Manufacturers and Providers
5. Market Background
5.1. Macro-Economic Factors
5.1.1. Global GDP outlook
5.1.2. Increasing R&D Expenditure
5.2. Forecast Factors - Relevance & Impact
5.2.1. New Product launches
5.2.2. Cost of Products
5.3. Market Dynamics
5.3.1. Drivers
5.3.2. Restraints
5.3.3. Opportunity Analysis
6. COVID19 Crisis Analysis
6.1.1. Current COVID19 Statistics and Probable Future Impact
6.1.2. Current GDP Projection and Probable Impact
6.1.3. Current Economic Projection as Compared to 2008 Economic analysis
6.1.4. COVID19 and Impact Analysis
6.1.4.1. Revenue By Product
6.1.4.2. Revenue By Material
6.1.4.3. Revenue By Country
6.1.5. 2021 Market Scenario
6.1.6. Quarter by Quarter Forecast
6.1.7. Projected Recovery Quarter
7. Global Pharmaceutical Container Market Volume (Units) Analysis 2017-2021 and Forecast, 2022-2032
7.1. Historical Market Volume (Units) Analysis, 2017-2021
7.2. Current and Future Market Volume (Units) Projections, 2022-2032
7.2.1. Y-o-Y Growth Trend Analysis
8. Global Pharmaceutical Container Market - Pricing Analysis
8.1. Regional Pricing Analysis By Product
8.2. Pricing Break-up
8.2.1. Manufacturer Level Pricing
8.2.2. Distributor Level Pricing
8.3. Global Average Pricing Analysis Benchmark
9. Global Pharmaceutical Container Market Value Analysis 2017–2021 and Forecast, 2022-2032
9.1. Historical Market Value (US$ Mn) Analysis, 2017–2021
9.2. Current and Future Market Value (US$ Mn) Projections, 2022-2032
9.2.1. Y-o-Y Growth Trend Analysis
9.2.2. Absolute $ Opportunity Analysis
10. Global Pharmaceutical Container Market Analysis 2017–2021 and Forecast 2022-2032, by Product
10.1. Introduction / Key Findings
10.2. Historical Market Size (US$ Mn) Analysis By Products & Services, 2017–2021
10.3. Current and Future Market Size (US$ Mn) Analysis and Forecast By Product, 2022-2032
10.3.1. Bottles
10.3.2. Standard
10.3.3. Dispensing
10.3.4. Jars
10.3.5. Vials
10.3.6. Cans
10.3.7. IV Containers
10.3.8. Semi Rigid IV Containers
10.3.9. Premixed IV Mini bags
10.3.10. Ampoules
10.3.11. Others
10.4. Market Attractiveness Analysis By Product
11. Global Pharmaceutical Container Market Analysis 2017–2021 and Forecast 2022-2032, by Material
11.1. Introduction / Key Findings
11.2. Historical Market Size (US$ Mn) Analysis By Material , 2017–2021
11.3. Current and Future Market Size (US$ Mn) Analysis and Forecast By Material , 2022-2032
11.3.1. Plastic
11.3.2. PE
11.3.3. LDPE
11.3.4. HDPE
11.3.5. Polystyrene
11.3.6. Polycarbonate
11.3.7. Polypropylene
11.3.8. PVC
11.3.9. PET
11.3.10. Glass
11.3.11. Type-1
11.3.12. Type-2
11.3.13. Type-3
11.3.14. Others
11.4. Market Attractiveness Analysis By Material
12. Global Pharmaceutical Container Market Analysis 2017–2021 and Forecast 2022-2032, by Region
12.1. Introduction
12.2. Historical Market Size (US$ Mn) Analysis By Region, 2017–2021
12.3. Current Market Size (US$ Mn) Analysis and Forecast By Region, 2022-2032
12.3.1. North America
12.3.2. Latin America
12.3.3. Europe
12.3.4. East Asia
12.3.5. South Asia
12.3.6. Oceania
12.3.7. Middle East and Africa (MEA)
12.4. Market Attractiveness Analysis By Region
13. North America Pharmaceutical Container Market Analysis 2017–2021 and Forecast 2022-2032
13.1. Introduction
13.2. Historical Market Size (US$ Mn) Trend Analysis By Market Taxonomy, 2017–2021
13.3. Market Size (US$ Mn) Forecast By Market Taxonomy, 2022-2032
13.3.1. By Country
13.3.1.1. U.S.
13.3.1.2. Canada
13.3.2. By Product
13.3.3. By Material
13.4. Market Attractiveness Analysis
13.5. Key Market Participants - Intensity Mapping
13.6. Drivers and Restraints - Impact Analysis
14. Latin America Pharmaceutical Container Market Analysis 2017–2021 and Forecast 2022-2032
14.1. Introduction
14.2. Historical Market Size (US$ Mn) Trend Analysis By Market Taxonomy, 2017–2021
14.3. Market Size (US$ Mn) Forecast By Market Taxonomy, 2022-2032
14.3.1. By Country
14.3.1.1. Brazil
14.3.1.2. Mexico
14.3.1.3. Argentina
14.3.1.4. Rest of Latin America
14.3.2. By Product
14.3.3. By Material
14.4. Market Attractiveness Analysis
14.5. Key Market Participants - Intensity Mapping
14.6. Drivers and Restraints - Impact Analysis
15. Europe Pharmaceutical Container Market Analysis 2017–2021 and Forecast 2022-2032
15.1. Introduction
15.2. Historical Market Size (US$ Mn) Trend Analysis By Market Taxonomy, 2017–2021
15.3. Market Size (US$ Mn) Forecast By Market Taxonomy, 2022-2032
15.3.1. By Country
15.3.1.1. Germany
15.3.1.2. Italy
15.3.1.3. France
15.3.1.4. U.K.
15.3.1.5. Spain
15.3.1.6. Russia
15.3.1.7. Rest of Europe
15.3.2. By Product
15.3.3. By Material
15.4. Market Attractiveness Analysis
15.5. Key Market Participants - Intensity Mapping
15.6. Drivers and Restraints - Impact Analysis
16. South Asia Pharmaceutical Container Market Analysis 2017–2021 and Forecast 2022-2032
16.1. Introduction
16.2. Historical Market Size (US$ Mn) Trend Analysis By Market Taxonomy, 2017–2021
16.3. Market Size (US$ Mn) Forecast By Market Taxonomy, 2022-2032
16.3.1. By Country
16.3.1.1. India
16.3.1.2. Thailand
16.3.1.3. Indonesia
16.3.1.4. Malaysia
16.3.1.5. Rest of South Asia
16.3.2. By Product
16.3.3. By Material
16.4. Market Attractiveness Analysis
16.5. Key Market Participants - Intensity Mapping
16.6. Drivers and Restraints - Impact Analysis
17. East Asia Pharmaceutical Container Market Analysis 2017–2021 and Forecast 2022-2032
17.1. Introduction
17.2. Historical Market Size (US$ Mn) Trend Analysis By Market Taxonomy, 2017–2021
17.3. Market Size (US$ Mn) Forecast By Market Taxonomy, 2022-2032
17.3.1. By Country
17.3.1.1. China
17.3.1.2. Japan
17.3.1.3. South Korea
17.3.1.4. Rest of East Asia
17.3.2. By Product
17.3.3. By Material
17.4. Market Attractiveness Analysis
17.5. Key Market Participants - Intensity Mapping
17.6. Drivers and Restraints - Impact Analysis
18. Oceania Pharmaceutical Container Market Analysis 2017–2021 and Forecast 2022-2032
18.1. Introduction
18.2. Historical Market Size (US$ Mn) Trend Analysis By Market Taxonomy, 2017–2021
18.3. Market Size (US$ Mn) Forecast By Market Taxonomy, 2022-2032
18.3.1. By Country
18.3.1.1. Australia
18.3.1.2. New Zealand
18.3.2. By Product
18.3.3. By Material
18.4. Market Attractiveness Analysis
18.5. Key Market Participants - Intensity Mapping
18.6. Drivers and Restraints - Impact Analysis
19. Middle East and Africa Pharmaceutical Container Market Analysis 2017–2021 and Forecast 2022-2032
19.1. Introduction
19.2. Historical Market Size (US$ Mn) Trend Analysis By Market Taxonomy, 2017–2021
19.3. Market Size (US$ Mn) Forecast By Market Taxonomy, 2022-2032
19.3.1. By Country
19.3.1.1. GCC Countries
19.3.1.2. South Africa
19.3.1.3. Rest of Middle East and Africa
19.3.2. By Product
19.3.3. By Material
19.4. Market Attractiveness Analysis
19.5. Drivers and Restraints - Impact Analysis
20. Key and Emerging Countries Pharmaceutical Container Market Analysis 2017–2021 and Forecast 2022-2032
20.1. Introduction
20.1.1. Market Value Proportion Analysis, By Key Countries
20.1.2. Global Vs. Country Growth Comparison
20.2. U.S. Pharmaceutical Container Market Analysis
20.2.1. By Product
20.2.2. By Material
20.3. Canada Pharmaceutical Container Market Analysis
20.3.1. By Product
20.3.2. By Material
20.4. Mexico Pharmaceutical Container Market Analysis
20.4.1. By Product
20.4.2. By Material
20.5. Brazil Pharmaceutical Container Market Analysis
20.5.1. By Product
20.5.2. By Material
20.6. U.K. Pharmaceutical Container Market Analysis
20.6.1. By Product
20.6.2. By Material
20.7. Germany Pharmaceutical Container Market Analysis
20.7.1. By Product
20.7.2. By Material
20.8. France Pharmaceutical Container Market Analysis
20.8.1. By Product
20.8.2. By Material
20.9. Italy Pharmaceutical Container Market Analysis
20.9.1. By Product
20.9.2. By Material
20.10. Spain Pharmaceutical Container Market Analysis
20.10.1. By Product
20.10.2. By Material
20.11. BENELUX Pharmaceutical Container Market Analysis
20.11.1. By Product
20.11.2. By Material
20.12. Russia Pharmaceutical Container Market Analysis
20.12.1. By Product
20.12.2. By Material
20.13. China Pharmaceutical Container Market Analysis
20.13.1. By Product
20.13.2. By Material
20.14. Japan Pharmaceutical Container Market Analysis
20.14.1. By Product
20.14.2. By Material
20.15. South Korea Pharmaceutical Container Market Analysis
20.15.1. By Product
20.15.2. By Material
20.16. India Pharmaceutical Container Market Analysis
20.16.1. By Product
20.16.2. By Material
20.17. ASEAN Pharmaceutical Container Market Analysis
20.17.1. By Product
20.17.2. By Material
20.18. Australia Pharmaceutical Container Market Analysis
20.18.1. By Product
20.18.2. By Material
20.19. New Zealand Pharmaceutical Container Market Analysis
20.19.1. By Product
20.19.2. By Material
20.20. GCC Countries Pharmaceutical Container Market Analysis
20.20.1. By Product
20.20.2. By Material
20.21. Turkey Pharmaceutical Container Market Analysis
20.21.1. By Product
20.21.2. By Material
20.22. South Africa Pharmaceutical Container Market Analysis
20.22.1. By Product
20.22.2. By Material
21. Market Structure Analysis
21.1. Market Analysis by Tier of Companies
21.2. Market Concentration
21.3. Market Share Analysis of Top Players
21.4. Market Presence Analysis
21.4.1. By Regional footprint of Players
21.4.2. Product foot print by Players
21.4.3. Channel Foot Print by Players
22. Competition Analysis
22.1. Competition Dashboard
22.2. Competition Benchmarking
22.3. Competition Deep dive
22.3.1. Amcor PLC
22.3.1.1. Overview
22.3.1.2. Product Portfolio
22.3.1.3. Profitability by Market Segments (Product/Channel/Region)
22.3.1.4. Sales Footprint
22.3.1.5. Strategy Overview
22.3.2. Becton, Dickinson, and Company
22.3.2.1. Overview
22.3.2.2. Product Portfolio
22.3.2.3. Profitability by Market Segments (Product/Channel/Region)
22.3.2.4. Sales Footprint
22.3.2.5. Strategy Overview
22.3.3. AptarGroup, Inc.
22.3.3.1. Overview
22.3.3.2. Product Portfolio
22.3.3.3. Profitability by Market Segments (Product/Channel/Region)
22.3.3.4. Sales Footprint
22.3.3.5. Strategy Overview
22.3.4. Drug Plastics Group
22.3.4.1. Overview
22.3.4.2. Product Portfolio
22.3.4.3. Profitability by Market Segments (Product/Channel/Region)
22.3.4.4. Sales Footprint
22.3.4.5. Strategy Overview
22.3.5. Gerresheimer AG
22.3.5.1. Overview
22.3.5.2. Product Portfolio
22.3.5.3. Profitability by Market Segments (Product/Channel/Region)
22.3.5.4. Sales Footprint
22.3.5.5. Strategy Overview
22.3.6. Schott AG
22.3.6.1. Overview
22.3.6.2. Product Portfolio
22.3.6.3. Profitability by Market Segments (Product/Channel/Region)
22.3.6.4. Sales Footprint
22.3.6.5. Strategy Overview
22.3.7. Owens Illinois, Inc.
22.3.7.1. Overview
22.3.7.2. Product Portfolio
22.3.7.3. Profitability by Market Segments (Product/Channel/Region)
22.3.7.4. Sales Footprint
22.3.7.5. Strategy Overview
22.3.8. West Pharmaceutical Services, Inc.
22.3.8.1. Overview
22.3.8.2. Product Portfolio
22.3.8.3. Profitability by Market Segments (Product/Channel/Region)
22.3.8.4. Sales Footprint
22.3.8.5. Strategy Overview
22.3.9. Berry Global, Inc.
22.3.9.1. Overview
22.3.9.2. Product Portfolio
22.3.9.3. Profitability by Market Segments (Product/Channel/Region)
22.3.9.4. Sales Footprint
22.3.9.5. Strategy Overview
22.3.10. WestRock Company
22.3.10.1. Overview
22.3.10.2. Product Portfolio
22.3.10.3. Profitability by Market Segments (Product/Channel/Region)
22.3.10.4. Sales Footprint
22.3.10.5. Strategy Overview
22.3.11. SGD Pharma
22.3.11.1. Overview
22.3.11.2. Product Portfolio
22.3.11.3. Profitability by Market Segments (Product/Channel/Region)
22.3.11.4. Sales Footprint
22.3.11.5. Strategy Overview
22.3.12. International Paper
22.3.12.1. Overview
22.3.12.2. Product Portfolio
22.3.12.3. Profitability by Market Segments (Product/Channel/Region)
22.3.12.4. Sales Footprint
22.3.12.5. Strategy Overview
22.3.13. Comar, LLC
22.3.13.1. Overview
22.3.13.2. Product Portfolio
22.3.13.3. Profitability by Market Segments (Product/Channel/Region)
22.3.13.4. Sales Footprint
22.3.13.5. Strategy Overview
22.3.14. CCL Industries, Inc.
22.3.14.1. Overview
22.3.14.2. Product Portfolio
22.3.14.3. Profitability by Market Segments (Product/Channel/Region)
22.3.14.4. Sales Footprint
22.3.14.5. Strategy Overview
22.3.15. Vetter Pharma International
22.3.15.1. Overview
22.3.15.2. Product Portfolio
22.3.15.3. Profitability by Market Segments (Product/Channel/Region)
22.3.15.4. Sales Footprint
22.3.15.5. Strategy Overview
23. Assumptions and Acronyms Used
24. Research Methodology
Let us know your requirement to get
100% FREE customization
List of Tables
Table 01: Global Pharmaceutical Container Market Volume (‘000 Units) Analysis and Opportunity Assessment 2017–2032, By Product
Table 02: Global Pharmaceutical Container Market Value (US$ Mn) Analysis and Opportunity Assessment 2017–2032, By Product
Table 03: Global Pharmaceutical Container Market Value (US$ Mn) Analysis and Opportunity Assessment 2017–2032, By Material
Table 04: Global Pharmaceutical Container Market Value (US$ Mn) Analysis and Opportunity Assessment 2017–2032, By Region
Table 05: North America Pharmaceutical Container Market Value (US$ Mn) Analysis 2017-2021 and Forecast 2022–2032, By Country
Table 06: North America Pharmaceutical Container Market Value (US$ Mn) Analysis and Opportunity Assessment 2017–2032, By Product
Table 07: North America Pharmaceutical Container Market Value (US$ Mn) Analysis and Opportunity Assessment 2017–2032, By Material
Table 08: Latin America Pharmaceutical Container Market Value (US$ Mn) Analysis 2017-2021 and Forecast 2022–2032, By Country
Table 09: Latin America Pharmaceutical Container Market Value (US$ Mn) Analysis and Opportunity Assessment 2017–2032, By Product
Table 10: Latin America Pharmaceutical Container Market Value (US$ Mn) Analysis and Opportunity Assessment 2017–2032, By Material
Table 11: Europe Pharmaceutical Container Market Value (US$ Mn) Analysis 2017-2021 and Forecast 2022–2032, By Country
Table 12: Europe Pharmaceutical Container Market Value (US$ Mn) Analysis and Opportunity Assessment 2017–2032, By Product
Table 13: Europe Pharmaceutical Container Market Value (US$ Mn) Analysis and Opportunity Assessment 2017–2032, By Material
Table 14: South Asia Pharmaceutical Container Market Value (US$ Mn) Analysis 2017-2021 and Forecast 2022–2032, By Country
Table 15: South Asia Pharmaceutical Container Market Value (US$ Mn) Analysis and Opportunity Assessment 2017–2032, By Product
Table 16: South Asia Pharmaceutical Container Market Value (US$ Mn) Analysis and Opportunity Assessment 2017–2032, By Material
Table 17: East Asia Pharmaceutical Container Market Value (US$ Mn) Analysis 2017-2021 and Forecast 2022–2032, By Country
Table 18: East Asia Pharmaceutical Container Market Value (US$ Mn) Analysis and Opportunity Assessment 2017–2032, By Product
Table 19: East Asia Pharmaceutical Container Market Value (US$ Mn) Analysis and Opportunity Assessment 2017–2032, By Material
Table 20: Oceania Pharmaceutical Container Market Value (US$ Mn) Analysis 2017-2021 and Forecast 2022–2032, By Country
Table 21: Oceania Pharmaceutical Container Market Value (US$ Mn) Analysis and Opportunity Assessment 2017–2032, By Product
Table 22: Oceania Pharmaceutical Container Market Value (US$ Mn) Analysis and Opportunity Assessment 2017–2032, By Material
Table 23: Middle East and Africa Pharmaceutical Container Market Value (US$ Mn) Analysis 2017-2021 and Forecast 2022–2032, By Country
Table 24: Middle East and Africa Pharmaceutical Container Market Value (US$ Mn) Analysis and Opportunity Assessment 2017–2032, By Product
Table 25: Middle East and Africa Pharmaceutical Container Market Value (US$ Mn) Analysis and Opportunity Assessment 2017–2032, By Material
Find your sweet spots for generating winning opportunities in this market.
Talk to AnalystList of Charts
Figure 01: Global Pharmaceutical Container Market Volume (in 000' Units) Analysis, 2017-2021
Figure 02: Global Pharmaceutical Container Market Volume Forecast (in 000' Units), 2022-2032
Figure 03: Pharmaceutical Container Pricing Analysis (US$) Per Product, By Region, 2021
Figure 04: Pharmaceutical Container Pricing Analysis (US$) Per Product, By Region, 2021
Figure 05: Global Pharmaceutical Container Market Value Analysis (US$ Mn), 2017-2021
Figure 06: Global Pharmaceutical Container Market Value Forecast (US$ Mn), 2022-2032
Figure 07: Global Pharmaceutical Container Market Absolute $ Opportunity, 2022-2032
Figure 08: Global Pharmaceutical Container Market Share Analysis (%), By Product, 2022-2032
Figure 09: Global Pharmaceutical Container Market Y-o-Y Analysis (%), By Product, 2022-2032
Figure 10: Global Pharmaceutical Container Market Attractiveness Analysis by Product, 2022-2032
Figure 11: Global Pharmaceutical Container Market Share Analysis (%), By Material, 2022-2032
Figure 12: Global Pharmaceutical Container Market Y-o-Y Analysis (%), By Material, 2022-2032
Figure 13: Global Pharmaceutical Container Market Attractiveness Analysis by Material, 2022-2032
Figure 14: Global Pharmaceutical Container Market Share Analysis (%), By Region, 2022-2032
Figure 15: Global Pharmaceutical Container Market Y-o-Y Analysis (%), By Region, 2022-2032
Figure 16: Global Pharmaceutical Container Market Attractiveness Analysis by Region, 2022-2032
Figure 17: North America Pharmaceutical Container Market Value Share, By Product, 2022 (E)
Figure 18: North America Pharmaceutical Container Market Value Share, By Material, 2022 (E)
Figure 19: North America Pharmaceutical Container Market Value Share, By Country, 2022 (E)
Figure 20: North America Pharmaceutical Container Market Value Analysis (US$ Mn), 2017-2021
Figure 21: North America Pharmaceutical Container Market Value Forecast (US$ Mn), 2022-2032
Figure 22: North America Pharmaceutical Container Market Attractiveness Analysis by Product, 2022-2032
Figure 23: North America Pharmaceutical Container Market Attractiveness Analysis by Material, 2022-2032
Figure 24: North America Pharmaceutical Container Market Attractiveness Analysis by Country, 2022-2032
Figure 25: Latin America Pharmaceutical Container Market Value Share, By Product, 2022 (E)
Figure 26: Latin America Pharmaceutical Container Market Value Share, By Material, 2022 (E)
Figure 27: Latin America Pharmaceutical Container Market Value Share, By Country, 2022 (E)
Figure 28: Latin America Pharmaceutical Container Market Value Analysis (US$ Mn), 2017-2021
Figure 29: Latin America Pharmaceutical Container Market Value Forecast (US$ Mn), 2022-2032
Figure 30: Latin America Pharmaceutical Container Market Attractiveness Analysis by Product, 2022-2032
Figure 31: Latin America Pharmaceutical Container Market Attractiveness Analysis by Material, 2022-2032
Figure 32: Latin America Pharmaceutical Container Market Attractiveness Analysis by Country, 2022-2032
Figure 33: Europe Pharmaceutical Container Market Value Share, By Product, 2022 (E)
Figure 34: Europe Pharmaceutical Container Market Value Share, By Material, 2022 (E)
Figure 35: Europe Pharmaceutical Container Market Value Share, By Country, 2022 (E)
Figure 36: Europe Pharmaceutical Container Market Value Analysis (US$ Mn), 2017-2021
Figure 37: Europe Pharmaceutical Container Market Value Forecast (US$ Mn), 2022-2032
Figure 38: Europe Pharmaceutical Container Market Attractiveness Analysis by Product, 2022-2032
Figure 39: Europe Pharmaceutical Container Market Attractiveness Analysis by Material, 2022-2032
Figure 40: Europe Pharmaceutical Container Market Attractiveness Analysis by Country, 2022-2032
Figure 41: South Asia Pharmaceutical Container Market Value Share, By Product, 2022 (E)
Figure 42: South Asia Pharmaceutical Container Market Value Share, By Material, 2022 (E)
Figure 43: South Asia Pharmaceutical Container Market Value Share, By Country, 2022 (E)
Figure 44: South Asia Pharmaceutical Container Market Value Analysis (US$ Mn), 2017-2021
Figure 45: South Asia Pharmaceutical Container Market Value Forecast (US$ Mn), 2022-2032
Figure 46: South Asia Pharmaceutical Container Market Attractiveness Analysis by Product, 2022-2032
Figure 47: South Asia Pharmaceutical Container Market Attractiveness Analysis by Material, 2022-2032
Figure 48: South Asia Pharmaceutical Container Market Attractiveness Analysis by Country, 2022-2032
Figure 49: East Asia Pharmaceutical Container Market Value Share, By Product, 2022 (E)
Figure 50: East Asia Pharmaceutical Container Market Value Share, By Material, 2022 (E)
Figure 51: East Asia Pharmaceutical Container Market Value Share, By Country, 2022 (E)
Figure 52: East Asia Pharmaceutical Container Market Value Analysis (US$ Mn), 2017-2021
Figure 53: East Asia Pharmaceutical Container Market Value Forecast (US$ Mn), 2022-2032
Figure 54: East Asia Pharmaceutical Container Market Attractiveness Analysis by Product, 2022-2032
Figure 55: East Asia Pharmaceutical Container Market Attractiveness Analysis by Material, 2022-2032
Figure 56: East Asia Pharmaceutical Container Market Attractiveness Analysis by Country, 2022-2032
Figure 57: Oceania Pharmaceutical Container Market Value Share, By Product, 2022 (E)
Figure 58: Oceania Pharmaceutical Container Market Value Share, By Material, 2022 (E)
Figure 59: Oceania Pharmaceutical Container Market Value Share, By Country, 2022 (E)
Figure 60: Oceania Pharmaceutical Container Market Value Analysis (US$ Mn), 2017-2021
Figure 61: Oceania Pharmaceutical Container Market Value Forecast (US$ Mn), 2022-2032
Figure 62: Oceania Pharmaceutical Container Market Attractiveness Analysis by Product, 2022-2032
Figure 63: Oceania Pharmaceutical Container Market Attractiveness Analysis by Material, 2022-2032
Figure 64: Oceania Pharmaceutical Container Market Attractiveness Analysis by Country, 2022-2032
Figure 65: Middle East and Africa Pharmaceutical Container Market Value Share, By Product, 2022 (E)
Figure 66: Middle East and Africa Pharmaceutical Container Market Value Share, By Material, 2022 (E)
Figure 67: Middle East and Africa Pharmaceutical Container Market Value Share, By Country, 2022 (E)
Figure 68: Middle East and Africa Pharmaceutical Container Market Value Analysis (US$ Mn), 2017-2021
Figure 69: Middle East and Africa Pharmaceutical Container Market Value Forecast (US$ Mn), 2022-2032
Figure 70: Middle East and Africa Pharmaceutical Container Market Attractiveness Analysis by Product, 2022-2032
Figure 71: Middle East and Africa Pharmaceutical Container Market Attractiveness Analysis by Material, 2022-2032
Figure 72: Middle East and Africa Pharmaceutical Container Market Attractiveness Analysis by Country, 2022-2032
Figure 73: U. S. Pharmaceutical Container Market Value Analysis (US$ Mn), 2022 & 2032
Figure 74: U. S. Pharmaceutical Container Market Value Share, By Product, 2022 (E)
Figure 75: U. S. Pharmaceutical Container Market Value Share, By Material, 2022 (E)
Figure 76: Canada Pharmaceutical Container Market Value Analysis (US$ Mn), 2022 & 2032
Figure 77: Canada Pharmaceutical Container Market Value Share, By Product, 2022 (E)
Figure 78: Canada Pharmaceutical Container Market Value Share, By Material, 2022 (E)
Figure 79: Mexico Pharmaceutical Container Market Value Analysis (US$ Mn), 2022 & 2032
Figure 80: Mexico Pharmaceutical Container Market Value Share, By Product, 2022 (E)
Figure 81: Mexico Pharmaceutical Container Market Value Share, By Material, 2022 (E)
Figure 82: Brazil Pharmaceutical Container Market Value Analysis (US$ Mn), 2022 & 2032
Figure 83: Brazil Pharmaceutical Container Market Value Share, By Product, 2022 (E)
Figure 84: Brazil Pharmaceutical Container Market Value Share, By Material, 2022 (E)
Figure 85: U. K. Pharmaceutical Container Market Value Analysis (US$ Mn), 2022 & 2032
Figure 86: U. K. Pharmaceutical Container Market Value Share, By Product, 2022 (E)
Figure 87: U. K. Pharmaceutical Container Market Value Share, By Material, 2022 (E)
Figure 88: Germany Pharmaceutical Container Market Value Analysis (US$ Mn), 2022 & 2032
Figure 89: Germany Pharmaceutical Container Market Value Share, By Product, 2022 (E)
Figure 90: Germany Pharmaceutical Container Market Value Share, By Material, 2022 (E)
Figure 91: France Pharmaceutical Container Market Value Analysis (US$ Mn), 2022 & 2032
Figure 92: France Pharmaceutical Container Market Value Share, By Product, 2022 (E)
Figure 93: France Pharmaceutical Container Market Value Share, By Material, 2022 (E)
Figure 94: Italy Pharmaceutical Container Market Value Analysis (US$ Mn), 2022 & 2032
Figure 95: Italy Pharmaceutical Container Market Value Share, By Product, 2022 (E)
Figure 96: Italy Pharmaceutical Container Market Value Share, By Material, 2022 (E)
Figure 97: Spain Pharmaceutical Container Market Value Analysis (US$ Mn), 2022 & 2032
Figure 98: Spain Pharmaceutical Container Market Value Share, By Product, 2022 (E)
Figure 99: Spain Pharmaceutical Container Market Value Share, By Material, 2022 (E)
Figure 100: Russia Pharmaceutical Container Market Value Analysis (US$ Mn), 2022 & 2032
Figure 101: Russia Pharmaceutical Container Market Value Share, By Product, 2022 (E)
Figure 102: Russia Pharmaceutical Container Market Value Share, By Material, 2022 (E)
Figure 103: China Pharmaceutical Container Market Value Analysis (US$ Mn), 2022 & 2032
Figure 104: China Pharmaceutical Container Market Value Share, By Product, 2022 (E)
Figure 105: China Pharmaceutical Container Market Value Share, By Material, 2022 (E)
Figure 106: Japan Pharmaceutical Container Market Value Analysis (US$ Mn), 2022 & 2032
Figure 107: Japan Pharmaceutical Container Market Value Share, By Product, 2022 (E)
Figure 108: Japan Pharmaceutical Container Market Value Share, By Material, 2022 (E)
Figure 109: South Korea Pharmaceutical Container Market Value Analysis (US$ Mn), 2022 & 2032
Figure 110: South Korea Pharmaceutical Container Market Value Share, By Product, 2022 (E)
Figure 111: South Korea Pharmaceutical Container Market Value Share, By Material, 2022 (E)
Figure 112: India Pharmaceutical Container Market Value Analysis (US$ Mn), 2022 & 2032
Figure 113: India Pharmaceutical Container Market Value Share, By Product, 2022 (E)
Figure 114: India Pharmaceutical Container Market Value Share, By Material, 2022 (E)
Figure 115: ASEAN Pharmaceutical Container Market Value Analysis (US$ Mn), 2022 & 2032
Figure 116: ASEAN Pharmaceutical Container Market Value Share, By Product, 2022 (E)
Figure 117: ASEAN Pharmaceutical Container Market Value Share, By Material, 2022 (E)
Figure 118: Australia Pharmaceutical Container Market Value Analysis (US$ Mn), 2022 & 2032
Figure 119: Australia Pharmaceutical Container Market Value Share, By Product, 2022 (E)
Figure 120: Australia Pharmaceutical Container Market Value Share, By Material, 2022 (E)
Figure 121: New Zealand Pharmaceutical Container Market Value Analysis (US$ Mn), 2022 & 2032
Figure 122: New Zealand Pharmaceutical Container Market Value Share, By Product, 2022 (E)
Figure 123: New Zealand Pharmaceutical Container Market Value Share, By Material, 2022 (E)
Figure 124: GCC Countries Pharmaceutical Container Market Value Analysis (US$ Mn), 2022 & 2032
Figure 125: GCC Countries Pharmaceutical Container Market Value Share, By Product, 2022 (E)
Figure 126: GCC Countries Pharmaceutical Container Market Value Share, By Material, 2022 (E)
Figure 127: Turkey Pharmaceutical Container Market Value Analysis (US$ Mn), 2022 & 2032
Figure 128: Turkey Pharmaceutical Container Market Value Share, By Product, 2022 (E)
Figure 129: Turkey Pharmaceutical Container Market Value Share, By Material, 2022 (E)
Figure 130: South Africa Pharmaceutical Container Market Value Analysis (US$ Mn), 2022 & 2032
Figure 131: South Africa Pharmaceutical Container Market Value Share, By Product, 2022 (E)
Figure 132: South Africa Pharmaceutical Container Market Value Share, By Material, 2022 (E)
Need specific information?
Request CustomizationExplore Packaging Insights
View Reports