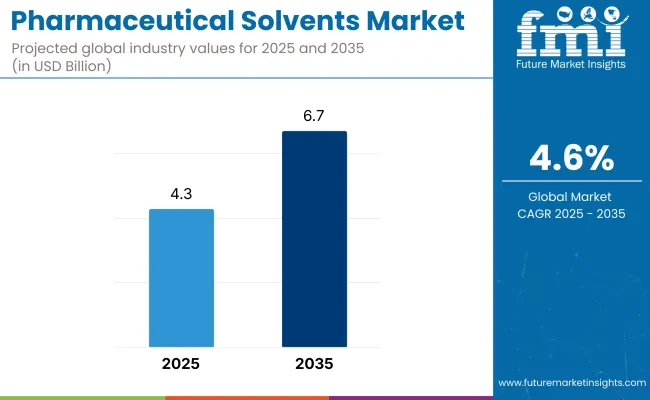
The pharmaceutical solvents market is slated to increase modestly, growing to an estimated industry size of USD 4.3 billion in 2025 and likely to reach a valuation of USD 6.7 billion in 2035, at a CAGR of 4.6%. Solvents are ubiquitous in drug formulating, manufacture, purification, and stability improvements in pharmaceutical usage.
Industry is driven mainly by growing manufacturing of biologics and generics, which both require precision-formulated solvents to maintain stability and functionality. Solvents such as acetone, polyethylene glycol, isopropanol, and ethanol find extensive use with their reliability, purity, and regulatory compliance for use in all drug delivery modalities.Injectable and parenteral presentations are a major growth driver.
Solvents provide solubility and sterility in these products, particularly in biologics and biosimilars. With the increasing incidence of chronic disease and the need for personalized, rapidly acting therapeutics, solvent consumption in complex injectables will grow in a big way.
Solvents are also utilized during API synthesis and purification, performing a critical function in separating and purifying complex molecules. Solvent recycling, green chemistry practices, and high-purity formulations are increasingly gaining prominence in maintaining sustainability as well as cost-effectiveness in pharma production.In spite of these, the industry is limited by environmental and health legislation.
Many organic solvents fall under the category of volatile organic compounds (VOCs) and are regulated by strict emission standards. Low-toxicity, biodegradable, and eco-friendly substitutes of solvents are being utilized by manufacturers in an attempt to keep pace with global environmental legislation.
Improvement in technology is facilitating the implementation of continuous manufacturing, closed-loop solvent systems, and solvent recovery technology, and ensuring minimal wastage. All these technologies are helping pharmaceutical corporations to reduce their cost of doing business as well as their green footprints.
North America and Europe lead the industry for pharmaceutical solvents due to strong R&D, biologics production, and regulatory infrastructures. Asia Pacific is also witnessing rapid growth, particularly in China and India, where generic medicines production and contract manufacturing are growing rapidly.
Market Metrics
| Metrics | Value s |
|---|---|
| Industry Size (2025E) | USD 4.3 billion |
| Industry Value (2035F) | USD 6.7 billion |
| CAGR (2025 to 2035) | 4.6% |
The industry is transforming radically, spurred by global pharmaceutical production growth, improved formulations of drugs, and growing demand for high-purity, regulatory-compliant solvents utilized in advanced manufacturing operations.
Trends across the industry toward greener, safer solvents and stricter governmental regulations also are fueling innovation and deployment of cleaner, biocompatible solvent systems.These solvents play a central role in synthesis, purification, and drug delivery, and the quality and performance of them are consequently at the very center of pharmaceutical R&D and commercial manufacturing.
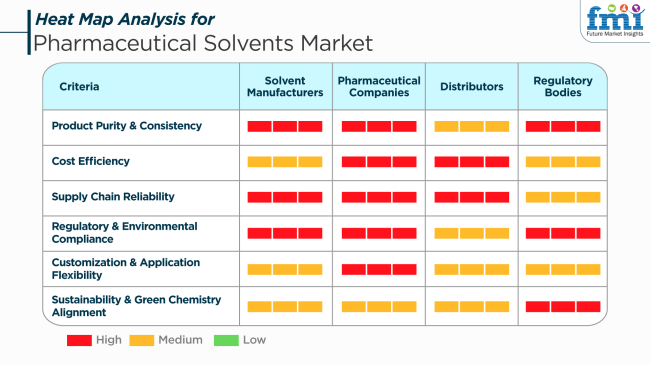
Pharmaceutical companies are the primary customers, utilizing solvents in active pharmaceutical ingredient (API) synthesis, formulation, and quality control processes. They care primarily about performance, safety, cost-effectiveness, and the ability to produce increasingly high global standards.
Regulatory Authorities are at the heart of this industry, placing strict controls on residual solvent levels, environmental releases, and employee protection. These restrictions catalyze innovation and shape purchasing decisions, with low-toxicity and environmentally friendly solvent solutions being preferred.
During 2020 to 2024, the industry was on a steady rise due to rising demand for pharmaceuticals and improvements in drug delivery systems. Various factors, including the increased incidence of chronic conditions, the augmented spending on healthcare, and the growth of the pharmaceutical industry in developing economies, had an impact on the industry. However, concerns of tight regulatory control, environmental issues, and volatile raw material cost fluctuations posed barriers to growth in the industry during this period.
In the future, between 2025 and 2035, the industry will likely undergo radical changes, fueled by technological advancement, population dynamics, and evolving industry needs. As more emphasis is given to eco-friendly, sustainable behavior, the demand is anticipated to favor green solvents, and there will be a tendency towards formulations and manufacturing processes of solvents.
Also, expansion in the application of personalized medicine and biologics is anticipated to create new opportunities for pharmaceutical solvents, as such treatments often require individualized solvents for delivery and formulation. Rising healthcare infrastructure growth in emerging industries will also drive industry growth, offering a larger patient base and boosting the demand for pharmaceutical products.
Comparative Market Shift Analysis 2020 to 2024 vs. 2025 to 2035
| 2020 to 2024 | 2025 to 2035 |
|---|---|
| Sustained growth owing to improved demand for pharma products. | Accelerated growth driven by improvement in drug delivery systems and personalized medicine. |
| Onset of chronic diseases, improving healthcare infrastructure, and rising pharmaceutical manufacturing. | Move toward sustainable practices, adoption of biologics, and increasing availability of healthcare in emerging industrie s. |
| Increased focus on enhancing solvent efficiency and minimizing environmental footprint. | Emergence of green solvents, new formulation technologies, and improved biologic drug delivery. |
| Increased industry growth in emerging industrie s with growing healthcare infrastructure. | Further growth in the emerging industrie s, including greater access to healthcare and pharmaceutical products. |
| Enforcement of strict regulations regarding the use of solvents and environmental effects. | Greater emphasis on sustainability and environmentally friendly practices in solvent production and use. |
| Emergence of new solvent formulations that are more efficient and less toxic. | Creation of targeted solvents for biologics and personalized medicine use. |
In 2024, the industry was approximately USD 4.02 billion. Price volatilities in raw materials, particularly for pharmaceutical solvents like ethanol and propylene glycol, can play a huge role in affecting the cost of production and profit margins for producers. Strict environmental and safety regulations pose huge risks to business.
Responding to changing local standards requires continuing vigilance and sensitivity. Failing compliance has the possibility to attract legal sanctions and eroded brand image affecting industry position and consumer trust.
Supply chain breakdowns, for example, transit delays or politically strained situations, may extend delays in delivery of raw material as well as end product. The disruptions can lead to plant shutdowns and lost customer demand, adversely affecting sales and long-term business relationships.
The industry is faced with increased competition and technological innovations. Companies must invest in research and development in order to innovate and continually improve product offerings. Inability to do so can lead to obsolescence and loss of industry share to nimbler competitors.
Reliance on leading industries including pharmaceuticals and biotechnology implies that dips in these areas can directly affect demand. Diversifying customer base across multiple applications can counteract the risk.
In brief terms, the industry is susceptible to raw material price fluctuations, regulation, supply chain disruptions, technology changes, and industry-specific economic downturns. Precautions against all such eventualities are necessary to enable sustained growth and competitiveness of this dynamic industry.
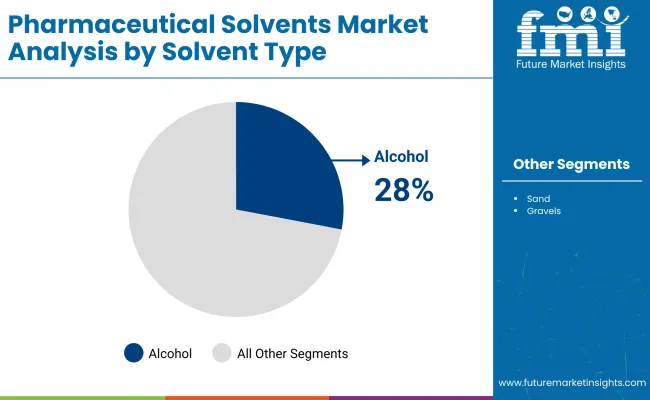
In 2025, 28% of the total industry will be dominated by the alcohol segment, followed closely by the esters segment with a 24% share.
Alcohols predominate owing to their versatile applications in pharmaceutical formulations. Ethanol, isopropanol, and other alcohols are commonly used as solvents in the manufacture of oral, topical, and injectable pharmaceutical products. High water solubility, low toxicity, and the ability to dissolve almost all drug ingredients are placed as key criteria for a solvent in drug development and production.
Also, cleaning and disinfecting purposes further support the demand for alcohol in pharmaceuticals. Major players in the pharmaceutical industry, including Pfizer, Bristol Myers Squibb, and Johnson & Johnson, have heavy reliance on alcohol for their formulation processes.
Holding onto its 24% industry share in this sector, the Esters segment is also of significant importance in the pharmaceutical industry. Esters formulated by solvents are frequently employed for dissolving or stabilizing compounds, as the solvents in the formulation of different drugs are used to prepare their final dosage forms.
Ethyl acetate and butyl acetate are ester solvents that are often used in pharmaceutical coatings and are an integral part of controlled-release drug delivery systems. The versatility of esters and the property to improve the bioavailability of drugs are other invaluable applications of esters in the industry. Some top-notch pharmaceutical companies that are known for ester-based solvent applications include Merck, Novartis, and Sanofi.
As both segments seek to expand even further, more innovations in pharmaceuticals will stimulate the demand for both alcohols and esters in drug delivery systems and the development of new drugs.
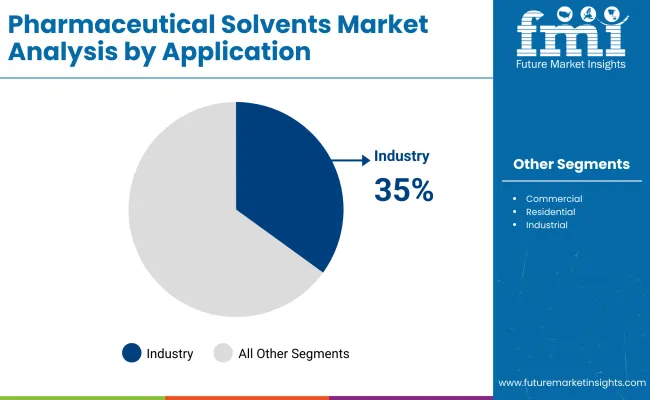
The industry will be dominated by the APIs synthesis segment in 2025, accounting for 35% of the industry share, followed by excipients manufacturing, with a share of around 25%.
The API synthesis (active pharmaceutical ingredients synthesis) segment leads the industry because it is undeniably true that solvents play an important role in the synthesis of APIs. It is because solvents act, among other things, as raw materials and active compound extractors, separators, purifiers, and the backbone on which active compounds are created into dosage forms through extraction, separation, and purification within the process of producing APIs.
In the continuous use of the newest and improved pharmaceutical products, strong solvents will be required in API synthesis. Companies like Roche, GlaxoSmithKline, and AstraZeneca are some of the main players fueling the need as they further develop newer innovative APIs for treatment across a range of potential therapeutic areas.
Excipients manufacturing, having a subsequent 25% industry share, follows it. Formerly, Excipients are things that aren't therapeutically active in a pharmaceutical product but are included with it, such as a tablet or capsule, to act as a binder, filler, stabilizer, or preservative. Thus, the excipient would need proper solvent selection for large-scale manufacture.
The main solvents used in the production of excipients include alcohols and esters that combine, granulate, and form products. Increasingly, companies such as BASF, Evonik Industries, and Dow are focusing on providing high-quality excipients in the drug formulation process, given the changing landscape in the use of oral solid dosage forms.
Both segments will grow from advances in the research and development of pharmaceuticals and the global demand for medicines.
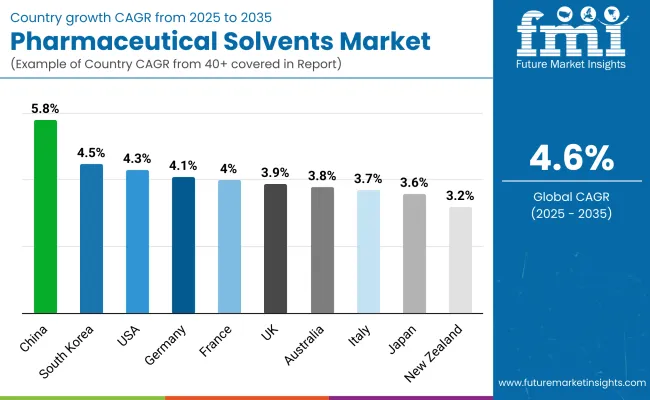
| Countries | CAGR (2025 to 2035) |
|---|---|
| USA | 4.3% |
| UK | 3.9% |
| France | 4% |
| Germany | 4.1% |
| Italy | 3.7% |
| South Korea | 4.5% |
| Japan | 3.6% |
| China | 5.8% |
| Australia | 3.8% |
| New Zealand | 3.2% |
The USA industry is expected to grow at a CAGR of 4.3% from the 2025 to 2035 forecast period. Strong demand for pharmaceutical manufacturing, supported by sustained innovation in drug formulation, synthesis, and biotechnology, is the primary growth driver. Solvents play a critical role in active pharmaceutical ingredient (API) manufacturing and purification.
Large chemical firms are investing in research to produce high-purity, low-toxicity solvents tailored specifically for controlled drug environments. Solvent safety, residual limits and green chemistry are driving regulatory interest and product development. Demand for solvents such as ethanol, methanol, acetone, and ethyl acetate continues to be strong, particularly in sterile and injectable forms of drugs.
The UKindustry is projected to grow in 2025 to 2035 at a CAGR of 3.9%. Pharmaceutical R&D facilities in the nation continue to be strong, supporting the increase in the industry, which is driven by constant demand during the production of generic and branded drugs. Solvent utilization is concentrated in synthesis, crystallization, and formulation processes.
Domestic and multinational producers are keen on higher solvent purity profiles and lower environmental impact through recycling facilities for solvents. MHRA and regulation-based compliance originated in the EU, ensuring quality and safety. Greener production processes are leading to the application of environment-friendly solvents and bio-based solvents.
France is likely to record a CAGR of 4% in the industry in 2035. The sector is supported by a broad spectrum of pharmaceutical activity, such as contract development and manufacturing organizations (CDMOs). Solvents are crucial in the API synthesis and blending of excipients, as well as downstream process steps.
French industry is applying process optimization to reduce solvent waste and enhance the safety of chemical processing. Sustainability and compliance with EU REACH and pharmacopoeial requirements are leading to solvent selection. Bio-based solvents and recovery systems are gaining popularity among pharmaceutical production facilities in search of reduced environmental footprints.
Germany's industry is expected to record a CAGR of 4.1% between 2025 and 2035. Germany's highly developed chemical and pharmaceutical manufacturing industries require a broad range of solvents both for research and manufacturing. Solvents are extensively used in synthesis reactions, extractions, and sterilization.
German producers are prioritizing low-residual toxicity, high-purity solvents for injectable and high-potency drug uses. Increased focus on GMP compliance and process safety is driving solvent management practice. Integration of closed-loop solvent recovery systems and low-VOC formulation is leading to increased efficiency and sustainability in pharmaceutical facilities.
Italy is expected to record a CAGR of 3.7% in the industry during the forecast period. Active manufacturing of pharmaceuticals and a strong generics industry propel growth. Solvents are used throughout pharmaceutical processes, including drug solubilization, formulation blending, and crystallization.
Italian chemical manufacturers are investing in distillation and purification processes to enhance solvent purity and minimize impurities. Complementation with EU pharmacopeia standards and environmental regulations is pushing the adoption of safer and more efficient solvents. Strategic partnership with pharmaceutical firms is driving innovation of custom solvent solutions.
South Korea is expected to achieve a CAGR of 4.5% in the industry between 2025 and 2035. Industry growth is driven by expanding pharmaceutical exports, biosimilar production, and government healthcare spending on innovation. Solvents are also important in fermentation technologies, biopharmaceutical manufacturing, and injectable drug formulation.
South Korean manufacturers are emphasizing green chemistry and the production of high-quality solvents for specialty pharmaceutical needs. Improvements in solvent purification technology and stability are enabling applications in biologics and sterile uses. Combining solvent recycling and emission control systems with production guarantees sustainable manufacturing schemes.
Japan's industry is likely to progress at a CAGR of 3.6% through 2035. The demand is concentrated in formulation science, high-performance drug delivery systems, and traditional synthetic drug production. Solvents are utilized on a large scale in large-scale production as well as in small-molecule R&D.
Japanese chemical companies are focusing on highly pure solvents tailored to injectable and ophthalmic uses. Controlled environment conditions and low-residue solvent preference are affecting the selection of solvents. Safety, accuracy, and compliance with regulatory demands, as well as maintaining demand level stability and driving innovation in solvent handling technology.
China will be the leading growth driver in the industry during the forecast period, with a CAGR of 5.8%. Industrialization of pharmaceutical manufacturing at a high pace and increased exports of APIs are fueling strong demand for different types of solvents. Solvents are employed in numerous stages, right from chemical synthesis to the ultimate drug formulation.
Chinese producers are heavily investing in mass solvent production, purification facilities, and recovery technology to be able to compete with overseas quality standards. Regulating better and increasing international pressure are the driving factors to transition to safer, cleaner solvents. A growing demand for prescription and over-the-counter drugs further fuels domestic demand.
Australia is likely to record growth at a CAGR of 3.8% in the industry during 2025 to 2035. Increased pharmaceutical research activities, clinical trials, and formulation development support industry growth. Solvents are employed across the range from preparation of analytical reagents to bulk drug production.
Australian manufacturers are focusing on solvent quality and traceability to meet TGA and overseas requirements. There is growing interest in environmentally friendly and bio-derived solvents, especially in export products. Regulatory emphasis on GMP and solvent residues is enhancing quality assurance practices in pharmaceutical manufacturing facilities.
New Zealand is projected to grow at a CAGR of 3.2% in the industry through the forecast period. The industry is relatively small, servicing local compounding, formulation, and pharmaceutical analytical labs. Solvents such as isopropanol and ethanol are found to be extensively used in drug formulation and quality control.
Local chemical distributors largely service distribution with a focus on regulatory needs and supply continuity. Growth is sustained by growing clinical studies and demand for specialized pharmaceutical solutions. Environmental responsibility and conformance with pharmacopoeial purity standards are impacting the selection of solvents and use procedures.
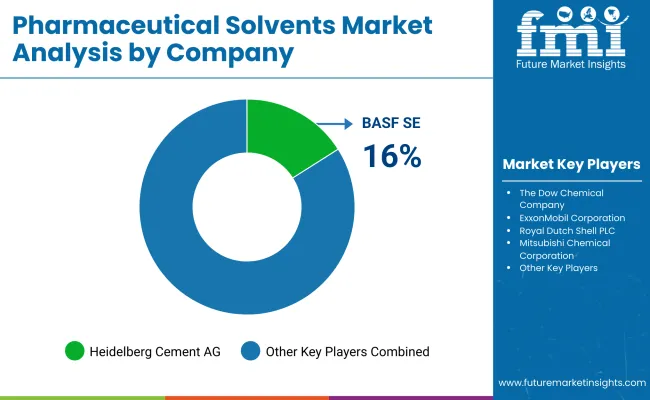
The stiff competition between global chemical manufacturers marks the industry. The manufacturers focus on high-purity solvents, regulatory compliance, and sustainable production. BASF SE, Dow Chemical, and ExxonMobil are the leaders in this domain because they have a strong supply chain along with advanced purification processes and diverse product portfolios to cater to the pharmaceutical industry. Companies are also investing in green solvent technology and bio-based alternatives to fulfill the needs arising from stringent environmental regulations and growing industry demand for sustainable solutions.
Royal Dutch Shell, Mitsubishi Chemical, and Eastman Chemical Company are furthering their specialty solvents business by enhancing chemical stability, sterility, and compatibility with active pharmaceutical ingredients (APIs). The focus on pharmaceutical-grade ethanol, acetone and isopropanol especially benefits their budding position in generic drug manufacturing and high-potency medication formulations.
Forces at play on the ground arena, such as Yip's Chemical Holdings and Clariant AG, are gaining approval through the offering of less-cost solvents for targeted pharmaceutical applications. These companies are able to industry their products better, relying on regional distribution networks and partnerships with contract manufacturing organizations (CMOs).
The trend favors sustainable and less toxic solvents, and players such as Merck KGaA and Procter & Gamble have captured the industry by incorporating biodegradable solvent formulations into their portfolios. Innovations in low residue and non-reactive solvent solutions are setting the stage for new competitive advantages as pharmaceutical firms are seeking high-purity solvents of lesser environmental impact.
Market Share Analysis by Company
| Company Name | Market Share (%) |
|---|---|
| BASF SE | 20-25% |
| The Dow Chemical Company | 18-22% |
| ExxonMobil Corporation | 12-17% |
| Royal Dutch Shell PLC | 8-12% |
| Mitsubishi Chemical Corporation | 5-9% |
| Others (combined) | 30-40% |
| Company Name | Key Offerings and Activities |
|---|---|
| BASF SE | Offers high-purity solvents for APIs, excipients, and drug formulation with a focus on sustainability and regulatory compliance. |
| The Dow Chemical Company | Develops customized solvent solutions for pharmaceuticals, emphasizing biodegradable as well as low-toxicity alternatives. |
| ExxonMobil Corporation | Supplies petrochemical-based solvents with high chemical stability for pharmaceutical synthesis. |
| Royal Dutch Shell PLC | Specializes in isopropanol, ethanol, and ether-based solvents for sterile pharmaceutical applications. |
| Mitsubishi Chemical Corporation | Expands biocompatible solvent offerings for controlled drug delivery and injectable formulations. |
Key Company Insights
BASF SE (20-25%)
BASF leads in pharmaceutical-grade solvents, investing in green chemistry and regulatory-compliant production for global pharmaceutical manufacturers.
The Dow Chemical Company (18-22%)
Dow Chemical enhances its industry presence through custom solvent formulations, focusing on eco-friendly and biodegradable solutions.
ExxonMobil Corporation (12-17%)
ExxonMobil supplies high-purity petrochemical solvents, ensuring stability as well as efficiency in pharmaceutical synthesis and drug formulation.
Royal Dutch Shell PLC (8-12%)
Shell strengthens its position by offering advanced solvent purification processes and high-quality alcohol-based solvents for pharmaceutical use.
Mitsubishi Chemical Corporation (5-9%)
Mitsubishi Chemical expands its biocompatible solvent portfolio, catering to injectable drugs and controlled-release formulations.
Other Key Players
The industry is segmented into alcohols, esters, ethers, ketones, aromatic hydrocarbons, and aliphatic hydrocarbons.
The industry is categorized into active pharmaceutical ingredients (APIs) synthesis, excipients manufacturing, formulation development, and analytical testing.
The industry spans North America, Europe, South America, Asia Pacific, and the Middle East & Africa.
The industry is projected to reach USD 4.3 billion by 2025.
The industry is forecasted to grow to USD 6.7 billion by 2035.
China is expected to grow at a 5.8% CAGR.
The alcohol segment is leading the industry due to its widespread use in drug formulation and synthesis processes.
Key players include BASF SE, The Dow Chemical Company, ExxonMobil Corporation, Royal Dutch Shell PLC, Mitsubishi Chemical Corporation, Yip’s Chemical Holdings Limited, Eastman Chemical Company, Clariant AG, Merck KGaA, and Procter & Gamble.
Table 1: Global Market Value (US$ Billion) Forecast by Region, 2018 to 2033
Table 2: Global Market Volume (Tonnes) Forecast by Region, 2018 to 2033
Table 3: Global Market Value (US$ Billion) Forecast by Chemical Group, 2018 to 2033
Table 4: Global Market Volume (Tonnes) Forecast by Chemical Group, 2018 to 2033
Table 5: North America Market Value (US$ Billion) Forecast by Country, 2018 to 2033
Table 6: North America Market Volume (Tonnes) Forecast by Country, 2018 to 2033
Table 7: North America Market Value (US$ Billion) Forecast by Chemical Group, 2018 to 2033
Table 8: North America Market Volume (Tonnes) Forecast by Chemical Group, 2018 to 2033
Table 9: Latin America Market Value (US$ Billion) Forecast by Country, 2018 to 2033
Table 10: Latin America Market Volume (Tonnes) Forecast by Country, 2018 to 2033
Table 11: Latin America Market Value (US$ Billion) Forecast by Chemical Group, 2018 to 2033
Table 12: Latin America Market Volume (Tonnes) Forecast by Chemical Group, 2018 to 2033
Table 13: Europe Market Value (US$ Billion) Forecast by Country, 2018 to 2033
Table 14: Europe Market Volume (Tonnes) Forecast by Country, 2018 to 2033
Table 15: Europe Market Value (US$ Billion) Forecast by Chemical Group, 2018 to 2033
Table 16: Europe Market Volume (Tonnes) Forecast by Chemical Group, 2018 to 2033
Table 17: Asia Pacific Market Value (US$ Billion) Forecast by Country, 2018 to 2033
Table 18: Asia Pacific Market Volume (Tonnes) Forecast by Country, 2018 to 2033
Table 19: Asia Pacific Market Value (US$ Billion) Forecast by Chemical Group, 2018 to 2033
Table 20: Asia Pacific Market Volume (Tonnes) Forecast by Chemical Group, 2018 to 2033
Table 21: MEA Market Value (US$ Billion) Forecast by Country, 2018 to 2033
Table 22: MEA Market Volume (Tonnes) Forecast by Country, 2018 to 2033
Table 23: MEA Market Value (US$ Billion) Forecast by Chemical Group, 2018 to 2033
Table 24: MEA Market Volume (Tonnes) Forecast by Chemical Group, 2018 to 2033
Figure 1: Global Market Value (US$ Billion) by Chemical Group, 2023 to 2033
Figure 2: Global Market Value (US$ Billion) by Region, 2023 to 2033
Figure 3: Global Market Value (US$ Billion) Analysis by Region, 2018 to 2033
Figure 4: Global Market Volume (Tonnes) Analysis by Region, 2018 to 2033
Figure 5: Global Market Value Share (%) and BPS Analysis by Region, 2023 to 2033
Figure 6: Global Market Y-o-Y Growth (%) Projections by Region, 2023 to 2033
Figure 7: Global Market Value (US$ Billion) Analysis by Chemical Group, 2018 to 2033
Figure 8: Global Market Volume (Tonnes) Analysis by Chemical Group, 2018 to 2033
Figure 9: Global Market Value Share (%) and BPS Analysis by Chemical Group, 2023 to 2033
Figure 10: Global Market Y-o-Y Growth (%) Projections by Chemical Group, 2023 to 2033
Figure 11: Global Market Attractiveness by Chemical Group, 2023 to 2033
Figure 12: Global Market Attractiveness by Region, 2023 to 2033
Figure 13: North America Market Value (US$ Billion) by Chemical Group, 2023 to 2033
Figure 14: North America Market Value (US$ Billion) by Country, 2023 to 2033
Figure 15: North America Market Value (US$ Billion) Analysis by Country, 2018 to 2033
Figure 16: North America Market Volume (Tonnes) Analysis by Country, 2018 to 2033
Figure 17: North America Market Value Share (%) and BPS Analysis by Country, 2023 to 2033
Figure 18: North America Market Y-o-Y Growth (%) Projections by Country, 2023 to 2033
Figure 19: North America Market Value (US$ Billion) Analysis by Chemical Group, 2018 to 2033
Figure 20: North America Market Volume (Tonnes) Analysis by Chemical Group, 2018 to 2033
Figure 21: North America Market Value Share (%) and BPS Analysis by Chemical Group, 2023 to 2033
Figure 22: North America Market Y-o-Y Growth (%) Projections by Chemical Group, 2023 to 2033
Figure 23: North America Market Attractiveness by Chemical Group, 2023 to 2033
Figure 24: North America Market Attractiveness by Country, 2023 to 2033
Figure 25: Latin America Market Value (US$ Billion) by Chemical Group, 2023 to 2033
Figure 26: Latin America Market Value (US$ Billion) by Country, 2023 to 2033
Figure 27: Latin America Market Value (US$ Billion) Analysis by Country, 2018 to 2033
Figure 28: Latin America Market Volume (Tonnes) Analysis by Country, 2018 to 2033
Figure 29: Latin America Market Value Share (%) and BPS Analysis by Country, 2023 to 2033
Figure 30: Latin America Market Y-o-Y Growth (%) Projections by Country, 2023 to 2033
Figure 31: Latin America Market Value (US$ Billion) Analysis by Chemical Group, 2018 to 2033
Figure 32: Latin America Market Volume (Tonnes) Analysis by Chemical Group, 2018 to 2033
Figure 33: Latin America Market Value Share (%) and BPS Analysis by Chemical Group, 2023 to 2033
Figure 34: Latin America Market Y-o-Y Growth (%) Projections by Chemical Group, 2023 to 2033
Figure 35: Latin America Market Attractiveness by Chemical Group, 2023 to 2033
Figure 36: Latin America Market Attractiveness by Country, 2023 to 2033
Figure 37: Europe Market Value (US$ Billion) by Chemical Group, 2023 to 2033
Figure 38: Europe Market Value (US$ Billion) by Country, 2023 to 2033
Figure 39: Europe Market Value (US$ Billion) Analysis by Country, 2018 to 2033
Figure 40: Europe Market Volume (Tonnes) Analysis by Country, 2018 to 2033
Figure 41: Europe Market Value Share (%) and BPS Analysis by Country, 2023 to 2033
Figure 42: Europe Market Y-o-Y Growth (%) Projections by Country, 2023 to 2033
Figure 43: Europe Market Value (US$ Billion) Analysis by Chemical Group, 2018 to 2033
Figure 44: Europe Market Volume (Tonnes) Analysis by Chemical Group, 2018 to 2033
Figure 45: Europe Market Value Share (%) and BPS Analysis by Chemical Group, 2023 to 2033
Figure 46: Europe Market Y-o-Y Growth (%) Projections by Chemical Group, 2023 to 2033
Figure 47: Europe Market Attractiveness by Chemical Group, 2023 to 2033
Figure 48: Europe Market Attractiveness by Country, 2023 to 2033
Figure 49: Asia Pacific Market Value (US$ Billion) by Chemical Group, 2023 to 2033
Figure 50: Asia Pacific Market Value (US$ Billion) by Country, 2023 to 2033
Figure 51: Asia Pacific Market Value (US$ Billion) Analysis by Country, 2018 to 2033
Figure 52: Asia Pacific Market Volume (Tonnes) Analysis by Country, 2018 to 2033
Figure 53: Asia Pacific Market Value Share (%) and BPS Analysis by Country, 2023 to 2033
Figure 54: Asia Pacific Market Y-o-Y Growth (%) Projections by Country, 2023 to 2033
Figure 55: Asia Pacific Market Value (US$ Billion) Analysis by Chemical Group, 2018 to 2033
Figure 56: Asia Pacific Market Volume (Tonnes) Analysis by Chemical Group, 2018 to 2033
Figure 57: Asia Pacific Market Value Share (%) and BPS Analysis by Chemical Group, 2023 to 2033
Figure 58: Asia Pacific Market Y-o-Y Growth (%) Projections by Chemical Group, 2023 to 2033
Figure 59: Asia Pacific Market Attractiveness by Chemical Group, 2023 to 2033
Figure 60: Asia Pacific Market Attractiveness by Country, 2023 to 2033
Figure 61: MEA Market Value (US$ Billion) by Chemical Group, 2023 to 2033
Figure 62: MEA Market Value (US$ Billion) by Country, 2023 to 2033
Figure 63: MEA Market Value (US$ Billion) Analysis by Country, 2018 to 2033
Figure 64: MEA Market Volume (Tonnes) Analysis by Country, 2018 to 2033
Figure 65: MEA Market Value Share (%) and BPS Analysis by Country, 2023 to 2033
Figure 66: MEA Market Y-o-Y Growth (%) Projections by Country, 2023 to 2033
Figure 67: MEA Market Value (US$ Billion) Analysis by Chemical Group, 2018 to 2033
Figure 68: MEA Market Volume (Tonnes) Analysis by Chemical Group, 2018 to 2033
Figure 69: MEA Market Value Share (%) and BPS Analysis by Chemical Group, 2023 to 2033
Figure 70: MEA Market Y-o-Y Growth (%) Projections by Chemical Group, 2023 to 2033
Figure 71: MEA Market Attractiveness by Chemical Group, 2023 to 2033
Figure 72: MEA Market Attractiveness by Country, 2023 to 2033


Our Research Products

The "Full Research Suite" delivers actionable market intel, deep dives on markets or technologies, so clients act faster, cut risk, and unlock growth.

The Leaderboard benchmarks and ranks top vendors, classifying them as Established Leaders, Leading Challengers, or Disruptors & Challengers.

Locates where complements amplify value and substitutes erode it, forecasting net impact by horizon

We deliver granular, decision-grade intel: market sizing, 5-year forecasts, pricing, adoption, usage, revenue, and operational KPIs—plus competitor tracking, regulation, and value chains—across 60 countries broadly.

Spot the shifts before they hit your P&L. We track inflection points, adoption curves, pricing moves, and ecosystem plays to show where demand is heading, why it is changing, and what to do next across high-growth markets and disruptive tech

Real-time reads of user behavior. We track shifting priorities, perceptions of today’s and next-gen services, and provider experience, then pace how fast tech moves from trial to adoption, blending buyer, consumer, and channel inputs with social signals (#WhySwitch, #UX).

Partner with our analyst team to build a custom report designed around your business priorities. From analysing market trends to assessing competitors or crafting bespoke datasets, we tailor insights to your needs.
Supplier Intelligence
Discovery & Profiling
Capacity & Footprint
Performance & Risk
Compliance & Governance
Commercial Readiness
Who Supplies Whom
Scorecards & Shortlists
Playbooks & Docs
Category Intelligence
Definition & Scope
Demand & Use Cases
Cost Drivers
Market Structure
Supply Chain Map
Trade & Policy
Operating Norms
Deliverables
Buyer Intelligence
Account Basics
Spend & Scope
Procurement Model
Vendor Requirements
Terms & Policies
Entry Strategy
Pain Points & Triggers
Outputs
Pricing Analysis
Benchmarks
Trends
Should-Cost
Indexation
Landed Cost
Commercial Terms
Deliverables
Brand Analysis
Positioning & Value Prop
Share & Presence
Customer Evidence
Go-to-Market
Digital & Reputation
Compliance & Trust
KPIs & Gaps
Outputs
Full Research Suite comprises of:
Market outlook & trends analysis
Interviews & case studies
Strategic recommendations
Vendor profiles & capabilities analysis
5-year forecasts
8 regions and 60+ country-level data splits
Market segment data splits
12 months of continuous data updates
DELIVERED AS:
PDF EXCEL ONLINE
Pharmaceutical Autoclave Machine Market Size and Share Forecast Outlook 2025 to 2035
Pharmaceutical Excipient SNAC Market Size and Share Forecast Outlook 2025 to 2035
Pharmaceutical Zinc Powder Market Size and Share Forecast Outlook 2025 to 2035
Pharmaceutical Grade Magnesium Sulfate Market Size and Share Forecast Outlook 2025 to 2035
Pharmaceutical Secondary Packaging Market Size and Share Forecast Outlook 2025 to 2035
Pharmaceutical Glass Packaging Market Size and Share Forecast Outlook 2025 to 2035
Pharmaceutical Manufacturing Equipment Market Forecast and Outlook 2025 to 2035
Pharmaceutical Plastic Bottle Market Forecast and Outlook 2025 to 2035
Pharmaceutical Grade Sodium Carbonate Market Forecast and Outlook 2025 to 2035
Pharmaceutical Industry Analysis in Saudi Arabia Forecast and Outlook 2025 to 2035
Pharmaceutical Packaging Market Size and Share Forecast Outlook 2025 to 2035
Pharmaceutical Grade Sodium Chloride Market Size and Share Forecast Outlook 2025 to 2035
Pharmaceutical Plastic Packaging Market Size and Share Forecast Outlook 2025 to 2035
Pharmaceutical Plastic Pots Market Size and Share Forecast Outlook 2025 to 2035
Pharmaceuticals Pouch Market Size and Share Forecast Outlook 2025 to 2035
Pharmaceutical Unit Dose Packaging Market Size and Share Forecast Outlook 2025 to 2035
Pharmaceutical Mini Batch Blender Market Size and Share Forecast Outlook 2025 to 2035
Pharmaceutical Continuous Manufacturing Equipment Market Size and Share Forecast Outlook 2025 to 2035
Pharmaceutical Liquid Prefilters Market Size and Share Forecast Outlook 2025 to 2035
Pharmaceutical Grade P-Toluenesulfonic Acid Market Size and Share Forecast Outlook 2025 to 2035

Thank you!
You will receive an email from our Business Development Manager. Please be sure to check your SPAM/JUNK folder too.
Chat With
MaRIA