The global pharmaceutical grade sodium chloride market is set to grow from USD 524 million in 2025 to USD 912.2 million by 2035, adding USD 388.2 million in new revenue and advancing at a CAGR of 5.7%. Growth is driven by rising demand for intravenous fluids, injectable medications, and biologics formulations, alongside the expansion of dialysis patient populations and increased investment in parenteral drug manufacturing infrastructure. Pharmaceutical-grade NaCl is indispensable for sterile saline solutions, hemodialysis concentrates, and cell-culture compatible excipients, with stringent multi-compendial compliance (USP/EP/JP) driving adoption across global pharmaceutical supply chains. API-NaCl dominates with an 85% share in 2025, supported by its ultra-low endotoxin requirements and suitability for injectable preparations, while HD-NaCl holds the remaining share through its critical role in hemodialysis and peritoneal dialysis formulations. By application, injections lead with 39%, reflecting the central role of saline solutions in IV therapy, parenteral excipients, and vaccine/biologic diluents, followed by hemodialysis at 34%, aligned with rising chronic kidney disease prevalence worldwide.
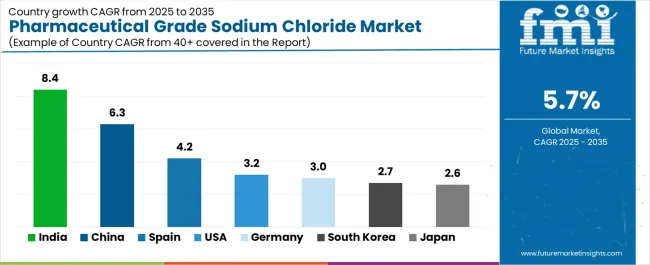
Asia Pacific leads growth, with India (8.4% CAGR) and China (6.3%) accelerating production through large-scale IV fluid manufacturing, dialysis infrastructure expansion, and domestic pharmaceutical ingredient localization initiatives. Spain (4.2%) strengthens its position through hospital pharmacy networks and national saline procurement programs, while the United States (3.2%), Germany (3%), and Japan (2.6%) emphasize precision quality, low-endotoxin specifications, and biologics-compatible grades that meet stringent regulatory expectations. Competitive advantage is consolidating around multi-compendial compliance, vacuum crystallization technology, endotoxin control capabilities, and comprehensive analytical documentation, with leading players such as K+S Aktiengesellschaft, Nouryon, Tata Chemicals, Dominion Salt, Cargill, and Salinen Austria AG differentiating through pharmaceutical GMP-certified systems, trace-metal controlled purification, and deep regulatory alignment across global parenteral manufacturing ecosystems.
A major dynamic shaping the market is the expansion of IV fluid production and infusion therapy usage. Intravenous saline remains one of the most widely used therapeutic solutions in hospitals, supporting hydration, electrolyte balance, and delivery of medications during surgeries, emergency care, and chronic disease treatment. As hospital admissions rise and surgical volumes increase, the demand for large-volume IV fluids, and therefore pharmaceutical grade sodium chloride, continues to grow steadily. High-purity salt is essential for ensuring sterility, compatibility with sensitive drugs, and consistent therapeutic performance.
Pharmaceutical manufacturing represents another key growth driver. Sodium chloride acts as an excipient in a variety of formulations including oral drugs, injectables, vaccines, and biologics. Its functionality as a tonicity agent, stabilizer, and isotonicity regulator supports drug absorption and ensures compatibility with human physiology. Expanding production of biologics, monoclonal antibodies, and injectable therapies requires large volumes of high-purity sodium chloride used in formulation, purification, and buffer preparation. With biopharmaceutical companies scaling capacity across global manufacturing hubs, demand for pharmaceutical grade salts is expected to rise significantly.
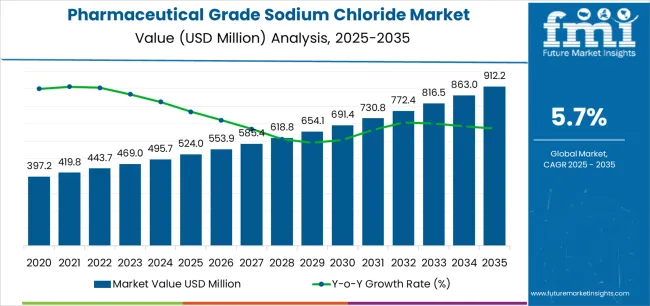
Between 2025 and 2030, the pharmaceutical grade sodium chloride market is projected to expand from USD 524 million to USD 693.2 million, resulting in a value increase of USD 169.2 million, which represents 43.2% of the total forecast growth for the decade. This phase of development will be shaped by rising demand for injectable medications and intravenous therapy solutions, product innovation in ultra-low endotoxin formulations and multi-compendial grade specifications, as well as expanding integration with biologics manufacturing and vaccine production initiatives. Companies are establishing competitive positions through investment in advanced purification technologies, pharmaceutical-grade crystallization systems, and strategic market expansion across parenteral drug manufacturing, dialysis treatment, and oral rehydration therapy applications.
From 2030 to 2035, the market is forecast to grow from USD 693.2 million to USD 912.2 million, adding another USD 222.8 million, which constitutes 56.8% of the overall ten-year expansion. This period is expected to be characterized by the expansion of specialized pharmaceutical sodium chloride products, including sterile injectable grades and low-endotoxin formulations tailored for biologics applications, strategic collaborations between salt producers and pharmaceutical manufacturers, and an enhanced focus on supply chain security and domestic production capabilities. The growing emphasis on biosimilar development and advanced parenteral therapies will drive demand for high-performance, pharmaceutical-grade sodium chloride solutions across diverse healthcare applications.
| Metric | Value |
|---|---|
| Market Value (2025) | USD 524 million |
| Market Forecast Value (2035) | USD 912.2 million |
| Forecast CAGR (2025-2035) | 5.7% |
The pharmaceutical grade sodium chloride market grows by enabling healthcare providers and pharmaceutical manufacturers to access ultra-pure saline solutions essential for intravenous therapy, drug formulation, and dialysis treatment applications. Hospital and clinical settings face mounting pressure to ensure patient safety and therapeutic efficacy, with pharmaceutical-grade sodium chloride meeting stringent USP, EP, and JP compendial specifications for injectable medications, requiring less than 0.25 EU/mL endotoxin levels and 99.9%+ purity that supports critical care and emergency medicine protocols. The dialysis industry's expansion creates sustained demand for high-purity sodium chloride supporting hemodialysis concentrates and peritoneal dialysis solutions, serving growing chronic kidney disease populations requiring regular renal replacement therapy.
Government healthcare initiatives promoting universal health coverage and hospital infrastructure development drive adoption of pharmaceutical sodium chloride across emerging markets, where domestic production capabilities reduce import dependencies and support pharmaceutical manufacturing self-sufficiency. Biologics manufacturing expansion encourages adoption of multi-compendial pharmaceutical-grade sodium chloride for vaccine diluents, monoclonal antibody formulations, and cell therapy applications, creating differentiation opportunities for suppliers investing in sterile processing and trace-metal control technologies. Complex regulatory validation requirements and high capital costs for achieving pharmaceutical-grade production standards may limit market entry among smaller salt producers and developing regions with limited quality infrastructure.
The market is segmented by type, application, purity/form, and region. By type, the market is divided into API-NaCl and HD-NaCl. Based on application, the market is categorized into injections, hemodialysis, oral rehydration salts, osmotic agents, and others. By purity/form, the market includes ≥99.9% low-endotoxin crystalline, standard pharma crystalline, and buffered/modified & specialty forms. Regionally, the market is divided into Asia Pacific, North America, Europe, and other key regions.
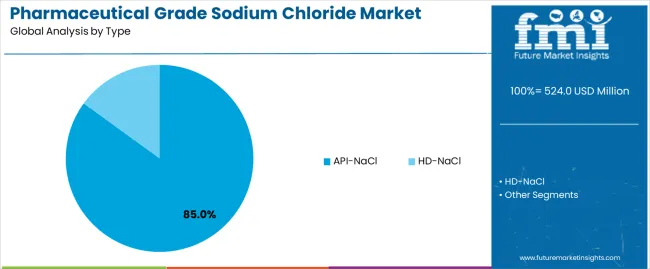
The API-NaCl segment represents the dominant force in the pharmaceutical grade sodium chloride market, capturing approximately 85% of total market share in 2025. This advanced category encompasses USP/EP multi-compendial grades, Ph.Eur/BP dedicated formulations, JP grade specifications, and low-endotoxin/pyrogen-controlled variants essential for injectable drug manufacturing, parenteral excipients, and biological formulations. The API-NaCl segment's market leadership stems from extensive applications across intravenous fluid production, vaccine manufacturing, and pharmaceutical compounding, where ultra-high purity specifications exceeding 99.9% and endotoxin levels below 0.25 EU/mL ensure patient safety and regulatory compliance.
Within the API-NaCl segment, USP/EP multi-compendial grades account for 35% of total market share, serving manufacturers requiring broad regulatory acceptance across multiple markets. Ph.Eur/BP dedicated grades represent 28% market share, while JP grade specifications capture 12% serving Japanese pharmaceutical standards. The HD-NaCl segment maintains 15% market share, serving dialysis applications through hemodialysis concentrates and peritoneal dialysis solutions.
Key technological advantages driving the API-NaCl segment include:
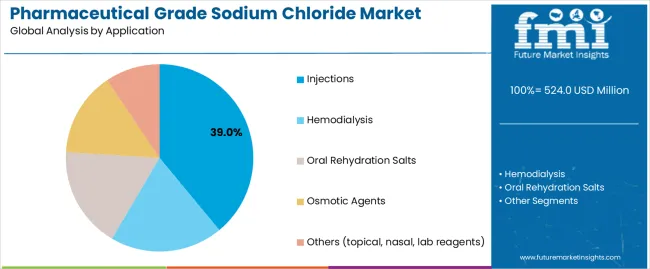
Injections applications dominate the pharmaceutical grade sodium chloride market with approximately 39% market share in 2025, reflecting the critical role of saline solutions in intravenous therapy, parenteral drug delivery, and emergency medical treatment supporting global healthcare delivery systems. The injections segment's market leadership is reinforced by rising hospital admission rates, growing surgical procedure volumes, and expanding home healthcare services requiring sterile sodium chloride for medication administration and fluid replacement therapy.
Within the injections segment, IV fluids and saline applications account for 22% of total market share, representing the largest single application category. Parenteral drug excipient use captures 10% market share, while vaccine and biologics diluent applications represent 7% market share. The hemodialysis segment represents the second-largest application category, capturing 34% market share through renal replacement therapy requirements. Oral rehydration salts account for 11% market share serving dehydration treatment protocols.
Key market dynamics supporting application growth include:
The ≥99.9% low-endotoxin crystalline segment dominates the pharmaceutical grade sodium chloride market with approximately 48% market share in 2025, reflecting stringent quality requirements for injectable medications, parenteral nutrition, and dialysis applications where endotoxin contamination poses serious patient safety risks. The high-purity segment's market leadership is supported by regulatory mandates requiring ultra-low pyrogen levels and comprehensive analytical testing validating pharmaceutical-grade specifications.
Within the high-purity segment, sterile injectable grade formulations account for 26% of total market share, serving direct patient administration applications. Non-sterile API grade products represent 22% market share through pharmaceutical compounding and drug manufacturing uses. Standard pharma crystalline grades capture 44% market share serving general pharmaceutical applications, while buffered/modified specialty forms account for 8% market share.
Key factors supporting high-purity segment dominance include:
The market is driven by three concrete demand factors tied to healthcare delivery requirements. First, global healthcare infrastructure expansion and hospital construction programs create increasing demand for intravenous fluids and injectable medications, with worldwide IV therapy administration projected to grow by 4-6% annually across major markets, requiring pharmaceutical-grade sodium chloride meeting USP, EP, and JP compendial specifications for patient safety and therapeutic efficacy. Second, chronic kidney disease prevalence increases driven by diabetes and hypertension epidemics accelerate dialysis treatment demand, with global hemodialysis patient populations exceeding 3 million individuals requiring high-purity sodium chloride for regular renal replacement therapy sessions. Third, biologics manufacturing expansion and vaccine production growth create sustained demand for ultra-low endotoxin pharmaceutical-grade sodium chloride, with monoclonal antibodies, biosimilars, and cell therapies requiring sterile diluents and excipients meeting stringent pyrogen specifications below 0.25 EU/mL.
Market restraints include stringent regulatory validation requirements that create barriers to market entry, particularly pharmaceutical GMP certification processes requiring extensive analytical testing, process validation, and quality documentation for multi-compendial grade production. Supply chain vulnerabilities pose challenges, as pharmaceutical-grade sodium chloride production depends on high-purity brine sources and specialized vacuum crystallization equipment with limited global capacity and long lead times for capacity expansion. Quality control complexities create additional challenges for manufacturers, demanding ongoing investment in advanced analytical instrumentation, clean-room facilities, and endotoxin testing systems that increase production costs and require specialized technical expertise.
Key trends indicate accelerated adoption of multi-compendial pharmaceutical-grade formulations meeting USP, EP, and JP specifications simultaneously, enabling pharmaceutical manufacturers to streamline global supply chains and reduce inventory complexity through single-source procurement. Localization initiatives intensify across emerging markets, with India and China implementing domestic pharmaceutical sodium chloride production programs reducing import dependencies and supporting national pharmaceutical manufacturing strategies. Sustainability pressures drive innovation in brine purification and crystallization technologies, with manufacturers adopting closed-loop water recycling and energy-efficient vacuum evaporation systems reducing environmental footprints. The market thesis could face disruption if alternative parenteral formulation technologies or synthetic saline substitutes achieve regulatory approval, potentially reducing dependence on traditional sodium chloride sources for certain medical applications.
| Country | CAGR (2025-2035) |
|---|---|
| India | 8.4% |
| China | 6.3% |
| Spain | 4.2% |
| USA | 3.2% |
| Germany | 3% |
| South Korea | 2.7% |
| Japan | 2.6% |
The pharmaceutical grade sodium chloride market is gaining momentum worldwide, with India taking the lead thanks to rapid scale-up of injectable and IV fluid manufacturing plants coupled with expanding dialysis capacity and favorable government incentives supporting pharmaceutical production. Close behind, China benefits from pharmaceutical input localization initiatives, growing chronic kidney disease burden, and comprehensive GMP upgrades in parenteral manufacturing facilities, positioning itself as a strategic production hub. Spain shows steady advancement, where aging population demographics, hospital pharmacy investments, and public saline tender programs strengthen its role in European pharmaceutical supply chains.
The United States stands out for steady IV therapy utilization, high dialysis penetration rates, and stringent low-endotoxin specification requirements. Meanwhile, Germany maintains consistent progress through export-grade EP/BP pharmaceutical sodium chloride production and dense injectable CDMO infrastructure, and South Korea and Japan continue to record stable growth in biotech capacity and super-aging demographics sustaining IV and dialysis demand. Together, India and China anchor the global expansion story, while the rest build stability and diversity into the market's growth path.
The report covers an in-depth analysis of 40+ countries, the top-performing countries are highlighted below.
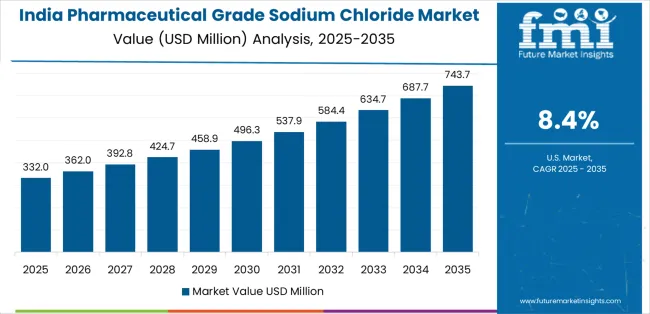
India demonstrates the strongest growth potential in the Pharmaceutical Grade Sodium Chloride Market with a CAGR of 8.4% through 2035. The country's leadership position stems from rapid scale-up of injectable and IV fluid manufacturing plants, government Production Linked Incentive schemes supporting pharmaceutical ingredient production, and aggressive capacity expansion by domestic salt and pharmaceutical companies, driving adoption of pharmaceutical-grade purification technologies and multi-compendial specifications.
Growth is concentrated in major pharmaceutical clusters, including Gujarat, Maharashtra, Telangana, and Tamil Nadu, where pharmaceutical manufacturers are implementing GMP-certified sodium chloride production facilities for domestic consumption and export to regulated markets including USA, Europe, and emerging Asia Pacific countries. Distribution channels through established pharmaceutical supply chains and direct manufacturer relationships expand deployment across parenteral drug production facilities, dialysis centers, and oral rehydration therapy programs.
Key market factors:
In Jiangsu, Zhejiang, Shandong, and Hebei provinces, the adoption of pharmaceutical-grade sodium chloride production is accelerating across integrated pharmaceutical complexes, parenteral drug manufacturers, and dialysis concentrate facilities, driven by localization of pharmaceutical inputs and chronic kidney disease burden growth.
The market demonstrates strong growth momentum with a CAGR of 6.3% through 2035, linked to comprehensive pharmaceutical industry GMP upgrades and increasing focus on domestic production of critical healthcare materials reducing import dependencies. Chinese manufacturers are implementing advanced brine purification systems and vacuum crystallization technologies to enhance product quality while serving growing demand for injectable-grade sodium chloride in both domestic pharmaceutical manufacturing and international export markets.
Spain's healthcare system demonstrates sophisticated implementation of pharmaceutical-grade sodium chloride across hospital pharmacies, dialysis networks, and parenteral drug manufacturing facilities, with documented integration supporting universal healthcare delivery and aging population medical requirements.
The country's healthcare infrastructure in major regions, including Catalonia, Madrid, Andalusia, and Valencia, showcases advanced deployment of IV therapy protocols and dialysis treatment programs where pharmaceutical-grade sodium chloride meets stringent EP/BP compendial specifications. Spanish healthcare providers emphasize quality standards and patient safety protocols, creating sustained demand for ultra-low endotoxin pharmaceutical sodium chloride that supports public hospital tender requirements and private healthcare facility procurement. The market maintains steady growth through focus on healthcare quality improvement and export-oriented pharmaceutical manufacturing, with a CAGR of 4.2% through 2035.
Key development areas:
The U.S. market leads in advanced pharmaceutical-grade sodium chloride specifications based on stringent FDA regulations, comprehensive USP monograph requirements, and sophisticated quality control systems ensuring ultra-low endotoxin levels for injectable and dialysis applications. The country shows solid potential with a CAGR of 3.2% through 2035, driven by steady IV therapy utilization across hospital systems, high dialysis penetration rates serving large end-stage renal disease populations, and specialty pharmaceutical manufacturing requiring pharmaceutical-grade excipients across major production regions, including New Jersey, North Carolina, California, and Puerto Rico.
American healthcare providers maintain strict quality standards and extensive validation requirements, particularly for injectable medications and dialysis concentrates serving critical patient populations. Technology deployment channels through established pharmaceutical distributors and direct manufacturer relationships expand coverage across hospital systems, outpatient dialysis chains, and pharmaceutical production facilities.
Leading market segments:
In North Rhine-Westphalia, Bavaria, Baden-Württemberg, and Hesse, pharmaceutical manufacturing facilities are implementing pharmaceutical-grade sodium chloride production through advanced vacuum crystallization and ultra-pure brine processing, with documented case studies showing successful EP/BP compendial compliance and export-grade quality specifications. The market shows moderate growth potential with a CAGR of 3% through 2035, linked to established pharmaceutical industry infrastructure, dense injectable CDMO presence, and emerging biologics manufacturing requiring pharmaceutical-grade excipients.
German manufacturers maintain competitive advantages through rigorous quality systems and environmental compliance, creating demand for ultra-high purity pharmaceutical sodium chloride supporting domestic pharmaceutical production and European export markets. The country's established pharmaceutical infrastructure creates sustained demand for technology optimization solutions that integrate with existing parenteral drug manufacturing systems.
Market development factors:
South Korea's market expansion is driven by diverse pharmaceutical demand, including biologics manufacturing capacity growth in Incheon and Songdo, hospital modernization programs in Seoul and Busan, and comprehensive dialysis network expansion across multiple regions. The country demonstrates promising growth potential with a CAGR of 2.7% through 2035, supported by government biotechnology development programs and healthcare infrastructure investment initiatives.
Korean pharmaceutical manufacturers face implementation challenges related to domestic pharmaceutical-grade sodium chloride production capacity and quality system validation, requiring import relationships and international partnership support. Growing biologics manufacturing requirements and hospital pharmaceutical consumption create compelling business cases for pharmaceutical-grade sodium chloride supply chain development, particularly in facilities serving Samsung Biologics, Celltrion, and other major pharmaceutical companies.
Market characteristics:
The Japan market leads in ultra-high pharmaceutical-grade specifications based on stringent JP monograph requirements, comprehensive quality documentation, and sophisticated analytical testing ensuring pharmaceutical sodium chloride meets uncompromising quality standards. The country shows moderate potential with a CAGR of 2.6% through 2035, driven by super-aging demographics sustaining IV therapy and dialysis demand, stable pharmaceutical manufacturing requirements, and quality-focused healthcare delivery across major regions, including Kanto, Kansai, and Chubu industrial areas.
Japanese healthcare providers maintain exceptional quality standards and extensive validation protocols, particularly for injectable medications and dialysis applications serving elderly patient populations. Technology deployment emphasizes continuous quality improvement and comprehensive pharmaceutical compliance systems.
Leading market segments:
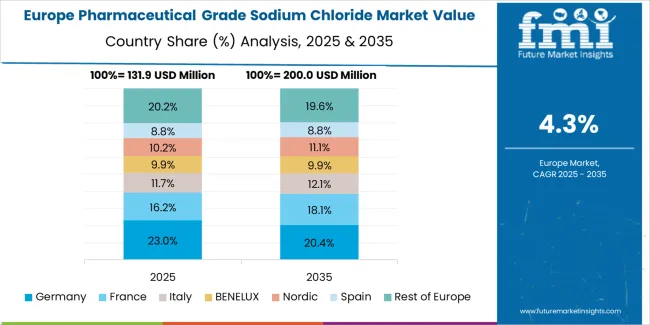
The pharmaceutical grade sodium chloride market in Europe accounts for 29% of global value at USD 152 million in 2025. Germany is expected to maintain its leadership position with a 21.5% market share within Europe, supported by injectable manufacturing clusters in Rhine-Ruhr region, comprehensive pharmaceutical infrastructure, and export-grade EP/BP compendial specification production capabilities.
France follows with a 14% share, driven by demand concentrated around Île-de-France pharmaceutical manufacturing facilities and dialysis network requirements. The United Kingdom holds a 13% share through diversified pharmaceutical manufacturing and NHS procurement programs. Italy commands an 11% share with pharmaceutical activity in Lombardy region, while Spain accounts for 8% serving hospital pharmacy networks.
Benelux captures 7% market share through pharmaceutical distribution hub activities, and Nordic countries hold 6% through advanced healthcare systems. Central & Eastern Europe is anticipated to account for 13.5% as pharmaceutical manufacturing expands in Poland, Czech Republic, and Hungary, while Rest of Europe represents 6%. The region's pharmaceutical-grade sodium chloride demand is concentrated around injectable manufacturing clusters, dialysis networks, and exporters meeting EP/BP compendial specifications, with REACH and GMP rigor maintaining focus on high-purity, low-endotoxin grades.
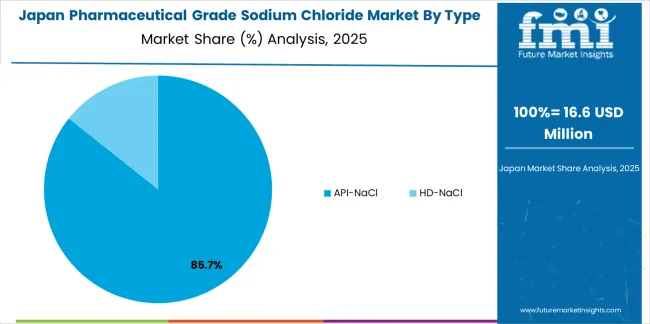
The pharmaceutical grade sodium chloride market in Japan demonstrates a mature and quality-focused landscape, characterized by sophisticated implementation of ultra-high purity production systems with existing pharmaceutical manufacturing infrastructure across parenteral drug facilities, dialysis concentrate manufacturers, and hospital pharmacy supply chains. Japan's emphasis on pharmaceutical excellence and patient safety drives demand for JP-grade sodium chloride exceeding minimum compendial requirements, supporting domestic producers including major pharmaceutical companies and specialized pharmaceutical ingredient suppliers in maintaining strict quality standards and comprehensive analytical testing protocols.
The market benefits from strong partnerships between international pharmaceutical-grade salt providers and domestic pharmaceutical distributors, creating comprehensive service ecosystems that prioritize endotoxin control, trace-metal specifications, and complete quality documentation programs. Manufacturing and distribution centers in Tokyo, Osaka, and Nagoya showcase advanced quality assurance implementations where pharmaceutical-grade sodium chloride achieves 99.99%+ purity through integrated crystallization and purification monitoring programs supporting Japan's reputation for pharmaceutical quality excellence.
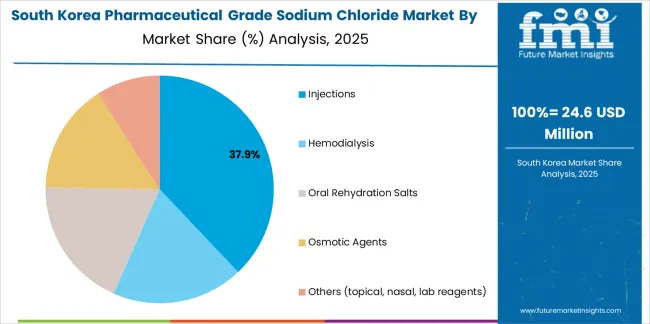
The South Korean pharmaceutical grade sodium chloride market is characterized by strong international pharmaceutical ingredient provider presence, with companies like Nouryon, Tata Chemicals, and established European suppliers maintaining significant positions through comprehensive quality systems and regulatory support capabilities for injectable and dialysis applications. The market is demonstrating growing emphasis on biologics manufacturing support and ultra-low endotoxin specifications, as Korean pharmaceutical manufacturers increasingly demand specialized pharmaceutical-grade sodium chloride that integrates with domestic biotechnology infrastructure, hospital modernization programs, and pharmaceutical manufacturing complexes operated across Samsung, Celltrion, and other major healthcare groups.
Local pharmaceutical ingredient distributors and regional specialty suppliers are gaining market share through strategic partnerships with global pharmaceutical-grade salt producers, offering specialized services including Korean regulatory documentation support and technical application programs for parenteral manufacturing. The competitive landscape shows increasing collaboration between multinational pharmaceutical ingredient companies and Korean healthcare specialists, creating hybrid service models that combine international pharmaceutical quality expertise with local distribution capabilities and healthcare system understanding.
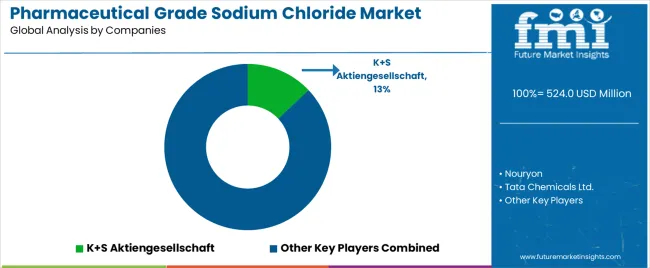
The Pharmaceutical Grade Sodium Chloride Market features approximately 20–30 players with moderate concentration, where the top three companies control roughly 32–38% of global share through validated high-purity production platforms, multi-compendial certifications, and long-standing supply relationships with pharmaceutical solution manufacturers. The leading company, K+S Aktiengesellschaft, holds around 13% market share supported by integrated vacuum salt facilities and advanced purification systems serving injectable, dialysis, and parenteral nutrition solution producers across Europe and North America. Competition is driven by purity consistency, endotoxin control, trace-metal management, and regulatory compliance capabilities rather than pricing alone.
Market leaders include K+S Aktiengesellschaft, Nouryon, and Tata Chemicals Ltd., which maintain strong competitive positions through GMP-certified production assets, validated crystallization technologies, and expertise in meeting USP, EP, JP, and multi-compendial requirements. Their advantage stems from comprehensive analytical testing frameworks, robust impurity-control protocols, and established regulatory support teams that ensure high switching costs for pharmaceutical customers dependent on validated documentation, CoAs, and long-term supply reliability. These companies continue expanding into ultra-low endotoxin grades and biologics-compatible formulations aligned with sterile manufacturing growth.
Challengers include Dominion Salt Ltd. and Cargill’s salt business, which compete through increasingly specialized pharmaceutical-grade production lines and reliable regional supply networks. European producers such as Salinen Austria AG and Sudsalz GmbH emphasize EP/BP specifications, vacuum crystallization precision, and pharmaceutical-compliant packaging formats to strengthen their positioning within injectable solution and dialysis fluid supply chains.
Additional competitive pressure comes from regional producers and specialized pharmaceutical ingredient suppliers such as Cheetham Salt, Compass Minerals, Swiss Saltworks, Akzo Nobel N.V., Merck KGaA, Spectrum Chemical, and Hubei Xingfa Chemicals Group. Their strengths lie in agile regulatory support, capability to meet country-specific pharmacopeia requirements, and proximity to high-growth manufacturing hubs in India, China, and Southeast Asia. Overall, market dynamics increasingly reward companies integrating advanced crystallization, low-microbial production, and comprehensive pharmaceutical quality systems spanning brine purification through compliant packaging and global documentation support.
Pharmaceutical grade sodium chloride represents ultra-pure salt formulations that enable healthcare providers and pharmaceutical manufacturers to achieve stringent quality specifications exceeding 99.9% purity with ultra-low endotoxin levels below 0.25 EU/mL, delivering superior patient safety and therapeutic efficacy essential for intravenous therapy, dialysis treatment, and parenteral drug formulation in critical healthcare applications. With the market projected to grow from USD 524 million in 2025 to USD 912.2 million by 2035 at a 5.7% CAGR, these pharmaceutical-grade materials offer compelling advantages - multi-compendial regulatory compliance, comprehensive quality documentation, and proven clinical safety profiles - making them essential for injections applications (39% market share), hemodialysis (34% share), and oral rehydration therapy seeking alternatives to technical-grade sodium chloride that compromise patient safety through inadequate purity specifications.
How Governments Could Spur Local Production and Adoption?
How Industry Bodies Could Support Market Development?
How OEMs and Technology Players Could Strengthen the Ecosystem?
How Suppliers Could Navigate the Shift?
How Investors and Financial Enablers Could Unlock Value?
| Item | Value |
|---|---|
| Quantitative Units | USD 524 million |
| Type | API-NaCl (USP/EP multi-compendial, Ph.Eur/BP dedicated, JP grade, Low-endotoxin/pyrogen-controlled), HD-NaCl (Hemodialysis concentrates, Peritoneal/hemofiltration solutions) |
| Application | Injections (IV fluids/saline, Parenteral drug excipient, Vaccine/biologics diluent), Hemodialysis, Oral Rehydration Salts, Osmotic Agents, Others |
| Purity/Form | ≥99.9% low-endotoxin crystalline (Sterile injectable grade, Non-sterile API grade), Standard pharma crystalline (≥99.5%), Buffered/modified & specialty forms |
| Regions Covered | Asia Pacific, North America, Europe, Latin America, Middle East & Africa |
| Country Covered | India, China, Spain, United States, Germany, South Korea, Japan, and 40+ countries |
| Key Companies Profiled | K+S Aktiengesellschaft, Nouryon, Tata Chemicals Ltd., Dominion Salt Ltd., Cargill (Salt Business), Salinen Austria AG, Sudsalz GmbH, Cheetham Salt, Compass Minerals, Swiss Saltworks, Akzo Nobel N.V., Merck KGaA, Spectrum Chemical, Hubei Xingfa Chemicals Group |
| Additional Attributes | Dollar sales by type, application, and purity/form categories, regional adoption trends across Asia Pacific, North America, and Europe, competitive landscape with pharmaceutical-grade salt producers and specialty chemical manufacturers, manufacturing facility requirements and GMP specifications, integration with pharmaceutical manufacturing, dialysis treatment, and biologics production, innovations in ultra-low endotoxin processing and multi-compendial grade production, and development of specialized formulations with enhanced purity and comprehensive quality documentation characteristics. |
The global pharmaceutical grade sodium chloride market is estimated to be valued at USD 524.0 million in 2025.
The market size for the pharmaceutical grade sodium chloride market is projected to reach USD 912.2 million by 2035.
The pharmaceutical grade sodium chloride market is expected to grow at a 5.7% CAGR between 2025 and 2035.
The key product types in pharmaceutical grade sodium chloride market are api-nacl and hd-nacl.
In terms of application, injections segment to command 39.0% share in the pharmaceutical grade sodium chloride market in 2025.


Our Research Products

The "Full Research Suite" delivers actionable market intel, deep dives on markets or technologies, so clients act faster, cut risk, and unlock growth.

The Leaderboard benchmarks and ranks top vendors, classifying them as Established Leaders, Leading Challengers, or Disruptors & Challengers.

Locates where complements amplify value and substitutes erode it, forecasting net impact by horizon

We deliver granular, decision-grade intel: market sizing, 5-year forecasts, pricing, adoption, usage, revenue, and operational KPIs—plus competitor tracking, regulation, and value chains—across 60 countries broadly.

Spot the shifts before they hit your P&L. We track inflection points, adoption curves, pricing moves, and ecosystem plays to show where demand is heading, why it is changing, and what to do next across high-growth markets and disruptive tech

Real-time reads of user behavior. We track shifting priorities, perceptions of today’s and next-gen services, and provider experience, then pace how fast tech moves from trial to adoption, blending buyer, consumer, and channel inputs with social signals (#WhySwitch, #UX).

Partner with our analyst team to build a custom report designed around your business priorities. From analysing market trends to assessing competitors or crafting bespoke datasets, we tailor insights to your needs.
Supplier Intelligence
Discovery & Profiling
Capacity & Footprint
Performance & Risk
Compliance & Governance
Commercial Readiness
Who Supplies Whom
Scorecards & Shortlists
Playbooks & Docs
Category Intelligence
Definition & Scope
Demand & Use Cases
Cost Drivers
Market Structure
Supply Chain Map
Trade & Policy
Operating Norms
Deliverables
Buyer Intelligence
Account Basics
Spend & Scope
Procurement Model
Vendor Requirements
Terms & Policies
Entry Strategy
Pain Points & Triggers
Outputs
Pricing Analysis
Benchmarks
Trends
Should-Cost
Indexation
Landed Cost
Commercial Terms
Deliverables
Brand Analysis
Positioning & Value Prop
Share & Presence
Customer Evidence
Go-to-Market
Digital & Reputation
Compliance & Trust
KPIs & Gaps
Outputs
Full Research Suite comprises of:
Market outlook & trends analysis
Interviews & case studies
Strategic recommendations
Vendor profiles & capabilities analysis
5-year forecasts
8 regions and 60+ country-level data splits
Market segment data splits
12 months of continuous data updates
DELIVERED AS:
PDF EXCEL ONLINE
Pharmaceutical Grade Sodium Carbonate Market Forecast and Outlook 2025 to 2035
Pharmaceuticals Grade Sodium Bicarbonate Market Insights - Size, Share & Industry Growth 2025 to 2035
Sodium Chloride Market Size and Share Forecast Outlook 2025 to 2035
Pharmaceutical Grade Magnesium Sulfate Market Size and Share Forecast Outlook 2025 to 2035
Pharmaceutical Grade P-Toluenesulfonic Acid Market Size and Share Forecast Outlook 2025 to 2035
Pharmaceutical Grade Washer Market Trends – Insights & Forecast 2024-2034
Food Grade Sodium Hypochlorite Market Growth -Industry Trends 2025 to 2035
Food Grade Sodium Hydroxide Market
Food Grade Sodium Citrate Market
Food Grade Sodium Carbonate Market
Pharma Grade Sodium Bicarbonate Market 2024-2034
Industrial Grade Sodium Bifluoride Market Forecast and Outlook 2025 to 2035
Demand for Sodium Chloride in EU Size and Share Forecast Outlook 2025 to 2035
Industrial Sodium Chloride Market Size & Trends 2025 to 2035
Ammonium Chloride Food Grade Market Growth - Demand & Trends 2025 to 2035
Pharmaceutical Autoclave Machine Market Size and Share Forecast Outlook 2025 to 2035
Pharmaceutical Excipient SNAC Market Size and Share Forecast Outlook 2025 to 2035
Sodium 3-Nitrobenzenesulfonate Market Size and Share Forecast Outlook 2025 to 2035
Pharmaceutical Zinc Powder Market Size and Share Forecast Outlook 2025 to 2035
Pharmaceutical Secondary Packaging Market Size and Share Forecast Outlook 2025 to 2035

Thank you!
You will receive an email from our Business Development Manager. Please be sure to check your SPAM/JUNK folder too.
Chat With
MaRIA