Reports
- Global Locations -
Headquarters
Future Market Insights, Inc.
Christiana Corporate, 200
Continental Drive, Suite 401,
Newark, Delaware - 19713,
United States
Americas
Future Market Insights, Inc.
616 Corporate Way, Suite 2-9018,
Valley Cottage, NY 10989, United States
MEA
Future Market Insights
1602-6 Jumeirah Bay X2 Tower, Plot No: JLT-PH2-X2A,
Jumeirah Lakes Towers, Dubai,
United Arab Emirates
Europe
Future Market Insights
3rd Floor, 207 Regent Street,
W1B 3HH London
United Kingdom
Asia Pacific
Future Market Insights
Office No. 401-A, 4th Floor,
VANTAGE 9, S.No. 36/1/1,
Baner, Pune 411045, India
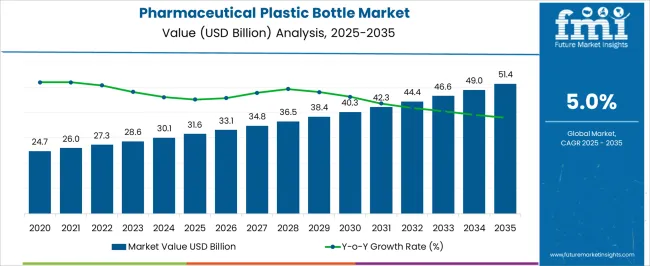
The net worth of the market share of pharmaceutical plastic bottles is predicted to grow from US$ 35.8 Billion in 2023 to over US$ 97.1 Billion by 2033. This is expected to further drive the market share and register a CAGR of 10.5% between 2023 and 2033. During the forecast period, pharmaceutical packaging is expected to drive the market due to the growing demand for the storage and delivery of medicines.
The cost of pharmaceutical plastic bottles is affordable, which makes them easier to procure. Aside from being light in weight and less bulky, pharmaceutical plastic bottles are also easy to transport, thus propelling the market trend.
As a result of its unmatched ability, plastic packaging has witnessed considerable growth in the pharmaceutical industry. Other features that have led to increased adoption in the pharmaceutical industry include a barrier against moisture, high dimensional stability, high impact strength, resistance to strain, low water absorption, transparency, heat, and flame resistance, and extension of expiration dates.
Due to increasing sustainability concerns and a reduction in the pharmaceutical industry's environmental impact, the market for pharmaceutical plastic bottles is growing. Advancements in technology and the use of plastic bottles for solid and liquid oral medicines have contributed to the growth of the pharmaceutical plastic bottle industry.
Although the price of plastics may rise due to fluctuating crude oil prices and various regulations, this may affect the consumption of the product. This may further stall the market's growth.
Increasingly, plastic bottles are used in the industry for biodegradable filling and packaging. In various regions, vendors offer aseptic bottle filling and packaging services. As an example, LSNE offers aseptic dropper bottle-filling services. It has an automated filling line capable of filling 5ml and 10ml multi-dose bottles and sterile multi-dose bottles.
As a result of the significant production of PET resin and polymers in Asia-Pacific, there is no shortage of raw materials for the market to expand. There is no doubt that China is one of the most important producers and consumers of PET bottles in the region.
Attributes | Details |
---|---|
Pharmaceutical Plastic Bottles Market Value (2023) | US$ 35.8 Billion |
Pharmaceutical Plastic Bottles Market Expected Value (2033) | US$ 97.1 Billion |
Pharmaceutical Plastic Bottles Market Projected CAGR (2023 to 2033) | 10.5% |
Don't pay for what you don't need
Customize your report by selecting specific countries or regions and save 30%!
Driven by the growth of the healthcare industry across the globe, the pharmaceutical plastic bottles market is anticipated to rise at 10.5% CAGR from 2023 to 2033 in comparison to the 7.4% CAGR registered from 2017 to 2022.
Pharmaceutical plastic bottles are widely used in the industry for packaging solid and liquid formulations. In the coming years, the demand for pharmaceutical plastic bottles is anticipated to witness a surge along with the expansion of healthcare infrastructure globally.
Traditionally, the use of pharmaceutical glass bottles was common in the industry, but with the introduction of plastic bottles in the market and benefits in cost and weight, the pharmaceutical bottle market has witnessed a drastic transition.
Pharmaceutical plastic bottles are preferred by both, manufacturers and consumers as compared to glass bottles.
The pharmaceutical plastic bottle market has witnessed several technological advancements in terms of parameters such as the type of plastic used, the variety of closures offered, and the extensive range of sizes that have positively impacted sales.
Historical CAGR (2016 to 2022) | 7.4% |
---|---|
Historical Market Value (2022) | US$ 32.5 Billion |
Forecast CAGR (2023 to 2033) | 10.5% |
Pharmaceutical Plastic Bottles Market:
Differentiating Aspects | Pharmaceutical Plastic Bottles Market |
---|---|
CAGR (2023 to 2033) | 10.5% |
Market Valuation in 2023 | US$ 35.8 Billion |
Projected Market Value in 2033 | US$ 97.1 Billion |
Growth Factors | The innovation of new packaging technologies. |
Opportunities | Technological advancement and the rising application of plastic bottles in solid even liquid oral medicines. |
Key Trends | Utilizing post-industrial and post-consumer recycled plastics for raw materials, such as child-resistant closures and counterfeit protection. |
PET Preform Market:
Differentiating Aspects | PET Preform Market |
---|---|
CAGR (2023 to 2033) | 3.9% |
Market Valuation in 2023 | US$ 15.79 Billion |
Projected Market Value in 2033 | US$ 23.15 Billion |
Growth Factors | The food and beverage segment has been experiencing increasing demand, particularly for carbonated soft drinks and water. |
Opportunities | An enormous amount of demand from a wide variety of end users. |
Key Trends | There's been a surge in recycled plastics used in manufacturing, plus PET products have lots of benefits. |
Antimicrobial Nanocoating Market:
Differentiating Aspects | Antimicrobial Nanocoating Market |
---|---|
CAGR (2023 to 2033) | 20.3% |
Market Valuation in 2023 | US$ 1119.3 Million |
Projected Market Value in 2033 | US$ 7106.21 Million |
Growth Factors | Substantial development in the medical & healthcare industry & high demand for microbes-free coatings. |
Opportunities | With the ability to reduce the risk of microbes such as E. coli and legionella, these devices are expected to gain considerable popularity in the healthcare industry. |
Key Trends | Increasing investments by key players in the manufacturing industries through domestic and foreign direct investment. |
Innovation is Crucial for Market Growth
The introduction of child-resistant closures is one of the key technological advancements that has augmented the growth of the industry. Child-resistant solutions generally come in two-piece push and turn pieces.
The increase in the number of poisoning cases in underage children caused by accidental ingestion of medicines was a growing concern among consumers which is drastically reduced by child-resistant packaging solutions.
Anti-counterfeit solutions also have gained tremendous popularity among manufacturers. The introduction of anti-counterfeit technologies like barcodes, labels, tags, and more to minimize counterfeiting is gaining traction in the target industry.
Along with the above-mentioned solutions, RFID and QR codes are some of the key advancements in the pharmaceutical plastic bottle market. These innovations and technological advancements are bolstering growth.
Key Market Players' Strategies for Growing their Businesses
Several growth strategies are being adopted by key players to stay competitive in the highly competitive hybrid additive manufacturing market. These strategies include mergers, acquisitions, upcoming product launches, innovations, partnerships, and collaborations.
For instance, in November 2018, Comor, a USA-based packaging company, acquired Shore Plastic Technologies, a manufacturer of pharmaceuticals, medical devices, diagnostic equipment, and consumer products.
Stronger engineering capability and improved design will be achieved as a result of the acquisition, allowing the company to better serve its customers. A significant impact on the growth of the pharmaceutical plastic bottles market will be generated by new business growth strategies by key players in the upcoming years.
Get the data you need at a Fraction of the cost
Personalize your report by choosing insights you need
and save 40%!
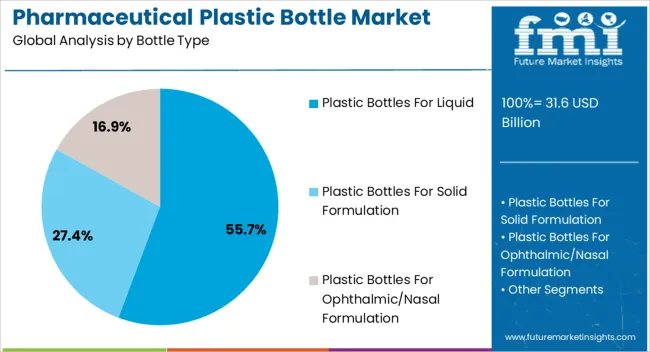
Based on bottle type, plastic bottles for ophthalmic/nasal formulations have emerged as leading contributors to growth. The segment will account for over 42.7% of sales in 2023.
The rise in the applications of corticosteroid drugs in nasal formulations for a variety of treatments is boosting consumption. Furthermore, the increasing problem of pollution-related eye allergies is an important factor bolstering demand.
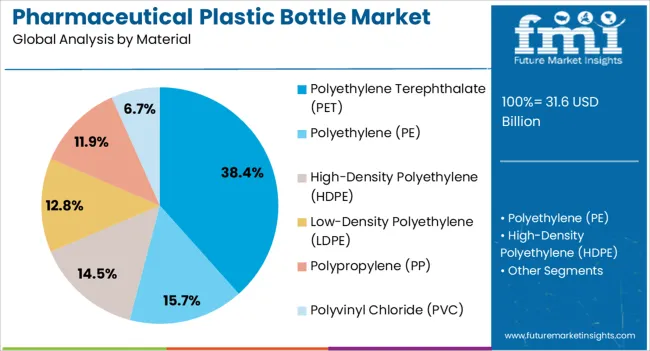
The polyethylene terephthalate (PET) segment is expected to surpass a valuation of US$ 9.2 Billion in the year 2023. As per the FMI analysis, the use of polyethylene terephthalate (PET) is growing at a comparatively higher rate.
The increasing restrictions and regulations globally on the usage of plastics have compelled manufacturers to increase the utilization of recycled polyethylene terephthalate (PET) for the production of pharmaceutical plastic bottles. Moreover, polyethylene terephthalate (PET) has a comparatively higher barrier strength and recyclability making it a favorable choice.
On the back of these factors, the consumption of polyethylene terephthalate (PET) is anticipated to increase at a CAGR of 11.4% during the forecast period.
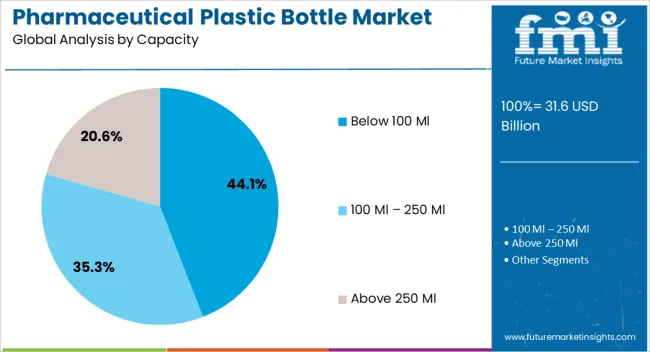
Bottles with a capacity below 100 ml are anticipated to hold a major market share by 2033 accounting for over 51% of the market. With an increasing preference towards smaller packaging, the demand for below 100 capacity bottles is experiencing an upward trend.
Below 100 ml capacity bottles are widely used in the packaging of ophthalmic and nasal formulations which is projected to be the fastest-growing segment in the bottle type category. On the back of these factors, the below 100 ml capacity bottles are anticipated to expand at a CAGR of 11.2% through 2033.
Segment | Top Bottle Type |
---|---|
Attributes | Plastic Bottles for Solid Formulation |
Historical CAGR | 6.2% |
Forecasted CAGR | 8.6% |
Segment | Top Material Type |
---|---|
Attributes | Polyethylene Terephthalate |
Historical CAGR | 8.4% |
Forecasted CAGR | 11.4% |
Region | North America |
---|---|
Countries | United States of America |
Historical CAGR | 6.6% |
CAGR | 9.6% |
Market Value (2022) | US$ 9.3 Billion |
Market Value (2033) | US$ 15.6 Billion |
Region | Europe |
---|---|
Countries | United Kingdom, Germany |
Historical CAGR | 5.1%, 3.8% |
CAGR | 8.2%, 6.8% |
Market Value (2022) | US$ 1.7 Billion, US$ 1.4 Billion |
Market Value (2033) | US$ 3.1 Billion, US$ 2.9 Billion |
Region | Asia Pacific |
---|---|
Countries | China, India |
Historical CAGR | 9%, 10.7% |
CAGR | 11.4%, 13.4% |
Market Value (2022) | US$ 7.7 Billion, US$ 6.4 Billion |
Market Value (2033) | US$ 11.6 Billion, US$ 8.9 Billion |
North America is predicted to remain one of the most attractive markets during the forecast period, according to Future Market Insights. According to the study, the USA is expected to account for over 79.1% of the North American market through 2033.
The high healthcare spending of the country is one of the main factors supporting market growth. In North America, the USA dominates the pharmaceutical plastic bottles market and is anticipated to expand 2.5 times its current market size by the year 2033.
As per the FMI analysis, the USA is projected to generate substantial demand for pharmaceutical plastic bottles for the coming decade. The strong desire for an exceptional healthcare system in the USA amongst the population and favorable state policies has bolstered the growth of the healthcare industry in the country.
According to the Organization for Economic Co-operation and Development (OECD), the USA was the country with the highest per capita healthcare spending totaling US$ 11,072 Million in the year 2019.
The USA remains one of the world's largest markets for pharmaceuticals, making it a lucrative market for pharmaceutical plastic bottle manufacturers. Rising cases of chronic diseases, a growing overall population, and high medical care awareness among Americans will drive growth.
The demand for pharmaceutical plastic bottles in the UK is expected to rise at nearly 8.2% CAGR over the forecast period. The UK has a significantly developed and advanced healthcare system owing to the efforts of the government.
The pharmaceutical plastic bottles market in the country is evolving steadily as a result of factors such as the rise in the number of manufacturers, the rapidly growing pharmaceutical industry, and high consumer attentiveness towards healthcare.
The country is projected to be the second-largest market shareholder in Europe after Russia and is anticipated to cover over 15.1% of the Europe market by the year 2033.
China is projected to account for over 59% of the pharmaceutical plastic bottle market in East Asia. The cost of manufacturing is significantly lower in the country along with the availability of inexpensive labor and a vast consumer pool, which is attracting many manufacturers.
China also remains one of Asia’s largest markets for pharmaceuticals, making it lucrative for pharmaceutical plastic bottle manufacturers. Furthermore, the growing population, rise in cases of chronic diseases, and high medical care awareness among the population will drive growth in the market. The market in China is estimated to grow at a CAGR of 11.4% during the forecast period.
Driven by the expansion of the healthcare industry, the market in India is expected to surpass US$ 3.2 Billion worth by 2023 end. Government initiatives undertaken to give quality and affordable healthcare facilities are anticipated to supplement the development of India's pharmaceutical plastic bottle market.
As per the India Brand Equity Foundation (IBEF), the Indian healthcare market is expected to reach US$ 372 billion by the year 2022. The expansion of healthcare infrastructure in the country in both urban and rural areas is fuelling growth.
The consistently evolving healthcare industry and promising government policies are some of the factors creating opportunities to boost the sales of pharmaceutical plastic bottles during the forecast period.
Despite fierce competition in the pharmaceutical plastic bottle market, manufacturers are constantly upgrading their products and coming up with new features to differentiate their products from others.
As an example, Gerresheimer AG, a German packaging company, has launched the Biopack brand of pharmaceutical products. These include plastic bottles made from sugarcane ethanol and then converted into green polyethylene.
Gerresheimer Biopack can be used for the packaging of liquid and solid pharmaceuticals with properties similar to traditional polyethylene and polyethylene terephthalate. The introduction of such advanced products by key players will likely contribute significantly to the growth of the pharmaceutical plastic bottle market in the years to come.
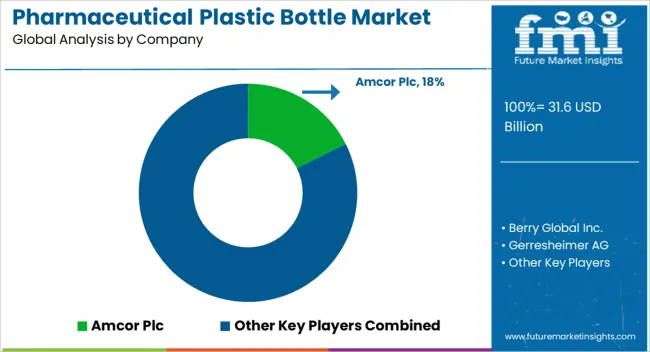
Some of the prominent players in the pharmaceutical plastic bottles market are as follows:
Recent Development:
Companies operating in the pharmaceutical plastic bottles market are aiming for expansions and strategic partnerships with other manufacturers to expand their product manufacturing capabilities, portfolios, and global presence.
Attribute | Details |
---|---|
Forecast Period | 2023 to 2033 |
Historical Data Available for | 2018 to 2023 |
Market Analysis | US$ Million for Value and MT for Volume |
Key Regions Covered |
|
Key Countries Covered | USA, Canada, Brazil, Mexico, Chile, Peru, Germany, UK., Spain, Italy, France, Russia, Poland, China, India, Japan, Australia, New Zealand, GCC Countries, North Africa, South Africa, and Turkey |
Key Segments Covered |
|
Key Companies Profiled |
|
Report Coverage | Market Forecast, Company Share Analysis, Competition Intelligence, Drivers, Restraints, Opportunities and Threats Analysis, Market Dynamics and Challenges, and Strategic Growth Initiatives |
Customization & Pricing | Available upon Request |
1. Executive Summary | Pharmaceutical Plastic Bottles Market 1.1. Global Market Outlook 1.2. Demand-side Trends 1.3. Supply-side Trends 1.4. Technology Roadmap Analysis 1.5. Analysis and Recommendations 2. Market Overview 2.1. Market Coverage / Taxonomy 2.2. Market Definition / Scope / Limitations 3. Market Background 3.1. Market Dynamics 3.1.1. Drivers 3.1.2. Restraints 3.1.3. Opportunity 3.1.4. Trends 3.2. Scenario Forecast 3.2.1. Demand in Optimistic Scenario 3.2.2. Demand in Likely Scenario 3.2.3. Demand in Conservative Scenario 3.3. Opportunity Map Analysis 3.4. Product Life Cycle Analysis 3.5. Supply Chain Analysis 3.5.1. Supply Side Participants and their Roles 3.5.1.1. Producers 3.5.1.2. Mid-Level Participants (Traders/ Agents/ Brokers) 3.5.1.3. Wholesalers and Distributors 3.5.2. Value Added and Value Created at Node in the Supply Chain 3.5.3. List of Raw Material Suppliers 3.5.4. List of Existing and Potential Buyers 3.6. Investment Feasibility Matrix 3.7. Value Chain Analysis 3.7.1. Profit Margin Analysis 3.7.2. Wholesalers and Distributors 3.7.3. Retailers 3.8. PESTLE and Porter’s Analysis 3.9. Regulatory Landscape 3.9.1. By Key Regions 3.9.2. By Key Countries 3.10. Regional Parent Market Outlook 3.11. Production and Consumption Statistics 3.12. Import and Export Statistics 4. Global Market Analysis 2017 to 2022 and Forecast, 2023 to 2033 4.1. Historical Market Size Value (US$ Million) & Volume (Million Units) Analysis, 2017 to 2022 4.2. Current and Future Market Size Value (US$ Million) & Volume (Million Units) Projections, 2023 to 2033 4.2.1. Y-o-Y Growth Trend Analysis 4.2.2. Absolute $ Opportunity Analysis 5. Global Market Analysis 2017 to 2022 and Forecast 2023 to 2033, By Bottle Type 5.1. Introduction / Key Findings 5.2. Historical Market Size Value (US$ Million) & Volume (Million Units) Analysis By Bottle Type, 2017 to 2022 5.3. Current and Future Market Size Value (US$ Million) & Volume (Million Units) Analysis and Forecast By Bottle Type, 2023 to 2033 5.3.1. Plastic Bottles For Solid Formulation 5.3.2. Plastic Bottles For Liquid 5.3.3. Plastic Bottles For Ophthalmic/Nasal Formulation 5.4. Y-o-Y Growth Trend Analysis By Bottle Type, 2017 to 2022 5.5. Absolute $ Opportunity Analysis By Bottle Type, 2023 to 2033 6. Global Market Analysis 2017 to 2022 and Forecast 2023 to 2033, By Material Type 6.1. Introduction / Key Findings 6.2. Historical Market Size Value (US$ Million) & Volume (Million Units) Analysis By Material Type, 2017 to 2022 6.3. Current and Future Market Size Value (US$ Million) & Volume (Million Units) Analysis and Forecast By Material Type, 2023 to 2033 6.3.1. Polyethylene 6.3.1.1. High-density polyethylene 6.3.1.2. Low-density polyethylene 6.3.2. Polyethylene Terephthalate 6.3.3. Polypropylene 6.3.4. Polyvinyl Chloride 6.4. Y-o-Y Growth Trend Analysis By Material Type, 2017 to 2022 6.5. Absolute $ Opportunity Analysis By Material Type, 2023 to 2033 7. Global Market Analysis 2017 to 2022 and Forecast 2023 to 2033, By Capacity 7.1. Introduction / Key Findings 7.2. Historical Market Size Value (US$ Million) & Volume (Million Units) Analysis By Capacity, 2017 to 2022 7.3. Current and Future Market Size Value (US$ Million) & Volume (Million Units) Analysis and Forecast By Capacity, 2023 to 2033 7.3.1. Below 100 ml 7.3.2. 100 ml – 250 ml 7.3.3. Above 250 ml 7.4. Y-o-Y Growth Trend Analysis By Capacity, 2017 to 2022 7.5. Absolute $ Opportunity Analysis By Capacity, 2023 to 2033 8. Global Market Analysis 2017 to 2022 and Forecast 2023 to 2033, By Region 8.1. Introduction 8.2. Historical Market Size Value (US$ Million) & Volume (Million Units) Analysis By Region, 2017 to 2022 8.3. Current Market Size Value (US$ Million) & Volume (Million Units) Analysis and Forecast By Region, 2023 to 2033 8.3.1. North America 8.3.2. Latin America 8.3.3. Europe 8.3.4. East Asia 8.3.5. South Asia 8.3.6. Middle East and Africa 8.3.7. Oceania 8.4. Market Attractiveness Analysis By Region 9. North America Market Analysis 2017 to 2022 and Forecast 2023 to 2033, By Country 9.1. Historical Market Size Value (US$ Million) & Volume (Million Units) Trend Analysis By Market Taxonomy, 2017 to 2022 9.2. Market Size Value (US$ Million) & Volume (Million Units) Forecast By Market Taxonomy, 2023 to 2033 9.2.1. By Country 9.2.1.1. United States of America 9.2.1.2. Canada 9.2.2. By Bottle Type 9.2.3. By Material Type 9.2.4. By Capacity 9.3. Market Attractiveness Analysis 9.3.1. By Country 9.3.2. By Bottle Type 9.3.3. By Material Type 9.3.4. By Capacity 9.4. Key Takeaways 10. Latin America Market Analysis 2017 to 2022 and Forecast 2023 to 2033, By Country 10.1. Historical Market Size Value (US$ Million) & Volume (Million Units) Trend Analysis By Market Taxonomy, 2017 to 2022 10.2. Market Size Value (US$ Million) & Volume (Million Units) Forecast By Market Taxonomy, 2023 to 2033 10.2.1. By Country 10.2.1.1. Brazil 10.2.1.2. Mexico 10.2.1.3. Argentina 10.2.1.4. Rest of Latin America 10.2.2. By Bottle Type 10.2.3. By Material Type 10.2.4. By Capacity 10.3. Market Attractiveness Analysis 10.3.1. By Country 10.3.2. By Bottle Type 10.3.3. By Material Type 10.3.4. By Capacity 10.4. Key Takeaways 11. Europe Market Analysis 2017 to 2022 and Forecast 2023 to 2033, By Country 11.1. Historical Market Size Value (US$ Million) & Volume (Million Units) Trend Analysis By Market Taxonomy, 2017 to 2022 11.2. Market Size Value (US$ Million) & Volume (Million Units) Forecast By Market Taxonomy, 2023 to 2033 11.2.1. By Country 11.2.1.1. Germany 11.2.1.2. France 11.2.1.3. United Kingdom 11.2.1.4. Italy 11.2.1.5. Spain 11.2.1.6. Benelux 11.2.1.7. Nordics 11.2.1.8. Russia 11.2.1.9. Poland 11.2.1.10. Rest of Europe 11.2.2. By Bottle Type 11.2.3. By Material Type 11.2.4. By Capacity 11.3. Market Attractiveness Analysis 11.3.1. By Country 11.3.2. By Bottle Type 11.3.3. By Material Type 11.3.4. By Capacity 11.4. Key Takeaways 12. East Asia Market Analysis 2017 to 2022 and Forecast 2023 to 2033, By Country 12.1. Historical Market Size Value (US$ Million) & Volume (Million Units) Trend Analysis By Market Taxonomy, 2017 to 2022 12.2. Market Size Value (US$ Million) & Volume (Million Units) Forecast By Market Taxonomy, 2023 to 2033 12.2.1. By Country 12.2.1.1. China 12.2.1.2. Japan 12.2.1.3. South Korea 12.2.2. By Bottle Type 12.2.3. By Material Type 12.2.4. By Capacity 12.3. Market Attractiveness Analysis 12.3.1. By Country 12.3.2. By Bottle Type 12.3.3. By Material Type 12.3.4. By Capacity 12.4. Key Takeaways 13. South Asia Market Analysis 2017 to 2022 and Forecast 2023 to 2033, By Country 13.1. Historical Market Size Value (US$ Million) & Volume (Million Units) Trend Analysis By Market Taxonomy, 2017 to 2022 13.2. Market Size Value (US$ Million) & Volume (Million Units) Forecast By Market Taxonomy, 2023 to 2033 13.2.1. By Country 13.2.1.1. India 13.2.1.2. Thailand 13.2.1.3. Indonesia 13.2.1.4. Malaysia 13.2.1.5. Rest of South Asia 13.2.2. By Bottle Type 13.2.3. By Material Type 13.2.4. By Capacity 13.3. Market Attractiveness Analysis 13.3.1. By Country 13.3.2. By Bottle Type 13.3.3. By Material Type 13.3.4. By Capacity 13.4. Key Takeaways 14. Middle East and Africa Market Analysis 2017 to 2022 and Forecast 2023 to 2033, By Country 14.1. Historical Market Size Value (US$ Million) & Volume (Million Units) Trend Analysis By Market Taxonomy, 2017 to 2022 14.2. Market Size Value (US$ Million) & Volume (Million Units) Forecast By Market Taxonomy, 2023 to 2033 14.2.1. By Country 14.2.1.1. GCC Countries 14.2.1.2. Turkey 14.2.1.3. Northern Africa 14.2.1.4. South Africa 14.2.1.5. Rest of Middle East and Africa 14.2.2. By Bottle Type 14.2.3. By Material Type 14.2.4. By Capacity 14.3. Market Attractiveness Analysis 14.3.1. By Country 14.3.2. By Bottle Type 14.3.3. By Material Type 14.3.4. By Capacity 14.4. Key Takeaways 15. Oceania Market Analysis 2017 to 2022 and Forecast 2023 to 2033, By Country 15.1. Historical Market Size Value (US$ Million) & Volume (Million Units) Trend Analysis By Market Taxonomy, 2017 to 2022 15.2. Market Size Value (US$ Million) & Volume (Million Units) Forecast By Market Taxonomy, 2023 to 2033 15.2.1. By Country 15.2.1.1. Australia 15.2.1.2. New Zealand 15.2.2. By Bottle Type 15.2.3. By Material Type 15.2.4. By Capacity 15.3. Market Attractiveness Analysis 15.3.1. By Country 15.3.2. By Bottle Type 15.3.3. By Material Type 15.3.4. By Capacity 15.4. Key Takeaways 16. Key Countries Market Analysis 16.1. United States of America 16.1.1. Pricing Analysis 16.1.2. Market Share Analysis, 2022 16.1.2.1. By Bottle Type 16.1.2.2. By Material Type 16.1.2.3. By Capacity 16.2. Canada 16.2.1. Pricing Analysis 16.2.2. Market Share Analysis, 2022 16.2.2.1. By Bottle Type 16.2.2.2. By Material Type 16.2.2.3. By Capacity 16.3. Brazil 16.3.1. Pricing Analysis 16.3.2. Market Share Analysis, 2022 16.3.2.1. By Bottle Type 16.3.2.2. By Material Type 16.3.2.3. By Capacity 16.4. Mexico 16.4.1. Pricing Analysis 16.4.2. Market Share Analysis, 2022 16.4.2.1. By Bottle Type 16.4.2.2. By Material Type 16.4.2.3. By Capacity 16.5. Argentina 16.5.1. Pricing Analysis 16.5.2. Market Share Analysis, 2022 16.5.2.1. By Bottle Type 16.5.2.2. By Material Type 16.5.2.3. By Capacity 16.6. Germany 16.6.1. Pricing Analysis 16.6.2. Market Share Analysis, 2022 16.6.2.1. By Bottle Type 16.6.2.2. By Material Type 16.6.2.3. By Capacity 16.7. France 16.7.1. Pricing Analysis 16.7.2. Market Share Analysis, 2022 16.7.2.1. By Bottle Type 16.7.2.2. By Material Type 16.7.2.3. By Capacity 16.8. United Kingdom 16.8.1. Pricing Analysis 16.8.2. Market Share Analysis, 2022 16.8.2.1. By Bottle Type 16.8.2.2. By Material Type 16.8.2.3. By Capacity 16.9. Italy 16.9.1. Pricing Analysis 16.9.2. Market Share Analysis, 2022 16.9.2.1. By Bottle Type 16.9.2.2. By Material Type 16.9.2.3. By Capacity 16.10. Spain 16.10.1. Pricing Analysis 16.10.2. Market Share Analysis, 2022 16.10.2.1. By Bottle Type 16.10.2.2. By Material Type 16.10.2.3. By Capacity 16.11. Benelux 16.11.1. Pricing Analysis 16.11.2. Market Share Analysis, 2022 16.11.2.1. By Bottle Type 16.11.2.2. By Material Type 16.11.2.3. By Capacity 16.12. Nordics 16.12.1. Pricing Analysis 16.12.2. Market Share Analysis, 2022 16.12.2.1. By Bottle Type 16.12.2.2. By Material Type 16.12.2.3. By Capacity 16.13. Russia 16.13.1. Pricing Analysis 16.13.2. Market Share Analysis, 2022 16.13.2.1. By Bottle Type 16.13.2.2. By Material Type 16.13.2.3. By Capacity 16.14. Poland 16.14.1. Pricing Analysis 16.14.2. Market Share Analysis, 2022 16.14.2.1. By Bottle Type 16.14.2.2. By Material Type 16.14.2.3. By Capacity 16.15. China 16.15.1. Pricing Analysis 16.15.2. Market Share Analysis, 2022 16.15.2.1. By Bottle Type 16.15.2.2. By Material Type 16.15.2.3. By Capacity 16.16. Japan 16.16.1. Pricing Analysis 16.16.2. Market Share Analysis, 2022 16.16.2.1. By Bottle Type 16.16.2.2. By Material Type 16.16.2.3. By Capacity 16.17. South Korea 16.17.1. Pricing Analysis 16.17.2. Market Share Analysis, 2022 16.17.2.1. By Bottle Type 16.17.2.2. By Material Type 16.17.2.3. By Capacity 16.18. India 16.18.1. Pricing Analysis 16.18.2. Market Share Analysis, 2022 16.18.2.1. By Bottle Type 16.18.2.2. By Material Type 16.18.2.3. By Capacity 16.19. Thailand 16.19.1. Pricing Analysis 16.19.2. Market Share Analysis, 2022 16.19.2.1. By Bottle Type 16.19.2.2. By Material Type 16.19.2.3. By Capacity 16.20. Indonesia 16.20.1. Pricing Analysis 16.20.2. Market Share Analysis, 2022 16.20.2.1. By Bottle Type 16.20.2.2. By Material Type 16.20.2.3. By Capacity 16.21. Malaysia 16.21.1. Pricing Analysis 16.21.2. Market Share Analysis, 2022 16.21.2.1. By Bottle Type 16.21.2.2. By Material Type 16.21.2.3. By Capacity 16.22. GCC Countries 16.22.1. Pricing Analysis 16.22.2. Market Share Analysis, 2022 16.22.2.1. By Bottle Type 16.22.2.2. By Material Type 16.22.2.3. By Capacity 16.23. Turkey 16.23.1. Pricing Analysis 16.23.2. Market Share Analysis, 2022 16.23.2.1. By Bottle Type 16.23.2.2. By Material Type 16.23.2.3. By Capacity 16.24. Northern Africa 16.24.1. Pricing Analysis 16.24.2. Market Share Analysis, 2022 16.24.2.1. By Bottle Type 16.24.2.2. By Material Type 16.24.2.3. By Capacity 16.25. South Africa 16.25.1. Pricing Analysis 16.25.2. Market Share Analysis, 2022 16.25.2.1. By Bottle Type 16.25.2.2. By Material Type 16.25.2.3. By Capacity 16.26. Australia 16.26.1. Pricing Analysis 16.26.2. Market Share Analysis, 2022 16.26.2.1. By Bottle Type 16.26.2.2. By Material Type 16.26.2.3. By Capacity 16.27. New Zealand 16.27.1. Pricing Analysis 16.27.2. Market Share Analysis, 2022 16.27.2.1. By Bottle Type 16.27.2.2. By Material Type 16.27.2.3. By Capacity 17. Market Structure Analysis 17.1. Competition Dashboard 17.2. Competition Benchmarking 17.3. Market Share Analysis of Top Players 17.3.1. By Regional 17.3.2. By Bottle Type 17.3.3. By Material Type 17.3.4. By Capacity 18. Competition Analysis 18.1. Competition Deep Dive 18.1.1. Berry Global Inc. 18.1.1.1. Overview 18.1.1.2. Product Portfolio 18.1.1.3. Profitability by Market Segments 18.1.1.4. Sales Footprint 18.1.1.5. Strategy Overview 18.1.1.5.1. Marketing Strategy 18.1.1.5.2. Product Strategy 18.1.1.5.3. Channel Strategy 18.1.2. Amcor Plc 18.1.2.1. Overview 18.1.2.2. Product Portfolio 18.1.2.3. Profitability by Market Segments 18.1.2.4. Sales Footprint 18.1.2.5. Strategy Overview 18.1.2.5.1. Marketing Strategy 18.1.2.5.2. Product Strategy 18.1.2.5.3. Channel Strategy 18.1.3. Gerresheimer AG 18.1.3.1. Overview 18.1.3.2. Product Portfolio 18.1.3.3. Profitability by Market Segments 18.1.3.4. Sales Footprint 18.1.3.5. Strategy Overview 18.1.3.5.1. Marketing Strategy 18.1.3.5.2. Product Strategy 18.1.3.5.3. Channel Strategy 18.1.4. AptarGroup, Inc. 18.1.4.1. Overview 18.1.4.2. Product Portfolio 18.1.4.3. Profitability by Market Segments 18.1.4.4. Sales Footprint 18.1.4.5. Strategy Overview 18.1.4.5.1. Marketing Strategy 18.1.4.5.2. Product Strategy 18.1.4.5.3. Channel Strategy 18.1.5. O. Berk Company, LLC 18.1.5.1. Overview 18.1.5.2. Product Portfolio 18.1.5.3. Profitability by Market Segments 18.1.5.4. Sales Footprint 18.1.5.5. Strategy Overview 18.1.5.5.1. Marketing Strategy 18.1.5.5.2. Product Strategy 18.1.5.5.3. Channel Strategy 18.1.6. Alpha Packaging Holdings, Inc. 18.1.6.1. Overview 18.1.6.2. Product Portfolio 18.1.6.3. Profitability by Market Segments 18.1.6.4. Sales Footprint 18.1.6.5. Strategy Overview 18.1.6.5.1. Marketing Strategy 18.1.6.5.2. Product Strategy 18.1.6.5.3. Channel Strategy 18.1.7. Comar, LLC 18.1.7.1. Overview 18.1.7.2. Product Portfolio 18.1.7.3. Profitability by Market Segments 18.1.7.4. Sales Footprint 18.1.7.5. Strategy Overview 18.1.7.5.1. Marketing Strategy 18.1.7.5.2. Product Strategy 18.1.7.5.3. Channel Strategy 18.1.8. Alpack Inc. 18.1.8.1. Overview 18.1.8.2. Product Portfolio 18.1.8.3. Profitability by Market Segments 18.1.8.4. Sales Footprint 18.1.8.5. Strategy Overview 18.1.8.5.1. Marketing Strategy 18.1.8.5.2. Product Strategy 18.1.8.5.3. Channel Strategy 18.1.9. ALPLA Werke Alwin Lehner GmbH & Co KG 18.1.9.1. Overview 18.1.9.2. Product Portfolio 18.1.9.3. Profitability by Market Segments 18.1.9.4. Sales Footprint 18.1.9.5. Strategy Overview 18.1.9.5.1. Marketing Strategy 18.1.9.5.2. Product Strategy 18.1.9.5.3. Channel Strategy 18.1.10. Drug Plastics Group 18.1.10.1. Overview 18.1.10.2. Product Portfolio 18.1.10.3. Profitability by Market Segments 18.1.10.4. Sales Footprint 18.1.10.5. Strategy Overview 18.1.10.5.1. Marketing Strategy 18.1.10.5.2. Product Strategy 18.1.10.5.3. Channel Strategy 18.1.11. Bormioli Pharma S.p.a. 18.1.11.1. Overview 18.1.11.2. Product Portfolio 18.1.11.3. Profitability by Market Segments 18.1.11.4. Sales Footprint 18.1.11.5. Strategy Overview 18.1.11.5.1. Marketing Strategy 18.1.11.5.2. Product Strategy 18.1.11.5.3. Channel Strategy 18.1.12. C.L.Smith Company 18.1.12.1. Overview 18.1.12.2. Product Portfolio 18.1.12.3. Profitability by Market Segments 18.1.12.4. Sales Footprint 18.1.12.5. Strategy Overview 18.1.12.5.1. Marketing Strategy 18.1.12.5.2. Product Strategy 18.1.12.5.3. Channel Strategy 18.1.13. Value (US$ Million) & Volume (Million Units)ed States Plastic Corporation 18.1.13.1. Overview 18.1.13.2. Product Portfolio 18.1.13.3. Profitability by Market Segments 18.1.13.4. Sales Footprint 18.1.13.5. Strategy Overview 18.1.13.5.1. Marketing Strategy 18.1.13.5.2. Product Strategy 18.1.13.5.3. Channel Strategy 18.1.14. Weener Plastics Group BV 18.1.14.1. Overview 18.1.14.2. Product Portfolio 18.1.14.3. Profitability by Market Segments 18.1.14.4. Sales Footprint 18.1.14.5. Strategy Overview 18.1.14.5.1. Marketing Strategy 18.1.14.5.2. Product Strategy 18.1.14.5.3. Channel Strategy 18.1.15. Origin Pharma Packaging 18.1.15.1. Overview 18.1.15.2. Product Portfolio 18.1.15.3. Profitability by Market Segments 18.1.15.4. Sales Footprint 18.1.15.5. Strategy Overview 18.1.15.5.1. Marketing Strategy 18.1.15.5.2. Product Strategy 18.1.15.5.3. Channel Strategy 18.1.16. Pretium Packaging Corporation 18.1.16.1. Overview 18.1.16.2. Product Portfolio 18.1.16.3. Profitability by Market Segments 18.1.16.4. Sales Footprint 18.1.16.5. Strategy Overview 18.1.16.5.1. Marketing Strategy 18.1.16.5.2. Product Strategy 18.1.16.5.3. Channel Strategy 18.1.17. Pro-Pac Packaging Group Pty Ltd 18.1.17.1. Overview 18.1.17.2. Product Portfolio 18.1.17.3. Profitability by Market Segments 18.1.17.4. Sales Footprint 18.1.17.5. Strategy Overview 18.1.17.5.1. Marketing Strategy 18.1.17.5.2. Product Strategy 18.1.17.5.3. Channel Strategy 19. Assumptions & Acronyms Used 20. Research Methodology
Don't pay for what you don't need
Customize your report by selecting specific countries or regions and save 30%!
Table 1: Global Market Value (US$ Million) Forecast by Region, 2017 to 2033 Table 2: Global Market Volume (Million Units) Forecast by Region, 2017 to 2033 Table 3: Global Market Value (US$ Million) Forecast by Bottle Type, 2017 to 2033 Table 4: Global Market Volume (Million Units) Forecast by Bottle Type, 2017 to 2033 Table 5: Global Market Value (US$ Million) Forecast by Material Type, 2017 to 2033 Table 6: Global Market Volume (Million Units) Forecast by Material Type, 2017 to 2033 Table 7: Global Market Value (US$ Million) Forecast by Capacity, 2017 to 2033 Table 8: Global Market Volume (Million Units) Forecast by Capacity, 2017 to 2033 Table 9: North America Market Value (US$ Million) Forecast by Country, 2017 to 2033 Table 10: North America Market Volume (Million Units) Forecast by Country, 2017 to 2033 Table 11: North America Market Value (US$ Million) Forecast by Bottle Type, 2017 to 2033 Table 12: North America Market Volume (Million Units) Forecast by Bottle Type, 2017 to 2033 Table 13: North America Market Value (US$ Million) Forecast by Material Type, 2017 to 2033 Table 14: North America Market Volume (Million Units) Forecast by Material Type, 2017 to 2033 Table 15: North America Market Value (US$ Million) Forecast by Capacity, 2017 to 2033 Table 16: North America Market Volume (Million Units) Forecast by Capacity, 2017 to 2033 Table 17: Latin America Market Value (US$ Million) Forecast by Country, 2017 to 2033 Table 18: Latin America Market Volume (Million Units) Forecast by Country, 2017 to 2033 Table 19: Latin America Market Value (US$ Million) Forecast by Bottle Type, 2017 to 2033 Table 20: Latin America Market Volume (Million Units) Forecast by Bottle Type, 2017 to 2033 Table 21: Latin America Market Value (US$ Million) Forecast by Material Type, 2017 to 2033 Table 22: Latin America Market Volume (Million Units) Forecast by Material Type, 2017 to 2033 Table 23: Latin America Market Value (US$ Million) Forecast by Capacity, 2017 to 2033 Table 24: Latin America Market Volume (Million Units) Forecast by Capacity, 2017 to 2033 Table 25: Europe Market Value (US$ Million) Forecast by Country, 2017 to 2033 Table 26: Europe Market Volume (Million Units) Forecast by Country, 2017 to 2033 Table 27: Europe Market Value (US$ Million) Forecast by Bottle Type, 2017 to 2033 Table 28: Europe Market Volume (Million Units) Forecast by Bottle Type, 2017 to 2033 Table 29: Europe Market Value (US$ Million) Forecast by Material Type, 2017 to 2033 Table 30: Europe Market Volume (Million Units) Forecast by Material Type, 2017 to 2033 Table 31: Europe Market Value (US$ Million) Forecast by Capacity, 2017 to 2033 Table 32: Europe Market Volume (Million Units) Forecast by Capacity, 2017 to 2033 Table 33: East Asia Market Value (US$ Million) Forecast by Country, 2017 to 2033 Table 34: East Asia Market Volume (Million Units) Forecast by Country, 2017 to 2033 Table 35: East Asia Market Value (US$ Million) Forecast by Bottle Type, 2017 to 2033 Table 36: East Asia Market Volume (Million Units) Forecast by Bottle Type, 2017 to 2033 Table 37: East Asia Market Value (US$ Million) Forecast by Material Type, 2017 to 2033 Table 38: East Asia Market Volume (Million Units) Forecast by Material Type, 2017 to 2033 Table 39: East Asia Market Value (US$ Million) Forecast by Capacity, 2017 to 2033 Table 40: East Asia Market Volume (Million Units) Forecast by Capacity, 2017 to 2033 Table 41: South Asia Market Value (US$ Million) Forecast by Country, 2017 to 2033 Table 42: South Asia Market Volume (Million Units) Forecast by Country, 2017 to 2033 Table 43: South Asia Market Value (US$ Million) Forecast by Bottle Type, 2017 to 2033 Table 44: South Asia Market Volume (Million Units) Forecast by Bottle Type, 2017 to 2033 Table 45: South Asia Market Value (US$ Million) Forecast by Material Type, 2017 to 2033 Table 46: South Asia Market Volume (Million Units) Forecast by Material Type, 2017 to 2033 Table 47: South Asia Market Value (US$ Million) Forecast by Capacity, 2017 to 2033 Table 48: South Asia Market Volume (Million Units) Forecast by Capacity, 2017 to 2033 Table 49: Middle East and Africa Market Value (US$ Million) Forecast by Country, 2017 to 2033 Table 50: Middle East and Africa Market Volume (Million Units) Forecast by Country, 2017 to 2033 Table 51: Middle East and Africa Market Value (US$ Million) Forecast by Bottle Type, 2017 to 2033 Table 52: Middle East and Africa Market Volume (Million Units) Forecast by Bottle Type, 2017 to 2033 Table 53: Middle East and Africa Market Value (US$ Million) Forecast by Material Type, 2017 to 2033 Table 54: Middle East and Africa Market Volume (Million Units) Forecast by Material Type, 2017 to 2033 Table 55: Middle East and Africa Market Value (US$ Million) Forecast by Capacity, 2017 to 2033 Table 56: Middle East and Africa Market Volume (Million Units) Forecast by Capacity, 2017 to 2033 Table 57: Oceania Market Value (US$ Million) Forecast by Country, 2017 to 2033 Table 58: Oceania Market Volume (Million Units) Forecast by Country, 2017 to 2033 Table 59: Oceania Market Value (US$ Million) Forecast by Bottle Type, 2017 to 2033 Table 60: Oceania Market Volume (Million Units) Forecast by Bottle Type, 2017 to 2033 Table 61: Oceania Market Value (US$ Million) Forecast by Material Type, 2017 to 2033 Table 62: Oceania Market Volume (Million Units) Forecast by Material Type, 2017 to 2033 Table 63: Oceania Market Value (US$ Million) Forecast by Capacity, 2017 to 2033 Table 64: Oceania Market Volume (Million Units) Forecast by Capacity, 2017 to 2033
Figure 1: Global Market Value (US$ Million) by Bottle Type, 2023 to 2033 Figure 2: Global Market Value (US$ Million) by Material Type, 2023 to 2033 Figure 3: Global Market Value (US$ Million) by Capacity, 2023 to 2033 Figure 4: Global Market Value (US$ Million) by Region, 2023 to 2033 Figure 5: Global Market Value (US$ Million) Analysis by Region, 2017 to 2033 Figure 6: Global Market Volume (Million Units) Analysis by Region, 2017 to 2033 Figure 7: Global Market Value Share (%) and BPS Analysis by Region, 2023 to 2033 Figure 8: Global Market Y-o-Y Growth (%) Projections by Region, 2023 to 2033 Figure 9: Global Market Value (US$ Million) Analysis by Bottle Type, 2017 to 2033 Figure 10: Global Market Volume (Million Units) Analysis by Bottle Type, 2017 to 2033 Figure 11: Global Market Value Share (%) and BPS Analysis by Bottle Type, 2023 to 2033 Figure 12: Global Market Y-o-Y Growth (%) Projections by Bottle Type, 2023 to 2033 Figure 13: Global Market Value (US$ Million) Analysis by Material Type, 2017 to 2033 Figure 14: Global Market Volume (Million Units) Analysis by Material Type, 2017 to 2033 Figure 15: Global Market Value Share (%) and BPS Analysis by Material Type, 2023 to 2033 Figure 16: Global Market Y-o-Y Growth (%) Projections by Material Type, 2023 to 2033 Figure 17: Global Market Value (US$ Million) Analysis by Capacity, 2017 to 2033 Figure 18: Global Market Volume (Million Units) Analysis by Capacity, 2017 to 2033 Figure 19: Global Market Value Share (%) and BPS Analysis by Capacity, 2023 to 2033 Figure 20: Global Market Y-o-Y Growth (%) Projections by Capacity, 2023 to 2033 Figure 21: Global Market Attractiveness by Bottle Type, 2023 to 2033 Figure 22: Global Market Attractiveness by Material Type, 2023 to 2033 Figure 23: Global Market Attractiveness by Capacity, 2023 to 2033 Figure 24: Global Market Attractiveness by Region, 2023 to 2033 Figure 25: North America Market Value (US$ Million) by Bottle Type, 2023 to 2033 Figure 26: North America Market Value (US$ Million) by Material Type, 2023 to 2033 Figure 27: North America Market Value (US$ Million) by Capacity, 2023 to 2033 Figure 28: North America Market Value (US$ Million) by Country, 2023 to 2033 Figure 29: North America Market Value (US$ Million) Analysis by Country, 2017 to 2033 Figure 30: North America Market Volume (Million Units) Analysis by Country, 2017 to 2033 Figure 31: North America Market Value Share (%) and BPS Analysis by Country, 2023 to 2033 Figure 32: North America Market Y-o-Y Growth (%) Projections by Country, 2023 to 2033 Figure 33: North America Market Value (US$ Million) Analysis by Bottle Type, 2017 to 2033 Figure 34: North America Market Volume (Million Units) Analysis by Bottle Type, 2017 to 2033 Figure 35: North America Market Value Share (%) and BPS Analysis by Bottle Type, 2023 to 2033 Figure 36: North America Market Y-o-Y Growth (%) Projections by Bottle Type, 2023 to 2033 Figure 37: North America Market Value (US$ Million) Analysis by Material Type, 2017 to 2033 Figure 38: North America Market Volume (Million Units) Analysis by Material Type, 2017 to 2033 Figure 39: North America Market Value Share (%) and BPS Analysis by Material Type, 2023 to 2033 Figure 40: North America Market Y-o-Y Growth (%) Projections by Material Type, 2023 to 2033 Figure 41: North America Market Value (US$ Million) Analysis by Capacity, 2017 to 2033 Figure 42: North America Market Volume (Million Units) Analysis by Capacity, 2017 to 2033 Figure 43: North America Market Value Share (%) and BPS Analysis by Capacity, 2023 to 2033 Figure 44: North America Market Y-o-Y Growth (%) Projections by Capacity, 2023 to 2033 Figure 45: North America Market Attractiveness by Bottle Type, 2023 to 2033 Figure 46: North America Market Attractiveness by Material Type, 2023 to 2033 Figure 47: North America Market Attractiveness by Capacity, 2023 to 2033 Figure 48: North America Market Attractiveness by Country, 2023 to 2033 Figure 49: Latin America Market Value (US$ Million) by Bottle Type, 2023 to 2033 Figure 50: Latin America Market Value (US$ Million) by Material Type, 2023 to 2033 Figure 51: Latin America Market Value (US$ Million) by Capacity, 2023 to 2033 Figure 52: Latin America Market Value (US$ Million) by Country, 2023 to 2033 Figure 53: Latin America Market Value (US$ Million) Analysis by Country, 2017 to 2033 Figure 54: Latin America Market Volume (Million Units) Analysis by Country, 2017 to 2033 Figure 55: Latin America Market Value Share (%) and BPS Analysis by Country, 2023 to 2033 Figure 56: Latin America Market Y-o-Y Growth (%) Projections by Country, 2023 to 2033 Figure 57: Latin America Market Value (US$ Million) Analysis by Bottle Type, 2017 to 2033 Figure 58: Latin America Market Volume (Million Units) Analysis by Bottle Type, 2017 to 2033 Figure 59: Latin America Market Value Share (%) and BPS Analysis by Bottle Type, 2023 to 2033 Figure 60: Latin America Market Y-o-Y Growth (%) Projections by Bottle Type, 2023 to 2033 Figure 61: Latin America Market Value (US$ Million) Analysis by Material Type, 2017 to 2033 Figure 62: Latin America Market Volume (Million Units) Analysis by Material Type, 2017 to 2033 Figure 63: Latin America Market Value Share (%) and BPS Analysis by Material Type, 2023 to 2033 Figure 64: Latin America Market Y-o-Y Growth (%) Projections by Material Type, 2023 to 2033 Figure 65: Latin America Market Value (US$ Million) Analysis by Capacity, 2017 to 2033 Figure 66: Latin America Market Volume (Million Units) Analysis by Capacity, 2017 to 2033 Figure 67: Latin America Market Value Share (%) and BPS Analysis by Capacity, 2023 to 2033 Figure 68: Latin America Market Y-o-Y Growth (%) Projections by Capacity, 2023 to 2033 Figure 69: Latin America Market Attractiveness by Bottle Type, 2023 to 2033 Figure 70: Latin America Market Attractiveness by Material Type, 2023 to 2033 Figure 71: Latin America Market Attractiveness by Capacity, 2023 to 2033 Figure 72: Latin America Market Attractiveness by Country, 2023 to 2033 Figure 73: Europe Market Value (US$ Million) by Bottle Type, 2023 to 2033 Figure 74: Europe Market Value (US$ Million) by Material Type, 2023 to 2033 Figure 75: Europe Market Value (US$ Million) by Capacity, 2023 to 2033 Figure 76: Europe Market Value (US$ Million) by Country, 2023 to 2033 Figure 77: Europe Market Value (US$ Million) Analysis by Country, 2017 to 2033 Figure 78: Europe Market Volume (Million Units) Analysis by Country, 2017 to 2033 Figure 79: Europe Market Value Share (%) and BPS Analysis by Country, 2023 to 2033 Figure 80: Europe Market Y-o-Y Growth (%) Projections by Country, 2023 to 2033 Figure 81: Europe Market Value (US$ Million) Analysis by Bottle Type, 2017 to 2033 Figure 82: Europe Market Volume (Million Units) Analysis by Bottle Type, 2017 to 2033 Figure 83: Europe Market Value Share (%) and BPS Analysis by Bottle Type, 2023 to 2033 Figure 84: Europe Market Y-o-Y Growth (%) Projections by Bottle Type, 2023 to 2033 Figure 85: Europe Market Value (US$ Million) Analysis by Material Type, 2017 to 2033 Figure 86: Europe Market Volume (Million Units) Analysis by Material Type, 2017 to 2033 Figure 87: Europe Market Value Share (%) and BPS Analysis by Material Type, 2023 to 2033 Figure 88: Europe Market Y-o-Y Growth (%) Projections by Material Type, 2023 to 2033 Figure 89: Europe Market Value (US$ Million) Analysis by Capacity, 2017 to 2033 Figure 90: Europe Market Volume (Million Units) Analysis by Capacity, 2017 to 2033 Figure 91: Europe Market Value Share (%) and BPS Analysis by Capacity, 2023 to 2033 Figure 92: Europe Market Y-o-Y Growth (%) Projections by Capacity, 2023 to 2033 Figure 93: Europe Market Attractiveness by Bottle Type, 2023 to 2033 Figure 94: Europe Market Attractiveness by Material Type, 2023 to 2033 Figure 95: Europe Market Attractiveness by Capacity, 2023 to 2033 Figure 96: Europe Market Attractiveness by Country, 2023 to 2033 Figure 97: East Asia Market Value (US$ Million) by Bottle Type, 2023 to 2033 Figure 98: East Asia Market Value (US$ Million) by Material Type, 2023 to 2033 Figure 99: East Asia Market Value (US$ Million) by Capacity, 2023 to 2033 Figure 100: East Asia Market Value (US$ Million) by Country, 2023 to 2033 Figure 101: East Asia Market Value (US$ Million) Analysis by Country, 2017 to 2033 Figure 102: East Asia Market Volume (Million Units) Analysis by Country, 2017 to 2033 Figure 103: East Asia Market Value Share (%) and BPS Analysis by Country, 2023 to 2033 Figure 104: East Asia Market Y-o-Y Growth (%) Projections by Country, 2023 to 2033 Figure 105: East Asia Market Value (US$ Million) Analysis by Bottle Type, 2017 to 2033 Figure 106: East Asia Market Volume (Million Units) Analysis by Bottle Type, 2017 to 2033 Figure 107: East Asia Market Value Share (%) and BPS Analysis by Bottle Type, 2023 to 2033 Figure 108: East Asia Market Y-o-Y Growth (%) Projections by Bottle Type, 2023 to 2033 Figure 109: East Asia Market Value (US$ Million) Analysis by Material Type, 2017 to 2033 Figure 110: East Asia Market Volume (Million Units) Analysis by Material Type, 2017 to 2033 Figure 111: East Asia Market Value Share (%) and BPS Analysis by Material Type, 2023 to 2033 Figure 112: East Asia Market Y-o-Y Growth (%) Projections by Material Type, 2023 to 2033 Figure 113: East Asia Market Value (US$ Million) Analysis by Capacity, 2017 to 2033 Figure 114: East Asia Market Volume (Million Units) Analysis by Capacity, 2017 to 2033 Figure 115: East Asia Market Value Share (%) and BPS Analysis by Capacity, 2023 to 2033 Figure 116: East Asia Market Y-o-Y Growth (%) Projections by Capacity, 2023 to 2033 Figure 117: East Asia Market Attractiveness by Bottle Type, 2023 to 2033 Figure 118: East Asia Market Attractiveness by Material Type, 2023 to 2033 Figure 119: East Asia Market Attractiveness by Capacity, 2023 to 2033 Figure 120: East Asia Market Attractiveness by Country, 2023 to 2033 Figure 121: South Asia Market Value (US$ Million) by Bottle Type, 2023 to 2033 Figure 122: South Asia Market Value (US$ Million) by Material Type, 2023 to 2033 Figure 123: South Asia Market Value (US$ Million) by Capacity, 2023 to 2033 Figure 124: South Asia Market Value (US$ Million) by Country, 2023 to 2033 Figure 125: South Asia Market Value (US$ Million) Analysis by Country, 2017 to 2033 Figure 126: South Asia Market Volume (Million Units) Analysis by Country, 2017 to 2033 Figure 127: South Asia Market Value Share (%) and BPS Analysis by Country, 2023 to 2033 Figure 128: South Asia Market Y-o-Y Growth (%) Projections by Country, 2023 to 2033 Figure 129: South Asia Market Value (US$ Million) Analysis by Bottle Type, 2017 to 2033 Figure 130: South Asia Market Volume (Million Units) Analysis by Bottle Type, 2017 to 2033 Figure 131: South Asia Market Value Share (%) and BPS Analysis by Bottle Type, 2023 to 2033 Figure 132: South Asia Market Y-o-Y Growth (%) Projections by Bottle Type, 2023 to 2033 Figure 133: South Asia Market Value (US$ Million) Analysis by Material Type, 2017 to 2033 Figure 134: South Asia Market Volume (Million Units) Analysis by Material Type, 2017 to 2033 Figure 135: South Asia Market Value Share (%) and BPS Analysis by Material Type, 2023 to 2033 Figure 136: South Asia Market Y-o-Y Growth (%) Projections by Material Type, 2023 to 2033 Figure 137: South Asia Market Value (US$ Million) Analysis by Capacity, 2017 to 2033 Figure 138: South Asia Market Volume (Million Units) Analysis by Capacity, 2017 to 2033 Figure 139: South Asia Market Value Share (%) and BPS Analysis by Capacity, 2023 to 2033 Figure 140: South Asia Market Y-o-Y Growth (%) Projections by Capacity, 2023 to 2033 Figure 141: South Asia Market Attractiveness by Bottle Type, 2023 to 2033 Figure 142: South Asia Market Attractiveness by Material Type, 2023 to 2033 Figure 143: South Asia Market Attractiveness by Capacity, 2023 to 2033 Figure 144: South Asia Market Attractiveness by Country, 2023 to 2033 Figure 145: Middle East and Africa Market Value (US$ Million) by Bottle Type, 2023 to 2033 Figure 146: Middle East and Africa Market Value (US$ Million) by Material Type, 2023 to 2033 Figure 147: Middle East and Africa Market Value (US$ Million) by Capacity, 2023 to 2033 Figure 148: Middle East and Africa Market Value (US$ Million) by Country, 2023 to 2033 Figure 149: Middle East and Africa Market Value (US$ Million) Analysis by Country, 2017 to 2033 Figure 150: Middle East and Africa Market Volume (Million Units) Analysis by Country, 2017 to 2033 Figure 151: Middle East and Africa Market Value Share (%) and BPS Analysis by Country, 2023 to 2033 Figure 152: Middle East and Africa Market Y-o-Y Growth (%) Projections by Country, 2023 to 2033 Figure 153: Middle East and Africa Market Value (US$ Million) Analysis by Bottle Type, 2017 to 2033 Figure 154: Middle East and Africa Market Volume (Million Units) Analysis by Bottle Type, 2017 to 2033 Figure 155: Middle East and Africa Market Value Share (%) and BPS Analysis by Bottle Type, 2023 to 2033 Figure 156: Middle East and Africa Market Y-o-Y Growth (%) Projections by Bottle Type, 2023 to 2033 Figure 157: Middle East and Africa Market Value (US$ Million) Analysis by Material Type, 2017 to 2033 Figure 158: Middle East and Africa Market Volume (Million Units) Analysis by Material Type, 2017 to 2033 Figure 159: Middle East and Africa Market Value Share (%) and BPS Analysis by Material Type, 2023 to 2033 Figure 160: Middle East and Africa Market Y-o-Y Growth (%) Projections by Material Type, 2023 to 2033 Figure 161: Middle East and Africa Market Value (US$ Million) Analysis by Capacity, 2017 to 2033 Figure 162: Middle East and Africa Market Volume (Million Units) Analysis by Capacity, 2017 to 2033 Figure 163: Middle East and Africa Market Value Share (%) and BPS Analysis by Capacity, 2023 to 2033 Figure 164: Middle East and Africa Market Y-o-Y Growth (%) Projections by Capacity, 2023 to 2033 Figure 165: Middle East and Africa Market Attractiveness by Bottle Type, 2023 to 2033 Figure 166: Middle East and Africa Market Attractiveness by Material Type, 2023 to 2033 Figure 167: Middle East and Africa Market Attractiveness by Capacity, 2023 to 2033 Figure 168: Middle East and Africa Market Attractiveness by Country, 2023 to 2033 Figure 169: Oceania Market Value (US$ Million) by Bottle Type, 2023 to 2033 Figure 170: Oceania Market Value (US$ Million) by Material Type, 2023 to 2033 Figure 171: Oceania Market Value (US$ Million) by Capacity, 2023 to 2033 Figure 172: Oceania Market Value (US$ Million) by Country, 2023 to 2033 Figure 173: Oceania Market Value (US$ Million) Analysis by Country, 2017 to 2033 Figure 174: Oceania Market Volume (Million Units) Analysis by Country, 2017 to 2033 Figure 175: Oceania Market Value Share (%) and BPS Analysis by Country, 2023 to 2033 Figure 176: Oceania Market Y-o-Y Growth (%) Projections by Country, 2023 to 2033 Figure 177: Oceania Market Value (US$ Million) Analysis by Bottle Type, 2017 to 2033 Figure 178: Oceania Market Volume (Million Units) Analysis by Bottle Type, 2017 to 2033 Figure 179: Oceania Market Value Share (%) and BPS Analysis by Bottle Type, 2023 to 2033 Figure 180: Oceania Market Y-o-Y Growth (%) Projections by Bottle Type, 2023 to 2033 Figure 181: Oceania Market Value (US$ Million) Analysis by Material Type, 2017 to 2033 Figure 182: Oceania Market Volume (Million Units) Analysis by Material Type, 2017 to 2033 Figure 183: Oceania Market Value Share (%) and BPS Analysis by Material Type, 2023 to 2033 Figure 184: Oceania Market Y-o-Y Growth (%) Projections by Material Type, 2023 to 2033 Figure 185: Oceania Market Value (US$ Million) Analysis by Capacity, 2017 to 2033 Figure 186: Oceania Market Volume (Million Units) Analysis by Capacity, 2017 to 2033 Figure 187: Oceania Market Value Share (%) and BPS Analysis by Capacity, 2023 to 2033 Figure 188: Oceania Market Y-o-Y Growth (%) Projections by Capacity, 2023 to 2033 Figure 189: Oceania Market Attractiveness by Bottle Type, 2023 to 2033 Figure 190: Oceania Market Attractiveness by Material Type, 2023 to 2033 Figure 191: Oceania Market Attractiveness by Capacity, 2023 to 2033 Figure 192: Oceania Market Attractiveness by Country, 2023 to 2033
Recommendations
Chemicals & Materials
Published : February 2023
Explore Packaging Insights
View Reports