Reports

- Global Locations -

Headquarters

Future Market Insights, Inc.

Christiana Corporate, 200
Continental Drive, Suite 401,
Newark, Delaware - 19713,
United States

T: +1-845-579-5705

Americas

Future Market Insights, Inc.

616 Corporate Way, Suite 2-9018,
Valley Cottage, NY 10989, United States

T: +1-347-918-3531

MEA

Future Market Insights

1602-6 Jumeirah Bay X2 Tower, Plot No: JLT-PH2-X2A,
Jumeirah Lakes Towers, Dubai,
United Arab Emirates

Europe

Future Market Insights

3rd Floor, 207 Regent Street,
W1B 3HH London
United Kingdom

T: + 44 (0) 20 8123 9659
D: +44 (0) 20 3287 4268

Asia Pacific

Future Market Insights

IndiaLand Global Tech Park, Unit UG-1, Behind Grand HighStreet, Phase 1, Hinjawadi, MH, Pune – 411057, India

Pharmaceutical Dissolution Testing Services Market Snapshot (2023 to 2033)

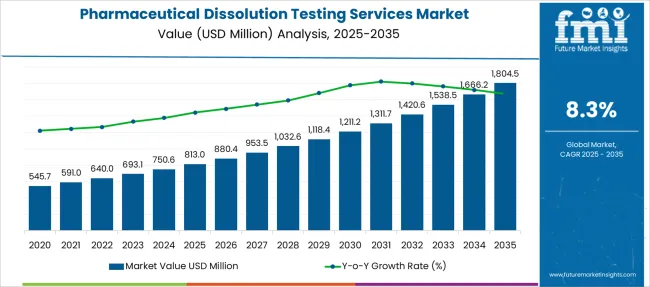
The global pharmaceutical dissolution testing services market is expected to garner a market value of US$ 693.12 Million in 2023 and is expected to accumulate a market value of US$ 1,538.48 Million by registering a CAGR of 8.3% in the forecast period 2023 to 2033. The growth of the pharmaceutical dissolution testing services market can be attributed to a rise in pharmaceutical research efforts. The market for pharmaceutical dissolution testing services registered a CAGR of 5.2% in the historical period 2018 to 2022.

Due to increased Research and Development expenditure by pharmaceutical companies as well as an increase in the number of novel medications entering the preclinical stage of development, there has also been an increase in demand for pharmaceutical dissolution testing services. The dissolution testing services were initially disturbed due to the pandemic.

Report Attribute Details
Expected Market Value (2023) US$ 693.12 Million
Anticipated Forecast Value (2033) US$ 1,538.48 Million
Projected Growth Rate (2023 to 2033) 8.3% CAGR

Don't pay for what you don't need

Customize your report by selecting specific countries or regions and save 30%!

2018 to 2022 Pharmaceutical dissolution testing services Market Demand Analysis vs. Forecast 2023 to 2033

According to market research and competitive intelligence provider Future Market Insights- the market for pharmaceutical dissolution testing services reflected a value of 5.2% during the historical period, 2018 to 2022.

The COVID-19 pandemic has significantly impacted the global industry. Pharmaceutical firms, biotech firms, and other end-user demands were primarily served during the crisis by developing coronavirus prevention drugs. Since the end of 2019, these organizations have been actively working toward the development of medications that can be used as a treatment for COVID-19 patients who have only minor symptoms. And these drug developments require dissolution testing at each stage to access safety, stability, and efficacy, thus contributing to industry growth. Thus, the market for pharmaceutical dissolution testing services is expected to register a CAGR of 8.3% in the forecast period 2023 to 2033.

Which are Some Prominent Drivers of Pharmaceutical Dissolution Testing Services Market?

Research for Prevention of COVID-19 leading to demand for Pharmaceutical Dissolution Testing Services

The pandemic created an increased workload and a reduction in the internal lab testing capacities of various pharmaceutical companies. However, to mitigate or prevent these challenges, various strategies, like rotational shifts, reducing manpower, and working from home were adopted by companies. By the second half of the pandemic, the research studies for drug development started for the prevention of COVID-19 led to a rise in demand for pharmaceutical dissolution testing services. Dissolution testing is an essential tool for assessing the effectiveness of oral solid dose forms.

Its importance is rising due to the fact that medicine must first be released from the product and dissolved in the gastrointestinal fluids before it can be absorbed into the blood vessels to be effective. In other words, how quickly and how much of a medicine is absorbed depends on how easily it dissolves from the dosage form. According to The Food and Drug Administration Dissolution Database, there are 1444 drug products (July 2022) in the database that are in oral solid dose form. The oral solid dose is relatively simple to administer and it is simple to differentiate one oral solid dose product from another.

Marketing Efforts and Awareness regarding Healthcare Products bolstering demand for Pharmaceutical Dissolution Testing Services

Oral solid dose manufacturing approaches are well-developed. Each has a repeatable distribution of ingredients, as well as uniformity in dissolution and bioavailability, to verify that the drug product is safe and effective. The performance of key companies is highly influenced by the level of demand from end users.

Due to intense market efforts, increasing awareness levels, improving accessibility, and government initiatives; consumers, these days, are more concerned about self-care, resulting in higher consumption of healthcare products. The consumption levels are anticipated to rise exponentially over the forecast period.

Sabyasachi Ghosh
Sabyasachi Ghosh

Principal Consultant

Talk to Analyst

Find your sweet spots for generating winning opportunities in this market.

What are the Challenges Faced by the Pharmaceutical Dissolution Testing Services Market?

Unskilled Workforce affecting the growth of the Pharmaceutical Dissolution Testing Services Market

The pharmaceutical dissolution testing services are at a nascent stage. Thus, the trial-and-error format of the industry is hampering the overall growth of the market. Moreover, the absence of unskilled labor to perform various testing services tasks is retaining the growth of the market. Although key players are using technology to increase production and testing services, the unavailability of skilled labor is causing losses to the industry.
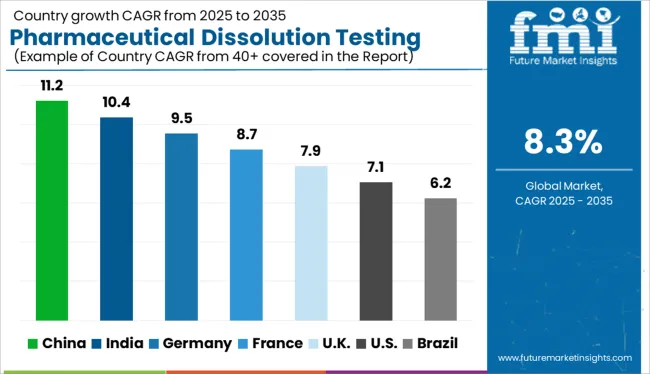
Regional Insights

Strong Presence of Key Players Favoring Growth of the Pharmaceutical Dissolution Testing Services Market in North America?

Research and Development for Novel Therapeutics accelerating market growth in North America

North America is expected to dominate the global industry in 2023 and account for the maximum share exceeding 50% of the overall revenue. The high share of this segment can be attributed to the presence of major companies providing pharmaceutical dissolution testing services and rising investments in Research and Development by them for the development of novel therapeutics for chronic diseases.

In addition, the development of the healthcare system and a rise in the burden of disease have increased the demand for novel therapeutics and, in turn, the demand for laboratory dissolution testing. All these factors are propelling the growth of the pharmaceutical dissolution testing services market in North America.

Establishment of New Facilities Augmenting Growth of Pharmaceutical Dissolution Testing Services Market in Asia Pacific?

Government Initiatives for Research and Development supporting the growth of the market in Asia Pacific

The Asia Pacific region is expected to grow at the fastest CAGR during the forecast period owing to the rising investments by companies from developed economies in enhancing regional healthcare. Furthermore, service providers are establishing new facilities and forming alliances to increase the reach of their offerings to various locations in the region.

In addition, the government of the region is focusing on offering investments for research and development that will accelerate the manufacturing of medicines for different ailments. Thus, Asia Pacific is expected to possess a 33% market share for the pharmaceutical dissolution testing services market in Asia Pacific.

Get the data you need at a Fraction of the cost

Personalize your report by choosing insights you need
and save 40%!

Category-Wise Insights

Increase in Preclinical Pipeline Capacity Expanding Use of In-Vitro Method for Pharmaceutical Dissolution Testing Services Market?

In-vitro dissolution testing is used to evaluate the security of medicines

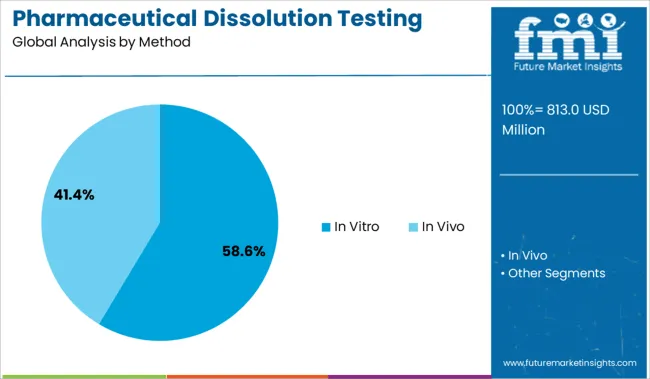
The in-vitro method segment is expected to dominate the global market in 2023 and account for the largest share of more than 58% of the overall revenue. The segment is projected to expand further at the fastest growth rate maintaining its leading industry position throughout the forecast period. Two key factors driving the segment growth include an increase in preclinical pipeline capacity and growing awareness about dissolution testing.

In addition, the market for in-vitro pharmaceutical dissolution testing is anticipated to rise as a result of the traditional rising costs of animal tests as well as their socio-ethical problems. Market expansion is predicted to be supported by significant developments in the in-vitro dissolution testing assays used to evaluate the security of medicines and the potential impacts of those drugs on cells and tissues. To accommodate the rising demand for these assays, businesses are increasing their product lines as the market for in-vitro pharmaceutical dissolution testing expands.

Easy Production of Tablets Driving Growth of Pharmaceutical Dissolution Testing Services Market?

Easy formulation and availability of tablets increasing production of capsules

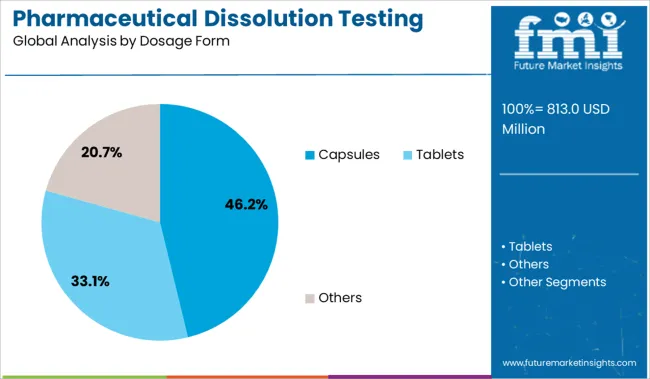
Based on dosage form, the global industry has been further categorized into capsules, tablets, and others. The other segment includes syrup, ointments, eye/ear/nasal drops, powders, and aerosols.

The tablet dosage form segment is expected to dominate the global industry in 2023 and account for the maximum share of 65% of the overall revenue. The segment is also anticipated to register the fastest CAGR maintaining its leading industry position throughout the forecast period.

This rapid growth can be attributed to the fact that tablets are simple to produce in large quantities, have excellent physical and chemical stability, and can be adjusted for the amount of medicine supplied to the body. The capsules segment is anticipated to register the second-fastest CAGR during the forecast period. Capsules are solid dosage forms. Some of the major drivers of this segment are the stability, easy availability of storage conditions, and easy formulation & development of capsules.

Easy to Use Functionality of Paddle Making It Popular for Manufacturing Tablets?

Easy Allowance of pH change maximizing use of paddle for manufacturing tablets

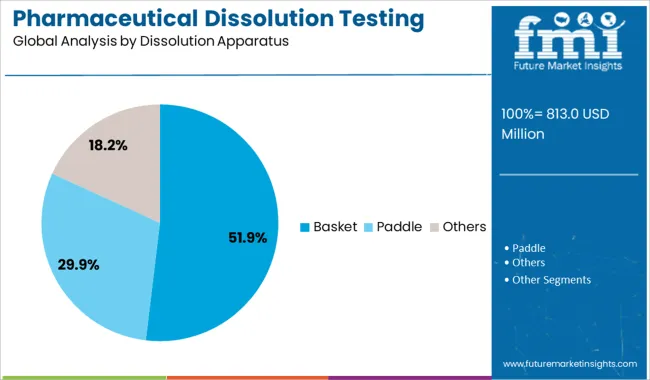
Based on dissolution apparatus, the global industry has been further categorized into basket, paddle, and others. The other segment includes a reciprocating cylinder, flow-through cell, paddle-over disc, rotating cylinder, and reciprocating disc. The paddle segment is expected to dominate the industry and account for the largest revenue share of 70% in 2023. The paddle is fixed vertically to a motor with variable speed and controlled speed. The tablet or capsule is put into a flask with a circular bottom for dissolving, and the equipment is kept at a steady temperature. This is widely used for the oral solid dosage form.

It is easy to use, can change pH, and can be easily automated for a routine check-up. The basket dissolution apparatus segment is likely to register the second-fastest CAGR during the forecast period. New equipment is positioned at the revolving shaft's end when using the basket dissolution method. It is made of non-reactive mesh and has a cylindrical form to avoid any unintended chemical interactions that might change the outcome. The main driver for the wide-scale adoption of this method is it can change its pH during the test.
Market Competition

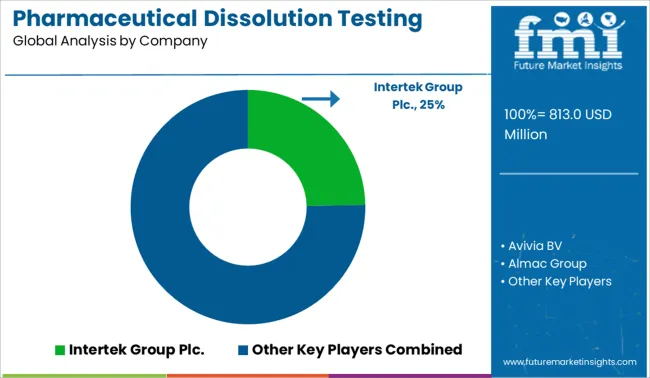
Businesses are undertaking strategies like product launches, M&A agreements, regional expansions, and product launches to gain a competitive edge. Some of the prominent players in the global pharmaceutical dissolution testing services market include Intertek Group Plc, Avivia BV, Almac Group, Agilent Technologies, Inc., Catalent, Inc., Thermofisher Scientific Inc, Cambrex, Charles River Laboratories, Boston Analytical, Pace Analytical Life Sciences, SOTAX, AMRI, SGS SA

  • In October 2022, Agilent Technologies, Inc. announced the opening of the Dissolution Center of Excellence (CoE) facility in Craven Arms, United Kingdom. With this investment, Agilent will be able to unify all of its dissolution-related operations under one roof, simplifying cross-business collaboration and advancing the goal of innovation for the next dissolution products and services.
  • In June 2022, Intertek presented a discussion on food substances in contact with infant formula or human milk at the Chemical watch food contact regulations USA conference.

Report Scope

Report Attribute Details
Market Value in 2023 US$ 693.12 Million
Market Value in 2033 US$ 1,538.48 Million
Growth Rate CAGR of 8.3% from 2023 to 2033
Base Year for Estimation 2022
Historical Data 2018 to 2022
Forecast Period 2023 to 2033
Quantitative Units Revenue in USD Million and CAGR from 2023 to 2033
Report Coverage Revenue Forecast, Volume Forecast, Company Ranking, Competitive Landscape, Growth Factors, Trends, and Pricing Analysis
Segments Covered
  • Method
  • Dosage Form
  • Dissolution Apparatus
  • Region
Regions Covered
  • North America
  • Latin America
  • Europe
  • Asia Pacific
  • Middle East & Africa
Key Countries Profiled
  • USA
  • Canada
  • Brazil
  • Mexico
  • Germany
  • United Kingdom
  • France
  • Spain
  • Italy
  • China
  • Japan
  • South Korea
  • Singapore
  • Thailand
  • Indonesia
  • Australia
  • New Zealand
  • GCC Countries
  • South Africa
  • Israel
Key Companies Profiled
  • Intertek Group Plc.
  • Aviva BV
  • Almac Group
  • Agilent Technologies, Inc.
  • Catalent, Inc.
  • Thermo Fisher Scientific Inc.
  • Cambrex
  • Charles River Laboratories
  • Boston Analytical
  • Pace Analytical Life Sciences
  • SOTAX
  • AMRI
  • SGS SA
Customization Available Upon Request

Key Segments Profiled in the Pharmaceutical Dissolution Testing Services Industry Survey

By Method:

  • In Vitro
  • In Vivo

By Dosage Form:

  • Capsules
  • Tablets
  • Others

By Dissolution Apparatus:

  • Basket
  • Paddle
  • Others

By Region:

  • North America
  • Latin America
  • Europe
  • Asia Pacific
  • Middle East & Africa

Frequently Asked Questions

At what rate did the pharmaceutical dissolution testing services market flourish from 2018 to 2022?

From 2018 to 2022, the pharmaceutical dissolution testing services market grew at a CAGR of 5.2%

What will be the growth rate of the global pharmaceutical dissolution testing services market during the forecast period?

The global pharmaceutical dissolution testing services market is expected to grow with an 8.3% CAGR from 2023 to 2033.

What will be the projected market size of the pharmaceutical dissolution testing services market by 2033?

As of 2033, the pharmaceutical dissolution testing services market is expected to reach US$ 1538.48 Million

Which type of dosage form is expected to dominate the global pharmaceutical dissolution testing services market during 2023?

The tablet dosage form segment is expected to dominate the global industry in 2023 and account for the maximum share of more than 65% of the overall revenue.

Which dissolution apparatus segment is expected to dominate the global pharmaceutical dissolution testing services market during 2023?

The paddle segment is expected to dominate the industry and account for the largest revenue share of more than 70% in 2023.

Which type of method is expected to dominate the global pharmaceutical dissolution testing services market during 2023?

The in-vitro method segment is expected to dominate the global market in 2023 and account for the largest share of more than 58% of the overall revenue.

How is the USA pharmaceutical dissolution testing services market projected to grow in 2023?

North America is expected to dominate the global industry in 2023 and account for the maximum share of more than 50% of the overall revenue.

How is the India pharmaceutical dissolution testing services market projected to grow in 2023?

Asia Pacific is expected to possess a 33% market share for the pharmaceutical dissolution testing services market in Asia Pacific.

Table of Content

1. Executive Summary | Pharmaceutical Dissolution Testing Services Market

    1.1. Global Market Outlook

    1.2. Demand-side Trends

    1.3. Supply-side Trends

    1.4. Technology Roadmap Analysis

    1.5. Analysis and Recommendations

2. Market Overview

    2.1. Market Coverage / Taxonomy

    2.2. Market Definition / Scope / Limitations

3. Market Background

    3.1. Market Dynamics

        3.1.1. Drivers

        3.1.2. Restraints

        3.1.3. Opportunity

        3.1.4. Trends

    3.2. Scenario Forecast

        3.2.1. Demand in Optimistic Scenario

        3.2.2. Demand in Likely Scenario

        3.2.3. Demand in Conservative Scenario

    3.3. Opportunity Map Analysis

    3.4. Investment Feasibility Matrix

    3.5. PESTLE and Porter’s Analysis

    3.6. Regulatory Landscape

        3.6.1. By Key Regions

        3.6.2. By Key Countries

    3.7. Regional Parent Market Outlook

4. Global Market Analysis 2018 to 2022 and Forecast, 2023 to 2033

    4.1. Historical Market Size Value (US$ Million) Analysis, 2018 to 2022

    4.2. Current and Future Market Size Value (US$ Million) Projections, 2023 to 2033

        4.2.1. Y-o-Y Growth Trend Analysis

        4.2.2. Absolute $ Opportunity Analysis

5. Global Market Analysis 2018 to 2022 and Forecast 2023 to 2033, By Method

    5.1. Introduction / Key Findings

    5.2. Historical Market Size Value (US$ Million) Analysis By Method, 2018 to 2022

    5.3. Current and Future Market Size Value (US$ Million) Analysis and Forecast By Method, 2023 to 2033

        5.3.1. In Vitro

        5.3.2. In Vivo

    5.4. Y-o-Y Growth Trend Analysis By Method, 2018 to 2022

    5.5. Absolute $ Opportunity Analysis By Method, 2023 to 2033

6. Global Market Analysis 2018 to 2022 and Forecast 2023 to 2033, By Dosage Form

    6.1. Introduction / Key Findings

    6.2. Historical Market Size Value (US$ Million) Analysis By Dosage Form, 2018 to 2022

    6.3. Current and Future Market Size Value (US$ Million) Analysis and Forecast By Dosage Form, 2023 to 2033

        6.3.1. Capsules

        6.3.2. Tablets

        6.3.3. Others

    6.4. Y-o-Y Growth Trend Analysis By Dosage Form, 2018 to 2022

    6.5. Absolute $ Opportunity Analysis By Dosage Form, 2023 to 2033

7. Global Market Analysis 2018 to 2022 and Forecast 2023 to 2033, By Dissolution Apparatus

    7.1. Introduction / Key Findings

    7.2. Historical Market Size Value (US$ Million) Analysis By Dissolution Apparatus, 2018 to 2022

    7.3. Current and Future Market Size Value (US$ Million) Analysis and Forecast By Dissolution Apparatus, 2023 to 2033

        7.3.1. Basket

        7.3.2. Paddle

        7.3.3. Others

    7.4. Y-o-Y Growth Trend Analysis By Dissolution Apparatus, 2018 to 2022

    7.5. Absolute $ Opportunity Analysis By Dissolution Apparatus, 2023 to 2033

8. Global Market Analysis 2018 to 2022 and Forecast 2023 to 2033, By Region

    8.1. Introduction

    8.2. Historical Market Size Value (US$ Million) Analysis By Region, 2018 to 2022

    8.3. Current Market Size Value (US$ Million) Analysis and Forecast By Region, 2023 to 2033

        8.3.1. North America

        8.3.2. Latin America

        8.3.3. Europe

        8.3.4. Asia Pacific

        8.3.5. Middle East and Africa(MEA)

    8.4. Market Attractiveness Analysis By Region

9. North America Market Analysis 2018 to 2022 and Forecast 2023 to 2033, By Country

    9.1. Historical Market Size Value (US$ Million) Trend Analysis By Market Taxonomy, 2018 to 2022

    9.2. Market Size Value (US$ Million) Forecast By Market Taxonomy, 2023 to 2033

        9.2.1. By Country

            9.2.1.1. USA

            9.2.1.2. Canada

        9.2.2. By Method

        9.2.3. By Dosage Form

        9.2.4. By Dissolution Apparatus

    9.3. Market Attractiveness Analysis

        9.3.1. By Country

        9.3.2. By Method

        9.3.3. By Dosage Form

        9.3.4. By Dissolution Apparatus

    9.4. Key Takeaways

10. Latin America Market Analysis 2018 to 2022 and Forecast 2023 to 2033, By Country

    10.1. Historical Market Size Value (US$ Million) Trend Analysis By Market Taxonomy, 2018 to 2022

    10.2. Market Size Value (US$ Million) Forecast By Market Taxonomy, 2023 to 2033

        10.2.1. By Country

            10.2.1.1. Brazil

            10.2.1.2. Mexico

            10.2.1.3. Rest of Latin America

        10.2.2. By Method

        10.2.3. By Dosage Form

        10.2.4. By Dissolution Apparatus

    10.3. Market Attractiveness Analysis

        10.3.1. By Country

        10.3.2. By Method

        10.3.3. By Dosage Form

        10.3.4. By Dissolution Apparatus

    10.4. Key Takeaways

11. Europe Market Analysis 2018 to 2022 and Forecast 2023 to 2033, By Country

    11.1. Historical Market Size Value (US$ Million) Trend Analysis By Market Taxonomy, 2018 to 2022

    11.2. Market Size Value (US$ Million) Forecast By Market Taxonomy, 2023 to 2033

        11.2.1. By Country

            11.2.1.1. Germany

            11.2.1.2. United Kingdom

            11.2.1.3. France

            11.2.1.4. Spain

            11.2.1.5. Italy

            11.2.1.6. Rest of Europe

        11.2.2. By Method

        11.2.3. By Dosage Form

        11.2.4. By Dissolution Apparatus

    11.3. Market Attractiveness Analysis

        11.3.1. By Country

        11.3.2. By Method

        11.3.3. By Dosage Form

        11.3.4. By Dissolution Apparatus

    11.4. Key Takeaways

12. Asia Pacific Market Analysis 2018 to 2022 and Forecast 2023 to 2033, By Country

    12.1. Historical Market Size Value (US$ Million) Trend Analysis By Market Taxonomy, 2018 to 2022

    12.2. Market Size Value (US$ Million) Forecast By Market Taxonomy, 2023 to 2033

        12.2.1. By Country

            12.2.1.1. China

            12.2.1.2. Japan

            12.2.1.3. South Korea

            12.2.1.4. Singapore

            12.2.1.5. Thailand

            12.2.1.6. Indonesia

            12.2.1.7. Australia

            12.2.1.8. New Zealand

            12.2.1.9. Rest of Asia Pacific

        12.2.2. By Method

        12.2.3. By Dosage Form

        12.2.4. By Dissolution Apparatus

    12.3. Market Attractiveness Analysis

        12.3.1. By Country

        12.3.2. By Method

        12.3.3. By Dosage Form

        12.3.4. By Dissolution Apparatus

    12.4. Key Takeaways

13. MEA Market Analysis 2018 to 2022 and Forecast 2023 to 2033, By Country

    13.1. Historical Market Size Value (US$ Million) Trend Analysis By Market Taxonomy, 2018 to 2022

    13.2. Market Size Value (US$ Million) Forecast By Market Taxonomy, 2023 to 2033

        13.2.1. By Country

            13.2.1.1. GCC Countries

            13.2.1.2. South Africa

            13.2.1.3. Israel

            13.2.1.4. Rest of Middle East and Africa(MEA)

        13.2.2. By Method

        13.2.3. By Dosage Form

        13.2.4. By Dissolution Apparatus

    13.3. Market Attractiveness Analysis

        13.3.1. By Country

        13.3.2. By Method

        13.3.3. By Dosage Form

        13.3.4. By Dissolution Apparatus

    13.4. Key Takeaways

14. Key Countries Market Analysis

    14.1. USA

        14.1.1. Pricing Analysis

        14.1.2. Market Share Analysis, 2021

            14.1.2.1. By Method

            14.1.2.2. By Dosage Form

            14.1.2.3. By Dissolution Apparatus

    14.2. Canada

        14.2.1. Pricing Analysis

        14.2.2. Market Share Analysis, 2021

            14.2.2.1. By Method

            14.2.2.2. By Dosage Form

            14.2.2.3. By Dissolution Apparatus

    14.3. Brazil

        14.3.1. Pricing Analysis

        14.3.2. Market Share Analysis, 2021

            14.3.2.1. By Method

            14.3.2.2. By Dosage Form

            14.3.2.3. By Dissolution Apparatus

    14.4. Mexico

        14.4.1. Pricing Analysis

        14.4.2. Market Share Analysis, 2021

            14.4.2.1. By Method

            14.4.2.2. By Dosage Form

            14.4.2.3. By Dissolution Apparatus

    14.5. Germany

        14.5.1. Pricing Analysis

        14.5.2. Market Share Analysis, 2021

            14.5.2.1. By Method

            14.5.2.2. By Dosage Form

            14.5.2.3. By Dissolution Apparatus

    14.6. United Kingdom

        14.6.1. Pricing Analysis

        14.6.2. Market Share Analysis, 2021

            14.6.2.1. By Method

            14.6.2.2. By Dosage Form

            14.6.2.3. By Dissolution Apparatus

    14.7. France

        14.7.1. Pricing Analysis

        14.7.2. Market Share Analysis, 2021

            14.7.2.1. By Method

            14.7.2.2. By Dosage Form

            14.7.2.3. By Dissolution Apparatus

    14.8. Spain

        14.8.1. Pricing Analysis

        14.8.2. Market Share Analysis, 2021

            14.8.2.1. By Method

            14.8.2.2. By Dosage Form

            14.8.2.3. By Dissolution Apparatus

    14.9. Italy

        14.9.1. Pricing Analysis

        14.9.2. Market Share Analysis, 2021

            14.9.2.1. By Method

            14.9.2.2. By Dosage Form

            14.9.2.3. By Dissolution Apparatus

    14.10. China

        14.10.1. Pricing Analysis

        14.10.2. Market Share Analysis, 2021

            14.10.2.1. By Method

            14.10.2.2. By Dosage Form

            14.10.2.3. By Dissolution Apparatus

    14.11. Japan

        14.11.1. Pricing Analysis

        14.11.2. Market Share Analysis, 2021

            14.11.2.1. By Method

            14.11.2.2. By Dosage Form

            14.11.2.3. By Dissolution Apparatus

    14.12. South Korea

        14.12.1. Pricing Analysis

        14.12.2. Market Share Analysis, 2021

            14.12.2.1. By Method

            14.12.2.2. By Dosage Form

            14.12.2.3. By Dissolution Apparatus

    14.13. Singapore

        14.13.1. Pricing Analysis

        14.13.2. Market Share Analysis, 2021

            14.13.2.1. By Method

            14.13.2.2. By Dosage Form

            14.13.2.3. By Dissolution Apparatus

    14.14. Thailand

        14.14.1. Pricing Analysis

        14.14.2. Market Share Analysis, 2021

            14.14.2.1. By Method

            14.14.2.2. By Dosage Form

            14.14.2.3. By Dissolution Apparatus

    14.15. Indonesia

        14.15.1. Pricing Analysis

        14.15.2. Market Share Analysis, 2021

            14.15.2.1. By Method

            14.15.2.2. By Dosage Form

            14.15.2.3. By Dissolution Apparatus

    14.16. Australia

        14.16.1. Pricing Analysis

        14.16.2. Market Share Analysis, 2021

            14.16.2.1. By Method

            14.16.2.2. By Dosage Form

            14.16.2.3. By Dissolution Apparatus

    14.17. New Zealand

        14.17.1. Pricing Analysis

        14.17.2. Market Share Analysis, 2021

            14.17.2.1. By Method

            14.17.2.2. By Dosage Form

            14.17.2.3. By Dissolution Apparatus

    14.18. GCC Countries

        14.18.1. Pricing Analysis

        14.18.2. Market Share Analysis, 2021

            14.18.2.1. By Method

            14.18.2.2. By Dosage Form

            14.18.2.3. By Dissolution Apparatus

    14.19. South Africa

        14.19.1. Pricing Analysis

        14.19.2. Market Share Analysis, 2021

            14.19.2.1. By Method

            14.19.2.2. By Dosage Form

            14.19.2.3. By Dissolution Apparatus

    14.20. Israel

        14.20.1. Pricing Analysis

        14.20.2. Market Share Analysis, 2021

            14.20.2.1. By Method

            14.20.2.2. By Dosage Form

            14.20.2.3. By Dissolution Apparatus

15. Market Structure Analysis

    15.1. Competition Dashboard

    15.2. Competition Benchmarking

    15.3. Market Share Analysis of Top Players

        15.3.1. By Regional

        15.3.2. By Method

        15.3.3. By Dosage Form

        15.3.4. By Dissolution Apparatus

16. Competition Analysis

    16.1. Competition Deep Dive

        16.1.1. Intertek Group Plc.

            16.1.1.1. Overview

            16.1.1.2. Product Portfolio

            16.1.1.3. Profitability by Market Segments

            16.1.1.4. Sales Footprint

            16.1.1.5. Strategy Overview

                16.1.1.5.1. Marketing Strategy

        16.1.2. Avivia BV

            16.1.2.1. Overview

            16.1.2.2. Product Portfolio

            16.1.2.3. Profitability by Market Segments

            16.1.2.4. Sales Footprint

            16.1.2.5. Strategy Overview

                16.1.2.5.1. Marketing Strategy

        16.1.3. Almac Group

            16.1.3.1. Overview

            16.1.3.2. Product Portfolio

            16.1.3.3. Profitability by Market Segments

            16.1.3.4. Sales Footprint

            16.1.3.5. Strategy Overview

                16.1.3.5.1. Marketing Strategy

        16.1.4. Agilent Technologies, Inc.

            16.1.4.1. Overview

            16.1.4.2. Product Portfolio

            16.1.4.3. Profitability by Market Segments

            16.1.4.4. Sales Footprint

            16.1.4.5. Strategy Overview

                16.1.4.5.1. Marketing Strategy

        16.1.5. Catalent, Inc.

            16.1.5.1. Overview

            16.1.5.2. Product Portfolio

            16.1.5.3. Profitability by Market Segments

            16.1.5.4. Sales Footprint

            16.1.5.5. Strategy Overview

                16.1.5.5.1. Marketing Strategy

        16.1.6. Thermo Fisher Scientific Inc.

            16.1.6.1. Overview

            16.1.6.2. Product Portfolio

            16.1.6.3. Profitability by Market Segments

            16.1.6.4. Sales Footprint

            16.1.6.5. Strategy Overview

                16.1.6.5.1. Marketing Strategy

        16.1.7. Cambrex

            16.1.7.1. Overview

            16.1.7.2. Product Portfolio

            16.1.7.3. Profitability by Market Segments

            16.1.7.4. Sales Footprint

            16.1.7.5. Strategy Overview

                16.1.7.5.1. Marketing Strategy

        16.1.8. Charles River Laboratories

            16.1.8.1. Overview

            16.1.8.2. Product Portfolio

            16.1.8.3. Profitability by Market Segments

            16.1.8.4. Sales Footprint

            16.1.8.5. Strategy Overview

                16.1.8.5.1. Marketing Strategy

        16.1.9. Boston Analytical

            16.1.9.1. Overview

            16.1.9.2. Product Portfolio

            16.1.9.3. Profitability by Market Segments

            16.1.9.4. Sales Footprint

            16.1.9.5. Strategy Overview

                16.1.9.5.1. Marketing Strategy

        16.1.10. Pace Analytical Life Sciences

            16.1.10.1. Overview

            16.1.10.2. Product Portfolio

            16.1.10.3. Profitability by Market Segments

            16.1.10.4. Sales Footprint

            16.1.10.5. Strategy Overview

                16.1.10.5.1. Marketing Strategy

        16.1.11. SOTAX

            16.1.11.1. Overview

            16.1.11.2. Product Portfolio

            16.1.11.3. Profitability by Market Segments

            16.1.11.4. Sales Footprint

            16.1.11.5. Strategy Overview

                16.1.11.5.1. Marketing Strategy

        16.1.12. AMRI

            16.1.12.1. Overview

            16.1.12.2. Product Portfolio

            16.1.12.3. Profitability by Market Segments

            16.1.12.4. Sales Footprint

            16.1.12.5. Strategy Overview

                16.1.12.5.1. Marketing Strategy

        16.1.13. SGS SA

            16.1.13.1. Overview

            16.1.13.2. Product Portfolio

            16.1.13.3. Profitability by Market Segments

            16.1.13.4. Sales Footprint

            16.1.13.5. Strategy Overview

                16.1.13.5.1. Marketing Strategy

17. Assumptions & Acronyms Used

18. Research Methodology

Don't pay for what you don't need

Customize your report by selecting specific countries or regions and save 30%!

List of Tables

Table 1: Global Market Value (US$ Million) Forecast by Region, 2018 to 2033

Table 2: Global Market Value (US$ Million) Forecast by Method, 2018 to 2033

Table 3: Global Market Value (US$ Million) Forecast by Dosage Form, 2018 to 2033

Table 4: Global Market Value (US$ Million) Forecast by Dissolution Apparatus, 2018 to 2033

Table 5: North America Market Value (US$ Million) Forecast by Country, 2018 to 2033

Table 6: North America Market Value (US$ Million) Forecast by Method, 2018 to 2033

Table 7: North America Market Value (US$ Million) Forecast by Dosage Form, 2018 to 2033

Table 8: North America Market Value (US$ Million) Forecast by Dissolution Apparatus, 2018 to 2033

Table 9: Latin America Market Value (US$ Million) Forecast by Country, 2018 to 2033

Table 10: Latin America Market Value (US$ Million) Forecast by Method, 2018 to 2033

Table 11: Latin America Market Value (US$ Million) Forecast by Dosage Form, 2018 to 2033

Table 12: Latin America Market Value (US$ Million) Forecast by Dissolution Apparatus, 2018 to 2033

Table 13: Europe Market Value (US$ Million) Forecast by Country, 2018 to 2033

Table 14: Europe Market Value (US$ Million) Forecast by Method, 2018 to 2033

Table 15: Europe Market Value (US$ Million) Forecast by Dosage Form, 2018 to 2033

Table 16: Europe Market Value (US$ Million) Forecast by Dissolution Apparatus, 2018 to 2033

Table 17: Asia Pacific Market Value (US$ Million) Forecast by Country, 2018 to 2033

Table 18: Asia Pacific Market Value (US$ Million) Forecast by Method, 2018 to 2033

Table 19: Asia Pacific Market Value (US$ Million) Forecast by Dosage Form, 2018 to 2033

Table 20: Asia Pacific Market Value (US$ Million) Forecast by Dissolution Apparatus, 2018 to 2033

Table 21: MEA Market Value (US$ Million) Forecast by Country, 2018 to 2033

Table 22: MEA Market Value (US$ Million) Forecast by Method, 2018 to 2033

Table 23: MEA Market Value (US$ Million) Forecast by Dosage Form, 2018 to 2033

Table 24: MEA Market Value (US$ Million) Forecast by Dissolution Apparatus, 2018 to 2033
Sabyasachi Ghosh
Sabyasachi Ghosh

Principal Consultant

Talk to Analyst

Find your sweet spots for generating winning opportunities in this market.

List of Charts

Figure 1: Global Market Value (US$ Million) by Method, 2023 to 2033

Figure 2: Global Market Value (US$ Million) by Dosage Form, 2023 to 2033

Figure 3: Global Market Value (US$ Million) by Dissolution Apparatus, 2023 to 2033

Figure 4: Global Market Value (US$ Million) by Region, 2023 to 2033

Figure 5: Global Market Value (US$ Million) Analysis by Region, 2018 to 2033

Figure 6: Global Market Value Share (%) and BPS Analysis by Region, 2023 to 2033

Figure 7: Global Market Y-o-Y Growth (%) Projections by Region, 2023 to 2033

Figure 8: Global Market Value (US$ Million) Analysis by Method, 2018 to 2033

Figure 9: Global Market Value Share (%) and BPS Analysis by Method, 2023 to 2033

Figure 10: Global Market Y-o-Y Growth (%) Projections by Method, 2023 to 2033

Figure 11: Global Market Value (US$ Million) Analysis by Dosage Form, 2018 to 2033

Figure 12: Global Market Value Share (%) and BPS Analysis by Dosage Form, 2023 to 2033

Figure 13: Global Market Y-o-Y Growth (%) Projections by Dosage Form, 2023 to 2033

Figure 14: Global Market Value (US$ Million) Analysis by Dissolution Apparatus, 2018 to 2033

Figure 15: Global Market Value Share (%) and BPS Analysis by Dissolution Apparatus, 2023 to 2033

Figure 16: Global Market Y-o-Y Growth (%) Projections by Dissolution Apparatus, 2023 to 2033

Figure 17: Global Market Attractiveness by Method, 2023 to 2033

Figure 18: Global Market Attractiveness by Dosage Form, 2023 to 2033

Figure 19: Global Market Attractiveness by Dissolution Apparatus, 2023 to 2033

Figure 20: Global Market Attractiveness by Region, 2023 to 2033

Figure 21: North America Market Value (US$ Million) by Method, 2023 to 2033

Figure 22: North America Market Value (US$ Million) by Dosage Form, 2023 to 2033

Figure 23: North America Market Value (US$ Million) by Dissolution Apparatus, 2023 to 2033

Figure 24: North America Market Value (US$ Million) by Country, 2023 to 2033

Figure 25: North America Market Value (US$ Million) Analysis by Country, 2018 to 2033

Figure 26: North America Market Value Share (%) and BPS Analysis by Country, 2023 to 2033

Figure 27: North America Market Y-o-Y Growth (%) Projections by Country, 2023 to 2033

Figure 28: North America Market Value (US$ Million) Analysis by Method, 2018 to 2033

Figure 29: North America Market Value Share (%) and BPS Analysis by Method, 2023 to 2033

Figure 30: North America Market Y-o-Y Growth (%) Projections by Method, 2023 to 2033

Figure 31: North America Market Value (US$ Million) Analysis by Dosage Form, 2018 to 2033

Figure 32: North America Market Value Share (%) and BPS Analysis by Dosage Form, 2023 to 2033

Figure 33: North America Market Y-o-Y Growth (%) Projections by Dosage Form, 2023 to 2033

Figure 34: North America Market Value (US$ Million) Analysis by Dissolution Apparatus, 2018 to 2033

Figure 35: North America Market Value Share (%) and BPS Analysis by Dissolution Apparatus, 2023 to 2033

Figure 36: North America Market Y-o-Y Growth (%) Projections by Dissolution Apparatus, 2023 to 2033

Figure 37: North America Market Attractiveness by Method, 2023 to 2033

Figure 38: North America Market Attractiveness by Dosage Form, 2023 to 2033

Figure 39: North America Market Attractiveness by Dissolution Apparatus, 2023 to 2033

Figure 40: North America Market Attractiveness by Country, 2023 to 2033

Figure 41: Latin America Market Value (US$ Million) by Method, 2023 to 2033

Figure 42: Latin America Market Value (US$ Million) by Dosage Form, 2023 to 2033

Figure 43: Latin America Market Value (US$ Million) by Dissolution Apparatus, 2023 to 2033

Figure 44: Latin America Market Value (US$ Million) by Country, 2023 to 2033

Figure 45: Latin America Market Value (US$ Million) Analysis by Country, 2018 to 2033

Figure 46: Latin America Market Value Share (%) and BPS Analysis by Country, 2023 to 2033

Figure 47: Latin America Market Y-o-Y Growth (%) Projections by Country, 2023 to 2033

Figure 48: Latin America Market Value (US$ Million) Analysis by Method, 2018 to 2033

Figure 49: Latin America Market Value Share (%) and BPS Analysis by Method, 2023 to 2033

Figure 50: Latin America Market Y-o-Y Growth (%) Projections by Method, 2023 to 2033

Figure 51: Latin America Market Value (US$ Million) Analysis by Dosage Form, 2018 to 2033

Figure 52: Latin America Market Value Share (%) and BPS Analysis by Dosage Form, 2023 to 2033

Figure 53: Latin America Market Y-o-Y Growth (%) Projections by Dosage Form, 2023 to 2033

Figure 54: Latin America Market Value (US$ Million) Analysis by Dissolution Apparatus, 2018 to 2033

Figure 55: Latin America Market Value Share (%) and BPS Analysis by Dissolution Apparatus, 2023 to 2033

Figure 56: Latin America Market Y-o-Y Growth (%) Projections by Dissolution Apparatus, 2023 to 2033

Figure 57: Latin America Market Attractiveness by Method, 2023 to 2033

Figure 58: Latin America Market Attractiveness by Dosage Form, 2023 to 2033

Figure 59: Latin America Market Attractiveness by Dissolution Apparatus, 2023 to 2033

Figure 60: Latin America Market Attractiveness by Country, 2023 to 2033

Figure 61: Europe Market Value (US$ Million) by Method, 2023 to 2033

Figure 62: Europe Market Value (US$ Million) by Dosage Form, 2023 to 2033

Figure 63: Europe Market Value (US$ Million) by Dissolution Apparatus, 2023 to 2033

Figure 64: Europe Market Value (US$ Million) by Country, 2023 to 2033

Figure 65: Europe Market Value (US$ Million) Analysis by Country, 2018 to 2033

Figure 66: Europe Market Value Share (%) and BPS Analysis by Country, 2023 to 2033

Figure 67: Europe Market Y-o-Y Growth (%) Projections by Country, 2023 to 2033

Figure 68: Europe Market Value (US$ Million) Analysis by Method, 2018 to 2033

Figure 69: Europe Market Value Share (%) and BPS Analysis by Method, 2023 to 2033

Figure 70: Europe Market Y-o-Y Growth (%) Projections by Method, 2023 to 2033

Figure 71: Europe Market Value (US$ Million) Analysis by Dosage Form, 2018 to 2033

Figure 72: Europe Market Value Share (%) and BPS Analysis by Dosage Form, 2023 to 2033

Figure 73: Europe Market Y-o-Y Growth (%) Projections by Dosage Form, 2023 to 2033

Figure 74: Europe Market Value (US$ Million) Analysis by Dissolution Apparatus, 2018 to 2033

Figure 75: Europe Market Value Share (%) and BPS Analysis by Dissolution Apparatus, 2023 to 2033

Figure 76: Europe Market Y-o-Y Growth (%) Projections by Dissolution Apparatus, 2023 to 2033

Figure 77: Europe Market Attractiveness by Method, 2023 to 2033

Figure 78: Europe Market Attractiveness by Dosage Form, 2023 to 2033

Figure 79: Europe Market Attractiveness by Dissolution Apparatus, 2023 to 2033

Figure 80: Europe Market Attractiveness by Country, 2023 to 2033

Figure 81: Asia Pacific Market Value (US$ Million) by Method, 2023 to 2033

Figure 82: Asia Pacific Market Value (US$ Million) by Dosage Form, 2023 to 2033

Figure 83: Asia Pacific Market Value (US$ Million) by Dissolution Apparatus, 2023 to 2033

Figure 84: Asia Pacific Market Value (US$ Million) by Country, 2023 to 2033

Figure 85: Asia Pacific Market Value (US$ Million) Analysis by Country, 2018 to 2033

Figure 86: Asia Pacific Market Value Share (%) and BPS Analysis by Country, 2023 to 2033

Figure 87: Asia Pacific Market Y-o-Y Growth (%) Projections by Country, 2023 to 2033

Figure 88: Asia Pacific Market Value (US$ Million) Analysis by Method, 2018 to 2033

Figure 89: Asia Pacific Market Value Share (%) and BPS Analysis by Method, 2023 to 2033

Figure 90: Asia Pacific Market Y-o-Y Growth (%) Projections by Method, 2023 to 2033

Figure 91: Asia Pacific Market Value (US$ Million) Analysis by Dosage Form, 2018 to 2033

Figure 92: Asia Pacific Market Value Share (%) and BPS Analysis by Dosage Form, 2023 to 2033

Figure 93: Asia Pacific Market Y-o-Y Growth (%) Projections by Dosage Form, 2023 to 2033

Figure 94: Asia Pacific Market Value (US$ Million) Analysis by Dissolution Apparatus, 2018 to 2033

Figure 95: Asia Pacific Market Value Share (%) and BPS Analysis by Dissolution Apparatus, 2023 to 2033

Figure 96: Asia Pacific Market Y-o-Y Growth (%) Projections by Dissolution Apparatus, 2023 to 2033

Figure 97: Asia Pacific Market Attractiveness by Method, 2023 to 2033

Figure 98: Asia Pacific Market Attractiveness by Dosage Form, 2023 to 2033

Figure 99: Asia Pacific Market Attractiveness by Dissolution Apparatus, 2023 to 2033

Figure 100: Asia Pacific Market Attractiveness by Country, 2023 to 2033

Figure 101: MEA Market Value (US$ Million) by Method, 2023 to 2033

Figure 102: MEA Market Value (US$ Million) by Dosage Form, 2023 to 2033

Figure 103: MEA Market Value (US$ Million) by Dissolution Apparatus, 2023 to 2033

Figure 104: MEA Market Value (US$ Million) by Country, 2023 to 2033

Figure 105: MEA Market Value (US$ Million) Analysis by Country, 2018 to 2033

Figure 106: MEA Market Value Share (%) and BPS Analysis by Country, 2023 to 2033

Figure 107: MEA Market Y-o-Y Growth (%) Projections by Country, 2023 to 2033

Figure 108: MEA Market Value (US$ Million) Analysis by Method, 2018 to 2033

Figure 109: MEA Market Value Share (%) and BPS Analysis by Method, 2023 to 2033

Figure 110: MEA Market Y-o-Y Growth (%) Projections by Method, 2023 to 2033

Figure 111: MEA Market Value (US$ Million) Analysis by Dosage Form, 2018 to 2033

Figure 112: MEA Market Value Share (%) and BPS Analysis by Dosage Form, 2023 to 2033

Figure 113: MEA Market Y-o-Y Growth (%) Projections by Dosage Form, 2023 to 2033

Figure 114: MEA Market Value (US$ Million) Analysis by Dissolution Apparatus, 2018 to 2033

Figure 115: MEA Market Value Share (%) and BPS Analysis by Dissolution Apparatus, 2023 to 2033

Figure 116: MEA Market Y-o-Y Growth (%) Projections by Dissolution Apparatus, 2023 to 2033

Figure 117: MEA Market Attractiveness by Method, 2023 to 2033

Figure 118: MEA Market Attractiveness by Dosage Form, 2023 to 2033

Figure 119: MEA Market Attractiveness by Dissolution Apparatus, 2023 to 2033

Figure 120: MEA Market Attractiveness by Country, 2023 to 2033

Recommendations

Consumer Product

Pharmaceutical eCommerce Market

Published : March 2024

Chemicals & Materials

Pharmaceutical Solvents Market

Published : May 2023

Healthcare

Pharmaceutical Drug Delivery Market

Published : January 2023

Explore Healthcare Insights

View Reports

Pharmaceutical Dissolution Testing Services Market