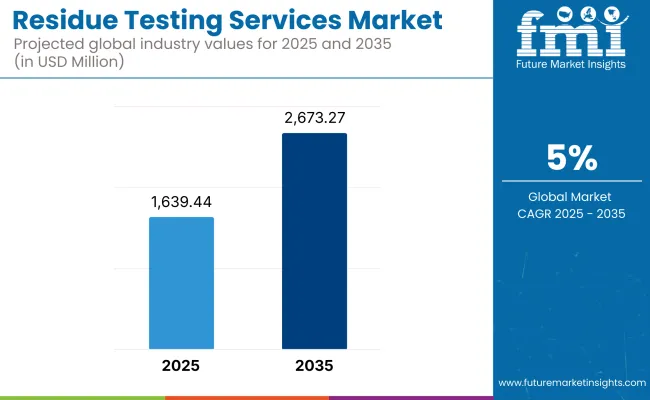
The Residue Testing Services Market is expected to reach USD 1,639.44 million by 2025 and expand steadily to USD 2,673.27 million by 2035, marking a CAGR of 5.0% over the forecast period.

| Attributes | Description |
|---|---|
| Estimated Global Residue Testing Services Industry Size (2025E) | USD 1,639.44 million |
| Projected Global Residue Testing Services Industry Value (2035F) | USD 2,673.27 million |
| Value-based CAGR (2025 to 2035) | 5.0% |
This growth trajectory is underpinned by increasing concerns about chemical contamination in food and agricultural commodities. Across regions, North America is anticipated to emerge as the most lucrative market owing to its stringent safety standards and enforcement mechanisms. Meanwhile, Asia-Pacific is expected to grow at the fastest pace between 2025 and 2035, driven by rising export demands and regulatory harmonization across economies like China, Japan, and South Korea.
Growth within the residue testing market has been largely stimulated by the growing global emphasis on food safety and international trade compliance. Export-oriented economies have been compelled to adopt comprehensive residue screening procedures to meet the import requirements of developed countries, especially those in the EU and the USA On the other hand, governments are imposing stricter maximum residue limits (MRLs), compelling food and feed manufacturers to ensure chemical-free products.
However, the market has encountered cost-related challenges-particularly for small and mid-sized enterprises-due to the capital-intensive nature of high-precision analytical technologies. Nonetheless, market trends remain favorable, with increased deployment of multi-residue detection systems, expanding test panels, and growing preference for third-party verification. Notably, players are streamlining lab operations using AI-powered analytics and automated sample prep to enhance throughput and compliance readiness.
Between 2025 and 2035, the market is projected to witness a shift toward integrated, rapid, and portable testing platforms that provide real-time results at farms, processing units, and ports. Residue testing services are likely to expand beyond pesticides and veterinary drugs into broader categories like endocrine disruptors, dioxins, PFAS, and persistent organic pollutants (POPs). '
Additionally, regulatory convergence under Codex Alimentarius and ISO standards is anticipated to shape a more unified framework for residue monitoring globally. As this evolution unfolds, stakeholders across agriculture, food processing, retail, and regulatory compliance will increasingly embed testing protocols not just as a risk mitigation step but as a brand trust and market access strategy.
The below table presents a comparative assessment of the variation in CAGR over six months for the base year (2023) and current year (2024) for the global Residue Testing Services market. This analysis reveals crucial shifts in performance and indicates revenue realization patterns, thus providing stakeholders with a better vision of the growth trajectory over the year. The first half of the year, or H1, spans from January to June. The second half, H2, includes the months from July to December.
| Particular | Value CAGR |
|---|---|
| H1 | 4.7% (2024 to 2034) |
| H2 | 4.8% (2024 to 2034) |
| H1 | 4.9% (2025 to 2035) |
| H2 | 5.0% (2025 to 2035) |
In the first half (H1) of the decade from 2025 to 2035, the business is predicted to surge at a CAGR of 4.7%, followed by a higher growth rate of 4.8% in the second half (H2) of the same decade. Moving into the subsequent period, from H1 2024 to H2 2034, the CAGR is projected to increase to 4.9% in the first half and remain considerably high at 5.0% in the second half. In the first half (H1) the sector witnessed an increase of 15 BPS while in the second half (H2), the business witnessed a decrease of 10 BPS.

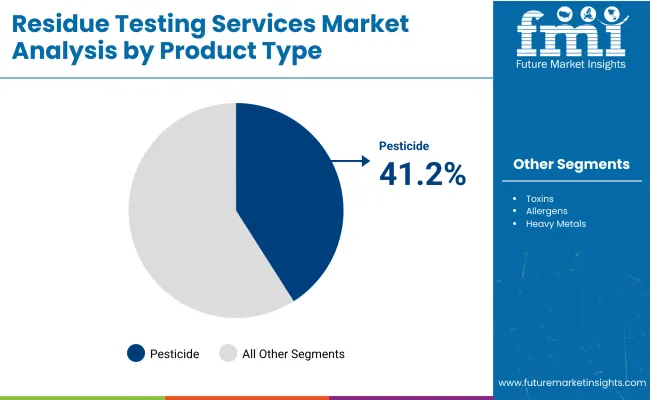
Pesticide residue testing is projected to maintain the largest segment share at 41.2% in 2025, supported by its indispensable role in trade certification, consumer safety, and regulatory adherence. Its dominance reflects the widening global gap between agricultural chemical use and market access conditions-particularly across the EU, USA., and Japan, where maximum residue limits (MRLs) continue to tighten.
Strategically, this segment serves as the linchpin of the residue testing market, as governments and retailers reinforce zero-tolerance policies for unapproved or excessive pesticide residues. The need for validated, multi-analyte detection methods has accelerated adoption of LC-MS/MS and GC-MS-based technologies, especially in export-driven economies navigating cross-border trade frameworks. Pesticide testing is no longer limited to compliance enforcement-it is increasingly being leveraged to unlock premium markets and establish provenance-linked transparency.
Amid growing demand for organic and minimally treated produce, this segment is positioned to evolve from a post-harvest checkpoint into a continuous validation tool embedded across the agricultural value chain.
By 2035, service providers who can bundle high-throughput testing, AI-driven reporting, and regulatory consulting will likely consolidate share. As sustainability pressures mount, the segment may also intersect with environmental surveillance, targeting pesticide drift, soil health, and biodiversity impact-broadening its future strategic footprint.
Veterinary drug residue testing is anticipated to register a steady CAGR of approximately 5.2% between 2025 and 2035, supported by mounting pressure on meat and dairy producers to comply with both domestic food safety mandates and international trade protocols. Although smaller in current market share compared to pesticide residue testing, this segment is rapidly becoming integral to export eligibility and animal welfare assurance frameworks.
As antimicrobial resistance (AMR) rises on the global policy agenda, veterinary drug monitoring is shifting from periodic surveillance to proactive control embedded within certification programs. Countries participating in high-value meat export markets-such as Brazil, Australia, and India-are increasingly reliant on drug residue testing to satisfy EU and USA import protocols, particularly for antibiotics, anti-inflammatories, and growth promoters. Emerging digital traceability systems are further amplifying the role of this segment, tying test data directly to producer accountability and retailer assurance.
Looking ahead, growth in this segment is expected to be catalyzed by next-generation rapid assays, blockchain-linked testing records, and standardized withdrawal period compliance checks. As global livestock systems intensify and consumer expectations rise, veterinary drug residue testing will evolve from a compliance burden into a strategic enabler of supply chain transparency, brand protection, and trade continuity.
Growth of On-Site and Portable Residue Testing Solutions
With the advent of newer technologies such as on-site and portable residue testing, the residue screening industry has been revolutionized by demand for expedited results; operational efficiency, and cost-effectiveness. Although conventional laboratory-based residue testing methods are highly reliable and accurate, they can involve lengthy procedures, high costs, and logistical obstacles.
Rapid decision-making is crucial in industries like agriculture, food safety, and environmental monitoring, which explains the growing demand for portable testing solutions.
Quick identification and analysis of chemical residues can be achieved through small, portable residue testing equipment that can detect them directly at the site of sampling, such as water sources, food processing facilities, or farms.
These measures decrease the time required to collect samples before results are sent out, allowing stakeholders to quickly address potential contamination problems. This is particularly relevant, especially in sectors such as fresh produce and dairy products, where delays in testing are a significant risk to both the economy and health.
Technology Advancements have led to the development and adoption of portable testing solutions. Contemporary devices incorporate technologies such as immunoassay, miniaturized chromatography systems, and biosensors with easy-to-use interfaces within compact structures and high analytical capabilities.
Shift Toward Comprehensive Testing for Emerging Contaminants Shapes the Market
Recently, there has been a shift in the way residue testing is conducted due to the focus on thoroughly analyzing emerging contaminants. There are multiple reasons for this change, including the emergence of new health issues, and improvements in analytical methods and regulatory frameworks.
New contaminants such as EDCs, pharmaceuticals, and microplastic substances like novel insecticides have been deemed hazardous to the environment due to their potential health effects. This leads to a surge in the need for improved and more efficient testing methods.'
Testing for residues in the past was mainly limited to specific chemicals, including antibiotics, heavy metals, and conventional pesticides. Despite this, scientific knowledge has led to the identification of new hazards as major risks. Surface and groundwater contain substances that are used by humans and animals, causing concerns about their impact on aquatic life and human health.
The extensive presence of microplastics in the food chain has caused global concerns about their long-term effects. Hence, it is imperative to employ robust testing methods that can identify emerging contaminants and ensure the safety of human and environmental health.
Collaboration with Agritech Companies for Precision Testing Solutions Impelling Market Growth
Collaboration with Agritech enterprises to offer precision testing solutions is a fast-expanding opportunity in the residue testing market, fueled by technological improvements, the need for sustainable farming practices, and more regulatory scrutiny.
Through the use of Agritech companies' expertise in creating cutting-edge tools and platforms, including precision farming technologies, data analytics, and sensor-based monitoring systems, this collaboration will enhance residue testing. These partnerships are changing the landscape of residue testing by allowing stakeholders across the agricultural and food value chain to handle contamination concerns more comprehensively and effectively.
Agritech firms specialize in precision agriculture, which employs technology to optimize farming techniques by delivering targeted inputs, monitoring crops and soil in real time, and eliminating resource waste. Chemical residues, such as pesticides and other herbicide ingredients or fertilizers in agricultural products, can be detected early in these collaborations by integrating residue testing into precision agriculture systems.
By utilizing spectroscopic or hyperspectral imaging technologies, smart sensors, and drones can detect residue hot spots in fields to enable targeted interventions. This minimizes the possibility of tainted crops reaching consumers and mitigates the environmental damage resulting from excessive chemical use.
Tier 1 companies are referred to be major industry players since they are well-established globally and control the majority of the business ecosystem. These corporations make use of their extensive resources, strong research and development skills, and global operating presence. These industry leaders are trendsetters, continually investing in cutting-edge testing procedures and technology such as advanced chromatography, spectrometry, and portable residue testing systems.
Tier 2 Companies are the regional players with adequate market coverage. These companies offer customized residue testing services and specialize in adjusting to regional restrictions and client preferences. They frequently focus on certain sectors or local areas, providing tailored solutions to match regional demand.
Tier 3 Companies are smaller players who are usually limited to the local or regional areas. They tend to service localized areas and do not possess the same level of R&D as bigger companies but are nonetheless helpful in satisfying local requirements.
These companies are smaller in size but remain strong in their target industries owing to their customer service. Also, these companies emphasize traditional methods, techniques, artisanal production, or unique service offerings.
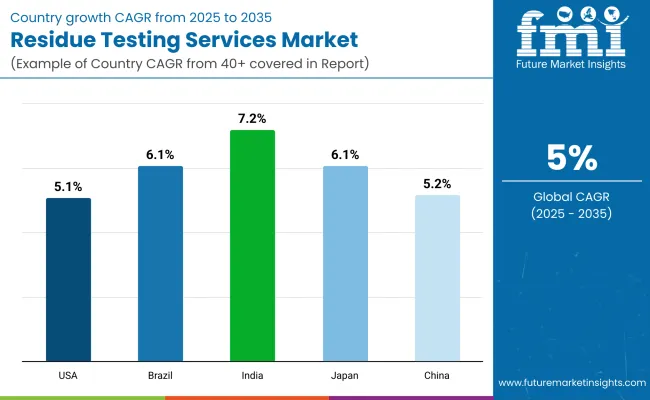
The following table shows the estimated growth rates of the top three territories. China and Japan are set to exhibit high consumption, recording CAGRs of 5.2% and 6.1%, respectively, through 2035.

| Countries | CAGR 2025 to 2035 |
|---|---|
| The USA | 5.1% |
| Brazil | 6.1% |
| India | 7.2% |
| Japan | 6.1% |
| China | 5.2% |
The substantial agricultural sector in the United States has a major role in the nation's dominance of the residue testing market. Being a major exporter of food and agricultural products, the nation follows strict international residue testing regulations to be competitive in global markets.
For instance, USA exporters must comply with the severe pesticide residue regulations set forth by the European Union, which demand strong testing capabilities, to avoid trade restrictions and fines. This has increased demand for residue testing services, especially from large companies and exporters.
Government programs and funding that enhance food safety and residue management also support the USA market. For example, the FDA’s Pesticide Monitoring Program, which works with state-level agencies, has increased the accessibility and scope of residue testing services and increased the number of small and medium-sized businesses (SMEs) that use these services by educating them about the value of residue testing.
The modernization of its food safety procedures and the growing requirement to adhere to national and international regulatory standards are driving a notable acceleration in India's use of residue testing services.
The Food Safety and Standards Authority of India (FSSAI) has played a significant part in this transition by imposing tight restrictions on contaminants such as pesticides, toxins, allergies, heavy metals, and poisons in agricultural and food goods. These processes are essential in dealing with the growing concerns about chemical contamination and foodborne illnesses, which have arisen as a result of intensive farming practices and pesticide use.
With the development of e-commerce and optimized access to information, Indian consumers are growing increasingly concerned about the safety and quality of their food. This has pushed manufacturers, retailers, and supply chain stakeholders to implement stringent residue testing techniques.
As per Product Type, the industry has been categorized into Pesticides, Toxins, Allergens, Heavy Metals, and Others.
As per Technology, the industry has been categorized into Chromatography, Immunoassay, Spectroscopy, and Others.
This segment is further categorized into Animal Feed, Pet Food, Dairy, Processed Foods, Agricultural Crops, and Others.
Industry analysis has been carried out in key countries of North America, Latin America, Western Europe, Eastern Europe, East Asia, South Asia & Pacific, Central Asia, Russia and Belarus, Balkan & Baltics, and the Middle East & Africa.
The global industry is estimated at a value of USD 1,639.44 million in 2025.
Sales increased at 4.5% CAGR between 2020 and 2024.
Some of the leaders in this industry are SGS S.A., ALS Limited, Eurofins Scientific, AB SCIEX, Bureau Veritas S.A., Intertek Group PLC, Arbro Pharmaceuticals Private Limited, Fera Science Limited, AGQ Labs USA, Waters Agricultural Laboratories, and Scicorp Laboratories PTY Ltd., among others.
The North American territory is projected to hold a revenue share of 29.4% over the forecast period.
The industry is projected to grow at a forecast CAGR of 5.0% from 2025 to 2035.


Full Research Suite comprises of:
Market outlook & trends analysis
Interviews & case studies
Strategic recommendations
Vendor profiles & capabilities analysis
5-year forecasts
8 regions and 60+ country-level data splits
Market segment data splits
12 months of continuous data updates
DELIVERED AS:
PDF EXCEL ONLINE
Residue Hydrodesulphurization Catalyst Market
Micro Carbon Residue Tester Market Size and Share Forecast Outlook 2025 to 2035
Testing, Inspection & Certification Market Growth – Trends & Forecast 2025 to 2035
5G Testing Market Size and Share Forecast Outlook 2025 to 2035
AB Testing Software Market Size and Share Forecast Outlook 2025 to 2035
5G Testing Equipment Market Analysis - Size, Growth, and Forecast 2025 to 2035
Eye Testing Equipment Market Size and Share Forecast Outlook 2025 to 2035
HSV Testing Market Size and Share Forecast Outlook 2025 to 2035
IoT Testing Equipment Market Size and Share Forecast Outlook 2025 to 2035
HPV Testing and Pap Test Market Size and Share Forecast Outlook 2025 to 2035
LTE Testing Equipment Market Growth – Trends & Forecast 2019-2027
GMO Testing Services Market Insights – Food Safety & Regulatory Compliance 2024 to 2034
GMP Testing Services Market
Drug Testing Systems Market Size and Share Forecast Outlook 2025 to 2035
Sand Testing Equipments Market Size and Share Forecast Outlook 2025 to 2035
Tire Testing Machine Market Size and Share Forecast Outlook 2025 to 2035
Self-Testing Market Analysis - Size, Share, and Forecast 2025 to 2035
Bend Testing Machine Market Growth - Trends & Forecast 2025 to 2035
An Analysis of the Leak testing Machine Market by Detectors and Sensors Hardware Type through 2035
Soil Testing Market Growth - Trends & Forecast 2025 to 2035

Thank you!
You will receive an email from our Business Development Manager. Please be sure to check your SPAM/JUNK folder too.
Chat With
MaRIA