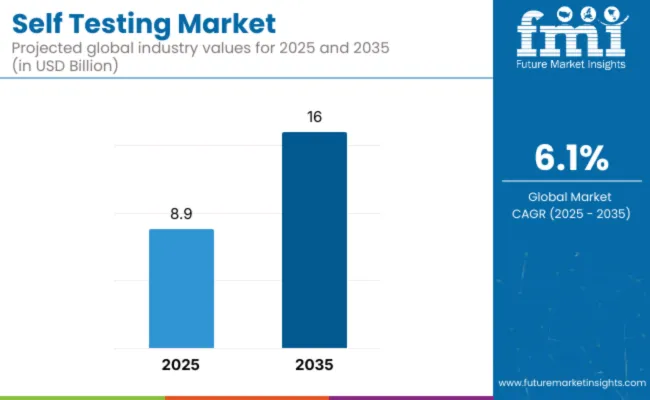
The global self-testing Market is estimated to be valued at USD 8.9 billion in 2025 and is projected to reach USD 16 billion by 2035, registering a compound annual growth rate of 6.1% over the forecast period.
| Attributes | Key Insights |
|---|---|
| Industry Size (2025E) | USD 8.9 billion |
| Industry Value (2035F) | USD 16 billion |
| CAGR (2025 to 2035) | 6.1% |
The self testing market has been evolving rapidly as consumers increasingly demand greater autonomy over health monitoring and disease prevention. Rising chronic disease prevalence, supportive regulatory policies for over-the-counter diagnostics, and the proliferation of connected health devices have all contributed to accelerating adoption.
Digitalization has played a pivotal role in expanding the market’s capabilities, with smartphone apps, Bluetooth-enabled monitors, and cloud integration redefining how patients interact with test results. The COVID-19 pandemic further legitimized self testing as an essential healthcare modality, demonstrating its value for infectious disease surveillance and chronic care management alike. Companies are expected to invest heavily in digital engagement tools and AI-powered analytics to enhance patient adherence and real-time disease tracking.
The self-testing market in 2025 displays notable differences in per capita usage across leading economies, shaped by national healthcare policies, distribution capabilities, and demographic scale. Countries with robust public health systems and early adoption of mass testing strategies have recorded higher levels of self-testing activity.
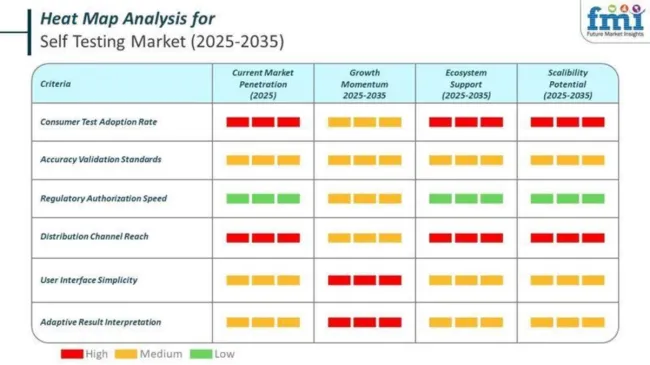
A comparative analysis of fluctuations in the compound annual growth rate (CAGR) for the self-testing industry outlook between 2024 and 2025, presented on a six-month basis, is shown below. Through this examination, major variations in the performance of these markets are revealed, and trends in revenue generation are identified, thereby providing stakeholders with valuable insights into how to continue the market’s growth path in any given year. January through June covers the first part of the year, called half 1 (H1), while half 2 (H2) represents July to December.
The table below compares the compound annual growth rate (CAGR) for the global self-testing market from 2024 to 2025 during the first half of the year. This overview highlights key changes and trends in revenue growth, offering valuable insights into market dynamics. Here, H1 represents the time from January to June, and H2 represents the time from July to December. For the decade 2024 to 2034, the business is predicted to surge at a CAGR of 6.4%, followed by a slightly lower growth rate of 6.8% in the second half.
| Particular | Value CAGR |
|---|---|
| H1 (2024 to 2034) | 6.4% |
| H2 (20 24 to 2034) | 6.8% |
| H1 (2025 to 2035) | 6.1% |
| H2 (2025 to 2035) | 6.7% |
However, in the next decade, from 2025 to 2035, H1 is projected to experience a slight decline in growth to 6.1%. Similarly, H2 in this decade is also expected to experience a slight decrease, reaching 6.7% growth. During the H1 period, the market experienced a 30-basis-point decrease, and in H2, it declined by 11.3 basis points.
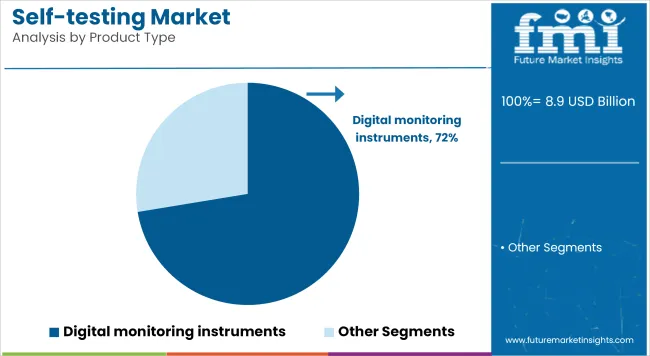
Digital Monitoring Instruments is accounting for revenue share of 72.4% which reflects their key role in transforming self testing into an actionable, connected health practice. Growth has been driven by technological advancements in biosensor accuracy, miniaturization, and Bluetooth-enabled data transmission.
Patients have increasingly preferred digital devices because they enable seamless tracking of key biomarkers and integration with personal health records. Manufacturers have invested in smartphone-compatible platforms that offer real-time alerts and tailored health recommendations, improving engagement and compliance. Future adoption is expected to expand further as interoperability improves and remote patient monitoring is reimbursed by insurers, fostering even greater reliance on digital solutions.
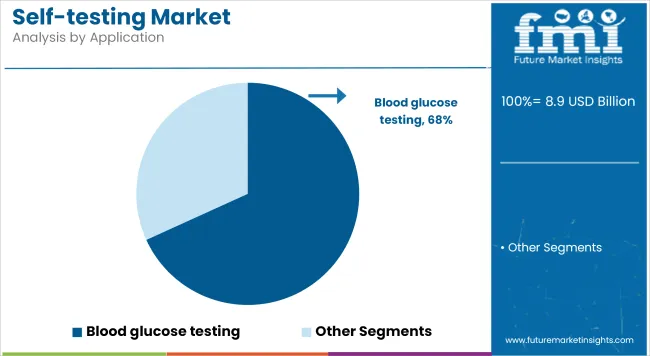
Blood Glucose Testing leads the market with a revenue share of 68.2%, highlighting its foundational role in chronic diabetes management. Diabetes prevalence has continued to rise globally, prompting patients and providers to prioritize consistent, accurate monitoring to prevent complications.
Regulatory approvals for more compact, user-friendly glucometers and continuous glucose monitoring devices have supported adoption. Additionally, educational initiatives have raised awareness of self-monitoring benefits, driving higher utilization among at-risk populations.
In the coming years, segment growth is anticipated to remain robust as healthcare systems emphasize proactive disease management and as real-time glucose monitoring becomes the standard of care in diabetes therapy.
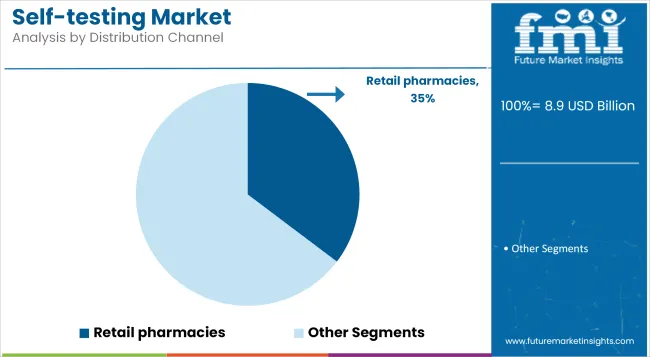
Retail Pharmacies holds a revenue share of 35.3% in 2025. Growth has been driven by the broad footprint of retail chains, which enable convenient, in-person access to self testing supplies. Pharmacists have played an essential role in guiding product selection, providing training, and supporting adherence to testing protocols.
Many retailers have expanded dedicated health sections and invested in digital kiosks that facilitate education and product comparison. Retail pharmacy chains are expected to retain their market share as they expand omni-channel strategies combining in-store pickup, home delivery, and e-commerce to meet evolving consumer preferences.
Rising Incidence of Chronic Diseases Fueling the Demand for Self-Testing Market
The rising incidences of chronic diseases, for example, diabetes, heart conditions, and infections, are very much responsible for the increased need for self-testing solutions. It has become simpler and less costly to monitor one's condition using self-testing rather than visiting healthcare facilities frequently, allowing for greater independence in managing one's health.
It aligns with the growing global focus on preventive health. Governments and healthcare institutions launched public awareness campaigns, encouraging people to track their well-being regularly, which increased the demand for self-diagnosis kits. The increasing prevalence of age-related chronic diseases in the aging populations of developed countries also raises the prospect for growth in this market. Self-testing technologies have become an effective way to manage chronic diseases in more manageable ways and minimize the costs associated with healthcare.
The growing use of self-monitoring devices for diseases such as hepatitis, thyroid disorders, and cholesterol management is diversifying the market. With an overall shift toward health awareness, the demand for accessible, accurate, and portable self-testing devices is expected to continue rising.
Technological Advancements in Diagnostics Boosting the Growth of the Self-Testing Market
Technological innovation has transformed the self-testing market, with the most advanced solutions offering unparalleled precision, usability, and functionality. Devices such as digital blood glucose monitors and smart blood pressure monitors are no longer used solely for basic readings. Instead, these devices are well integrated with mobile apps, cloud platforms, and AI-powered health analytics. Thus, users may monitor long-term health trends and receive alerts for abnormal readings. Users can even share real-time data with their healthcare providers.
For example, advanced glucometers synchronize with smartphone applications to generate detailed blood sugar reports that can explain the impacts of dietary and medication changes. Wearable technology, including continuous glucose monitors (CGMs), takes self-testing to a new level with non-invasive, 24/7 monitoring that ensures user convenience and real-time feedback. The integration of AI into devices further enhances functionality by delivering tailored health recommendations based on collected data trends.
Technological advancements also include diagnostic capabilities for infectious diseases and hormonal tracking. For instance, fertility monitors used at home now rely on advanced sensors and algorithms to predict the window of ovulation. Innovations like these address consumer demands for convenience, accuracy, and empowerment. As companies invest in R&D to improve affordability and expand device capabilities, technology remains a critical driver of market growth.
Rising Adoption of Telemedicine and AI-Integrated Devices in Self-Testing Market
The integration of telemedicine and AI-based technologies is opening transformational opportunities in the self-testing market. The COVID-19 pandemic further accelerated the adoption of digital health platforms, with digital consultations and home diagnostics becoming the new norm.
Self-testing devices, when connected seamlessly to telemedicine, allow patients to receive professional advice without ever visiting a clinic. Due to this convenience, consumer confidence in self-testing solutions, particularly for managing chronic diseases, continued to grow.
Patients who prefer personalized health solutions find such features appealing since they offer the opportunity to directly and remotely share the results with their healthcare providers, maintaining a constant bridge between patient and professional at a lowered cost without the need for personal visits. Additionally, AI integration enhances the functionality of self-testing kits to detect a broader range of conditions, including infectious diseases and mental health indicators.
As digital health infrastructure becomes increasingly focused on by governments and healthcare systems worldwide, future healthcare will begin to involve indispensable telemedicine-enabled, AI-powered self-testing devices.
Concerns About Accuracy and Misinterpretation Causing Reputational Damage to the Self-Testing Market
The integration of telemedicine and AI-based technologies is opening transformational opportunities in the self-testing market. Self-testing devices connected seamlessly with telemedicine allow patients to receive professional advice without ever visiting clinics. Due to this convenience, consumer confidence in self-testing solutions, particularly for managing chronic diseases, continued to grow.
The integration of AI into self-testing devices creates an additional layer of utility. These devices analyze hypothetical user data in real-time and serve active insights and recommendations. For instance, the ovulation tracker, integrated with AI, predicts the fertility window with greater precision, allowing women to plan their family accordingly.
Similarly, glucose monitors integrated with AI give dietary and medication advice that is oriented to blood sugar changes over time, thus improving diabetes management.
These developments are appealing to tech-savvy consumers who must have personalized healthcare solutions. The possibility of remote sharing of diagnostic results with healthcare providers facilitates timely interventions that bridge the gap between self-management and professional care. Additionally, AI integration extends the functionality of self-testing kits to include diagnosing a broader range of conditions-infectious diseases or imply indications of mental health.
With the digital health infrastructure increasingly prioritized by governments and healthcare systems worldwide, the future of healthcare will be filled with virtually indispensable telemedicine-powered, AI-enabled self-testing devices.
Tier 1 companies are dominating this self-testing market with a substantial 72.9% share. Industry giants such as F. Hoffmann-La Roche AG, Johnson & Johnson, Ascensia Diabetes Care Holdings AG, and B. Braun Melsungen AG are leading the way. Global leaders in this market offer comprehensive product portfolios encompassing advanced digital monitoring instruments, blood glucose meters, and sophisticated diagnostic kits.
Tier 2 companies include Procter & Gamble, Abbott Laboratories, Teleflex, and Medline Industries, which holds 11.7% of the self-testing market. Companies like these operate in emerging and niche markets, such as fertility monitoring and diagnosing infectious diseases. They work towards developing affordable and user-friendly self-testing products that can be available to people.
| Countries | Value CAGR (2025 to 2035) |
|---|---|
| United States | 3.0% |
| UK | 2.1% |
| Germany | 3.0% |
| Japan | 5.9% |
| India | 7.3% |
| China | 6.5% |
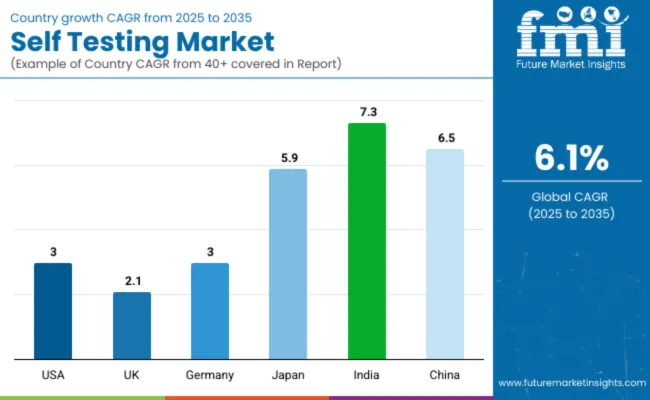
The self testing market demand analysis considers the significant countries of all regions, including North America, Latin America, East Asia, South Asia, and the Pacific, Western Europe, Eastern Europe, the Middle East, and Africa. In North America, the United States is predicted to remain first, with an annual growth rate of 3.0% over the next few years until 2035. On the other hand, India is expected to be the strongest in the South Asia and Pacific region, with an annual growth rate of 7.3% by 2035.
The United States dominates the global market, holding a significant share in 2024. The United States is expected to exhibit a CAGR of 3.0% throughout the forecast period (2025 to 2035).
The emphasis on preventive healthcare and the aging population drives sales of self-testing in the United States. Cholesterol testing, thyroid testing, and blood glucose monitoring are being adopted more frequently among the aging populace who seek home-based solutions for health monitoring.
With continually rising healthcare costs, consumers are seeking services that may be more affordable than those offered in traditional clinical settings. Furthermore, the well-developed healthcare infrastructure in the USA supports the market, enabling the offer of a wide variety of tests, ranging from cancer screenings to drug abuse testing.
The country's emphasis on individual health empowerment and continuous technological advancements contributes to the drive in innovation in the at-home testing sector. Additionally, the FDA and other regulatory agencies provide guidelines on the quality and accuracy of products, which enhances consumers' confidence in using these home tests for multiple health-related issues.
In 2024, Germany held a dominant revenue share in the Western European market and is expected to grow at a CAGR of 3.0%.
The driving factors for the market of self testing in Germany include a highly developed health care system in the country and increased awareness towards preventive health care. Demand for cholesterol tests, thyroid tests, and other cancer test applications is growing with an active attitude towards the management of health issues in Germany.
Another is the aging demographics of Germany that generally require easier, more convenient ways of monitoring chronic conditions like diabetes and heart disease. Additionally, Germany's strong regulatory framework ensures that at-home testing products meet high standards of accuracy and safety, thereby building confidence among consumers in these products.
With a healthcare system that emphasizes both in-clinic and home-based testing solutions, the market is benefiting from a combination of modern technology and public health awareness. Increasing acceptance of digital health solutions and mobile health apps is also expanding the adoption of at-home tests for various medical conditions.
India holds a leading value share in the South Asia and Pacific market in 2024 and is expected to grow at a CAGR of 7.3% during the forecast period.
India's self-testing market has been steadily rising due to increasing health consciousness, rising disposable incomes, and a shift towards home-based healthcare. One of the most populous countries in the world presents a huge healthcare burden with chronic disease rates like diabetes and hypertension, besides the huge incidence of infectious diseases such as tuberculosis, dengue, and malaria.
The advancing health burden has, therefore, pushed the demand for simple, cheap, and user-friendly self-testing solutions that enable patients to manage health from home with ease.
Government efforts are also critical in this regard to fast-track the adoption of self-testing devices in India. Several projects, such as the Ayushman Bharat Digital Mission, focusing on the use of digital healthcare platforms for telemedicine and home diagnostics, aim to address access to healthcare facilities in urban and rural sectors. Measures aimed at increasing public awareness and emphasizing the role that preventive healthcare plays in individual behaviors have prompted consumers to become more conscious of their health.
The penetration of telemedicine platforms aiding self-testing, particularly in rural areas, continues to rise. The companies are now integrating their self-testing devices with telemedicine services, enabling the diagnostic results to be shared over great distances with healthcare professionals.
Leading players in the self testing market have focused on innovation in connected devices, biosensor accuracy, and consumer engagement platforms. Strategic alliances between diagnostics manufacturers and digital health companies have resulted in integrated solutions combining devices, software, and data analytics.
Companies are also investing in partnerships with retail pharmacy chains to broaden distribution reach and deliver value-added services such as personalized coaching and subscription refills. Regulatory approvals for expanded at-home testing indications and reimbursement advances are further supporting competitive differentiation.
Key Development:
In 2024, Labcorp has received FDA Emergency Use Authorization (EUA) for its Mpox PCR Test Home Collection Kit. This marks the first FDA-authorized at-home collection kit for mpox diagnosis, allowing physicians to order it for suspected patients aged 18 and older.
In 2024, Teal Health's Teal Wand, the first FDA-approved at-home cervical cancer testing kit, is now available. This allows women to self-collect vaginal samples for HPV detection, offering a convenient new alternative to traditional clinic-based Pap smears and HPV tests.
| Report Attributes | Details |
|---|---|
| Current Total Market Size (2025) | USD 8.9 billion |
| Projected Market Size (2035) | USD 16 billion |
| CAGR (2025 to 2035) | 6.1% |
| Base Year for Estimation | 2024 |
| Historical Period | 2020 to 2024 |
| Projections Period | 2025 to 2035 |
| Quantitative Units | USD million for value and million units for volume |
| Product Types Analyzed (Segment 1) | Digital Monitoring Instruments, Cassettes, Midstreams, Strips, Cups, Dip Cards, Test Panels, Others |
| Applications Analyzed (Segment 2) | Blood Glucose Testing, Pregnancy & Fertility Testing, Cancer Testing, STD/STI Testing, Drug of Abuse Testing, Cholesterol Testing, HIV Testing, Thyroid Testing, Others |
| Sample Types Analyzed (Segment 3) | Urine, Blood, Saliva, Stool, Vaginal Swab, Semen |
| Distribution Channels Analyzed (Segment 4) | Retail Pharmacies, Drug Stores, Online Pharmacies, Supermarkets/Hypermarkets |
| Regions Covered | North America; Latin America; Western Europe; Eastern Europe; South Asia and Pacific; East Asia; Middle East & Africa |
| Countries Covered | United States, Canada, Mexico, Brazil, Argentina, Germany, France, United Kingdom, Italy, Spain, Netherlands, China, India, Japan, South Korea, ANZ, GCC Countries, South Africa |
| Key Players influencing the Self-Testing Market | Johnson & Johnson, Procter & Gamble Co., Ascensia Diabetes Care Holdings AG, B. Braun Melsungen AG, Abbott Laboratories, Roche Holding AG, ACON Laboratories Inc., BTNX Inc, ARKRAY Inc., Assure Tech (Hangzhou) Co. Ltd., Becton, Dickinson & Company, Creative Diagnostics, Church & Dwight Co., Inc., Geratherm Medical AG, Bionime Corporation, Siemens AG, Quidel Corporation, True Diagnostics Inc., Bio-Rad Laboratories, bioMérieux SA, Thermo Fisher Scientific, Quest Diagnostics |
| Additional Attributes | Growth in at-home diagnostics and early screening, Regulatory evolution for OTC and digital diagnostics, Advances in smartphone-linked diagnostics and biosensor integration, Uptake in self-testing for chronic and infectious disease management, Expansion of retail access and digital health integration for remote monitoring |
| Customization and Pricing | Customization and Pricing Available on Request |
In terms of product type, the industry is divided into digital monitoring instruments, cassettes, midstreams, strips, cups, dip cards, test panels and others.
In terms of application, the industry is divided into blood glucose testing, pregnancy & fertility testing, cancer testing, STD/ STI testing, drug of abuse testing, cholesterol testing, HIV testing, thyroid testing, and others.
In terms of sample type, the industry is divided into urine, blood, saliva, stool, vaginal swab, semen
In terms of distribution channel, the industry is segregated into retail pharmacies, drug stores, online pharmacies and supermarket/hypermarket.
Key countries of North America, Latin America, East Asia, South Asia & Pacific, Western Europe, Eastern Europe, and Middle East and Africa (MEA) have been covered in the report.
The global self testing industry is projected to witness CAGR of 6.1% between 2025 and 2035.
The global self testing industry stood at USD 8.9 billion in 2024.
The global self testing industry is anticipated to reach USD 16 billion by 2035 end.
China is expected to show a CAGR of 13.1% in the assessment period.
The key players operating in the global self testing industry include Johnson & Johnson, Procter & Gamble Co., Ascensia Diabetes Care Holdings AG, B. Braun Melsungen AG, Abbott Laboratories, Roche Holding AG, ACON Laboratories Inc., BTNX Inc, ARKRAY Inc., Assure Tech (Hangzhou) Co. Ltd., Becton, Dickinson & Company, Creative Diagnostics, Church & Dwight Co., Inc., Geratherm Medical AG, Bionime Corporation, Siemens AG, Quidel Corporation, True Diagnostics Inc., Bio-Rad Laboratories, bioMérieux SA, Thermo Fisher Scientific, Hologic, Inc., Quest Diagnostics


Our Research Products

The "Full Research Suite" delivers actionable market intel, deep dives on markets or technologies, so clients act faster, cut risk, and unlock growth.

The Leaderboard benchmarks and ranks top vendors, classifying them as Established Leaders, Leading Challengers, or Disruptors & Challengers.

Locates where complements amplify value and substitutes erode it, forecasting net impact by horizon

We deliver granular, decision-grade intel: market sizing, 5-year forecasts, pricing, adoption, usage, revenue, and operational KPIs—plus competitor tracking, regulation, and value chains—across 60 countries broadly.

Spot the shifts before they hit your P&L. We track inflection points, adoption curves, pricing moves, and ecosystem plays to show where demand is heading, why it is changing, and what to do next across high-growth markets and disruptive tech

Real-time reads of user behavior. We track shifting priorities, perceptions of today’s and next-gen services, and provider experience, then pace how fast tech moves from trial to adoption, blending buyer, consumer, and channel inputs with social signals (#WhySwitch, #UX).

Partner with our analyst team to build a custom report designed around your business priorities. From analysing market trends to assessing competitors or crafting bespoke datasets, we tailor insights to your needs.
Supplier Intelligence
Discovery & Profiling
Capacity & Footprint
Performance & Risk
Compliance & Governance
Commercial Readiness
Who Supplies Whom
Scorecards & Shortlists
Playbooks & Docs
Category Intelligence
Definition & Scope
Demand & Use Cases
Cost Drivers
Market Structure
Supply Chain Map
Trade & Policy
Operating Norms
Deliverables
Buyer Intelligence
Account Basics
Spend & Scope
Procurement Model
Vendor Requirements
Terms & Policies
Entry Strategy
Pain Points & Triggers
Outputs
Pricing Analysis
Benchmarks
Trends
Should-Cost
Indexation
Landed Cost
Commercial Terms
Deliverables
Brand Analysis
Positioning & Value Prop
Share & Presence
Customer Evidence
Go-to-Market
Digital & Reputation
Compliance & Trust
KPIs & Gaps
Outputs
Full Research Suite comprises of:
Market outlook & trends analysis
Interviews & case studies
Strategic recommendations
Vendor profiles & capabilities analysis
5-year forecasts
8 regions and 60+ country-level data splits
Market segment data splits
12 months of continuous data updates
DELIVERED AS:
PDF EXCEL ONLINE
Examining Market Trends in the Self-Testing Industry Share
HIV Self-testing Market Size and Share Forecast Outlook 2025 to 2035
Self-urinary Infection Testing Market Size and Share Forecast Outlook 2025 to 2035
Self-Supporting Aerial Optical Cable Market Size and Share Forecast Outlook 2025 to 2035
Self-ligating Metal Brackets Market Size and Share Forecast Outlook 2025 to 2035
Self Propelled Transport Barge Market Size and Share Forecast Outlook 2025 to 2035
Self-ligating Ceramic Brackets Market Size and Share Forecast Outlook 2025 to 2035
Self-sealing Ziplock Bag Market Size and Share Forecast Outlook 2025 to 2035
Self-service Billiards System Market Size and Share Forecast Outlook 2025 to 2035
Self-propelled Orchard Top-cutting Machines Market Forecast and Outlook 2025 to 2035
Self-healing Network Market Size and Share Forecast Outlook 2025 to 2035
Self-administered Biologics Market Size and Share Forecast Outlook 2025 to 2035
Self-fusing Silicone Tape Market Size and Share Forecast Outlook 2025 to 2035
Self-administered Parenteral Market Size and Share Forecast Outlook 2025 to 2035
Self-Adhesive Dual-Cure Luting Cement Market Size and Share Forecast Outlook 2025 to 2035
Self Cooling Packaging Market Size and Share Forecast Outlook 2025 to 2035
Self-service Analytics Market Size and Share Forecast Outlook 2025 to 2035
Self-Compacting Concrete Market Size and Share Forecast Outlook 2025 to 2035
Self-adhesive Tear Tape Market Size and Share Forecast Outlook 2025 to 2035
Self-Adhesive Labels Market Size and Share Forecast Outlook 2025 to 2035

Thank you!
You will receive an email from our Business Development Manager. Please be sure to check your SPAM/JUNK folder too.
Chat With
MaRIA