Self-healing Materials Market
Self-healing Materials Market By Product, Technology, Application & Region - Forecast 2022-2032
Market Insights on Self-Healing Materials covering sales outlook, demand forecast and up-to-date key trends
Self-healing Materials Market Outlook (2022-2032)
[333 Pages Report] The self-healing materials market size estimated at USD 1.61 billion in 2022 is anticipated to grow at a CAGR of 25.5% from 2022 to 2032.
Global demand for self-healing materials is supported by the following factors:
- Public and private infrastructure are increasing their constructional activities in developing economies. For example, government initiatives in these countries enable easy access to raw materials, as well as support the domestic manufacturing processes.
- Untapped markets can be captured to increase the customer base through the implementation of sophisticated expertise that supports the expansion of the product portfolio, which is likely to expand the self-healing materials market size.
- Long-term financial benefits can be yielded by self-healing materials compared to traditional materials. Moreover, closer collaboration and knowledge transfer at an early stage of development is further expected to surge the global market growth.
- Polymer-based self-healing materials improve the functioning of various products while contributing to the extension of their life cycle. It mimics biological healing and repairs itself when it gets damaged without the need for any external form of intervention for repair or detection, which is evidently expected to drive the demand for self-healing materials.
The self-healing mechanism of these materials is limited by design, in spite of its high global demand. Moreover, the market potential and expansion are limited due to the transition from pilot-scale to industrial-scale production. These are major hindrances to the market share.
Attributes |
Details |
Self-healing Materials Market CAGR (2022-2032) |
25.5% |
Self-healing Materials Market Size (2022) |
USD 1.61 billion |
Self-healing Materials Market Size (2032) |
USD 15.57 billion |
Don't pay for what you don't need
Customize your report by selecting specific countries or regions and save 30%!
France & China dominate the Self-healing Materials Market: Regional Insights
Europe holds the largest share of the self-healing materials market, which is attributed to the rising consumer purchasing power with the high expansion of multinational companies, especially in France and Italy. Moreover, key market players are increasing their manufacturing capacities and shifting their production units to emerging economies of Southeast Asia to capture a large customer pool. New features are being added by medium-sized players to diversify their product lines as older ones become outmoded to increase sales and profits.
The Asia Pacific is a growing self-healing materials market owing to its rising consumption in countries like China and India. The demand for self-healing materials is rising due to their durability, efficiency, performance, increasing lifespan, and safety. Furthermore, the dense population, higher rates of industrialization and growing foreign direct investments in the electronic and automotive sectors are anticipated to support the robust regional market growth.
Opportunities found in the Automotive & Electronic Industries
Self-healing materials have high applications in the automotive and electronic industries since durability and reliability are essential to these sectors. The applications include anti-scratch polyurethane coatings based on self-healing elastomers for automobile bodies.
For the automotive industry, key manufacturers in the self-healing materials market are offering an advanced “self-seal technology,” which is optimized for objects such as the nails and screws of car wheels by sealing most punctures up to ¼” (6 mm). By utilizing a natural rubber sealant material that has no impact on rolling resistance and that maintains all other tire performances, it remains an environment-friendly option. The sealant can also be permanently installed inside the tire to surround the object and fill the hole, maintaining pressure and preventing air leakage, which ultimately surges the sales of self-healing materials.
Electronic components, on the other hand, can be protected with various coatings such as silicone gels, encapsulants and conformal coatings that can fend off moisture, dirt, shock, vibration and other harsh environmental factors. These gels combine the stress relief and self-healing qualities of a liquid with the dimensional stability of an elastomer.
The encapsulants cure with minimal shrinkage and involve no solvents or cure by-products, which aids in maximizing processing efficiency and minimizing costs. Manufacturers have also introduced soft-feel to self-healing wood coatings. For instance, the introduction of the new generation of purely waterborne OH-functional polyurethane dispersions (PUD) has further improved the performance of waterborne, environmentally 2k polyurethane coatings. These are a few of the many scopes of the self-healing materials market share.
The advantages of this material, such as its weightlessness, improved chemical and physical stability, and process ability, are what are driving the growth of the global self-healing material market. These advantages make this material highly sought-after in a variety of industries.
Due to the pandemic, nearly all of the nations in the world are currently on a state of emergency and all of these industries are shut down. As a result, there has been a decline in demand for self-healing materials and electronics goods.
Additionally, due to the COVID-19 pandemic, new construction projects have been halted as well as automotive production. In light of this, the adoption of self-healing materials has been significantly hindered and is predicted to take another year to recover in terms of losses incurred.
The ability of materials to repair damage brought on by mechanical friction and the rise in demand for self-healing materials i.e. polymers from a variety of end-use industries also contribute to the self-healing materials market growth as well as the self-healing materials market key trends and opportunities.
As a result, increased adoption of self-healing materials in the automotive, electronics & electrical, and building & construction industries supports the self-healing materials adoption trends globally.
Self-healing materials are now being used by the majority of semiconductor and electronics market participants in goods like laptops, smartphones, desktop computers, and high-end cameras. Self-healing materials are expected to be consumed at a higher rate as a result of the steady rise in the sales of smartphones and laptops and innovations in their design.
The primary factor preventing the self-healing materials market key trends and opportunities from growing is the high cost of products as self-healing materials are currently more expensive than conventional materials. If the cost factor is managed in the upcoming years, the factor is anticipated to challenge the future demand for self-healing materials and cater to the sales of self-healing materials along with the adoption of self-healing materials.
What is Propelling the Self-healing Materials Market?
A significant change in government policies is one of the main benefits that self-healing materials market participants is anticipated to experience during the forecasted period.
The focus of the current shift is on laws and regulations that mandate warranties and guarantees for longer periods of time, providing the self-healing materials market with significant self-healing materials market growth along with self-healing materials market opportunities for the current forecast period.
One of the biggest obstacles to the self-healing materials market growth during the forecast period is the intense pressure to maintain profitability and competitiveness among the major self-healing materials market players. Additionally, the self-healing materials market is seeing a transition from pilot scale to industrial scale production, which is limiting the self-healing materials market’s potential and preventing it from expanding during the forecast period.
What are the Trends in the Self-healing Materials Market?
Throughout the current forecast period, the government has increased its investment and support in the form of regulations, which may benefit the self-healing materials market. Additionally, this investment in research and development is being used to create and self-healing materials market products that fall into a lower and more reasonable price range.
Reliability and durability are two key components that have a large application base in the global self-healing materials market operations, which can satisfy the target self-healing materials market and support self-healing materials market growth.
Get the data you need at a Fraction of the cost
Personalize your report by choosing insights you need
and save 40%!
Comparative View of Adjacent Self-healing Materials Market
Self-Healing Materials Market:
Attributes |
Self-Healing Materials Market |
CAGR (2022-2032) |
25.5% |
Market Value (2027) |
USD 5 billion |
Growth Factor |
The focus of government policy is now on laws and regulations requiring longer service guarantees and warranties. |
Opportunity |
Self-healing materials provide long-term financial rewards contrasted with conventional materials. |
Key Trends |
Knowledge exchange and improved collaboration during the early stages of development. |
Self-Healing Grid Market:
Attributes |
Self-Healing Grid Market |
CAGR (2022-2032) |
9.07% |
Market Value (2027) |
USD 4.1 billion |
Growth Factor |
Legislative requirements and governmental directives for transmission and distribution utilities. |
Opportunity |
One of the key opportunities is the modernization of the out-dated grid infrastructure. |
Key Trends |
The market is primarily being driven by the complexity of distributed energy generation and the need to safeguard electric utilities from cyber-attacks. |
Smart Coatings Market:
Attributes |
Smart Coatings Market |
CAGR (2022-2032) |
23.8% |
Market Value (2027) |
USD 18.23 billion |
Growth Factor |
An increase in demand from end-use industries for smart coatings. |
Opportunity |
An increase in demand from automakers for anti-corrosion coatings |
Key Trends |
The market for smart coatings is likely to grow even more as a result of the coatings' attributes like corrosion resistance, self-cleaning, self-healing, and sensing capabilities. |
Which is the Leading Segment in the Self-healing Materials Market by Product?
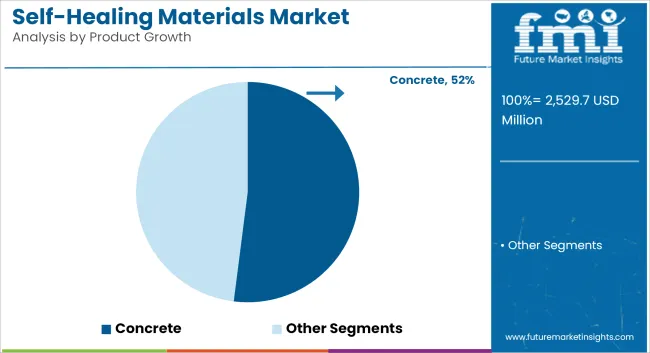
The self-healing material adoption trends are led by the concrete segment in 2022, which also had the largest revenue in the self-healing materials market share of about 27%. This is due to its many useful qualities, including high strength, little shrinkage and creep, durability, and cost-effectiveness.
The increased demand for self-healing materials in the industrial sector, including automotive and aerospace, is the main driver of the self-healing materials market growth. Several industries use these coatings.
Over the forecast period, the demand for self-healing materials particularly asphalt is anticipated to experience rapid self-healing materials market growth. The development of the special material engineered technology has enormous potential if self-healing technology is incorporated into the process of building and maintaining roads.
Such technology aids in reducing the amount of natural resources needed to maintain road networks as well as the inevitable premature ageing of asphalt pavements. Additionally, it promotes CO2 emissions reduction and improves traffic safety surging the self-healing materials market trends and forecasts.
Which is the Leading Segment in the Self-healing Materials Market by Technology?
Due to its implementation in various industries, particularly the medical sector, the reversible polymers segment led the self-healing materials market and accounted for 35.0% of revenue in 2022.
Furthermore, the growing geriatric population is expected to boost self-healing materials market growth. Stimulus-responsive microstructures are used in the production of sensors, microactuators, drug delivery systems, membranes, and other advanced microdevices.
Shape memory polymers are used in the creation of Shape-memory Assisted Self-healing (SMASH) coatings. These surfaces help to repair structurally damaged surfaces and restore corrosion resistance, therefore boosting the self-healing materials market future trends.
By its ability to repair polymeric composites that have been damaged by mechanical and chemical progressions, demand for self-healing materials majorly microencapsulation technology is expected to grow in the coming years.
Which is the Leading Segment in the Self-healing Materials Market by Application?
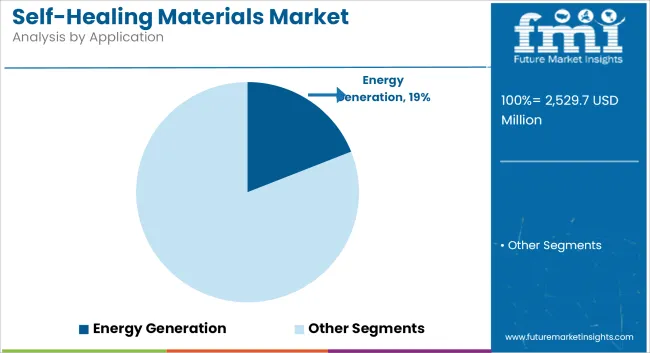
In 2022, the building and construction segment led the self-healing materials market, accounting for 34% of total revenue. Construction activities are increasing in the Asia Pacific region, particularly in China and India, and product demand for self-healing materials for construction applications is expected to grow significantly over the forecast period.
Rising socioeconomic necessity to build high-tech infrastructure and buildings in Asia Pacific and Latin America is expected to boost the development of the construction industry majorly self-healing materials adoption trends over the forecast period, positively influencing self-healing materials market growth along with self-healing materials market key trends and opportunities. Another industry that has seen an increase in demand for self-healing materials is automotive and transportation.
Automotive OEMs apply an exterior coating to vehicles that activates a curing mechanism when cut or scratched. This coating reduces regular maintenance by mechanically healing scratches and escalates the self-healing materials market opportunities. This is expected to create lucrative self-healing materials market opportunities in the coming years by increasing demand for self-healing materials and advanced products.
Which is the Leading Region in the Self-healing Materials Market?
Europe
Europe dominated the self-healing materials market, accounting for 28.4% of revenue in 2022. Rising consumer spending and purchasing power, combined with the rapid expansion of multinational corporations, particularly in France and Italy, are expected to drive self-healing materials market future trends.
Asia Pacific
Asia Pacific is expected to have the highest self-healing materials market revenues in the near future, with a 30.5% CAGR by the end of 2030. Higher rates of industrialization, a dense population, and rising foreign direct investments in the automotive and electronic sectors are the major driving forces behind the region's robust self-healing materials market growth as well as self-healing materials market future trends.
To capture a large customer pool, key self-healing materials market players from developed economies such as Europe and North America are increasing their manufacturing capacities and shifting production units to emerging economies such as Southeast Asia.
To increase sales of self-healing materials and profits, medium-sized players are diversifying their product lines by adding new features as older ones become obsolete. Favorable government trade policies, combined with higher GDP growth rates, are expected to support self-healing materials market growth and self-healing materials market opportunities along with self-healing materials adoption trends by 2030.
How Competition Influences the Self-healing Materials Market?
By implementing various competitive business strategies, major corporations are focusing on optimal production and sales of self-healing materials along with self-healing materials market growth and self-healing materials market future trends. Self-healing material manufacturers are using an intensification strategy to focus on their primary line of business in order to meet their self-healing materials market growth targets by expanding their operation sizes.
Recent Development:
Acquisition:
- In December 2016, BASF SE acquired Chemetall GmbH, a manufacturer of specialty chemicals and surface treatment products.
- Evonik Industries acquired Air Products' (U.S.) Specialty & Coating Additives business in May 2016, strengthening its dominant position in the high margin specialty & coating adhesives market.
Partnership:
- Acciona developed self-healing materials in April 2015 to increase the lifespan and usability of infrastructure. Acciona Infrastructures is a partner in the Shine and Healcon European projects to create self-repairing road surfaces and concrete.
Patent:
- BASF SE patented the process of self-healing cured coatings in June 2014.
How is the Start-up Ecosystem in the Coiled Tubing Self-healing Materials Market?
As manufacturers invest in research and development to create more advanced sodium nitrite solutions, many new self-healing materials market opportunities are emerging.
Autonomic Materials investigated self-healing materials with protective coating systems in January 2020. Trials demonstrated that the low VOC waterborne self-healing coating is extremely beneficial for corrosion resistance.
The self-healing materials market participants are focusing their efforts on R&D. Furthermore, in order to strengthen their self-healing materials market position and gain a large customer base, they pursue strategic self-healing materials market growth initiatives such as expansion, product launches, joint ventures, and partnerships.
Key Players
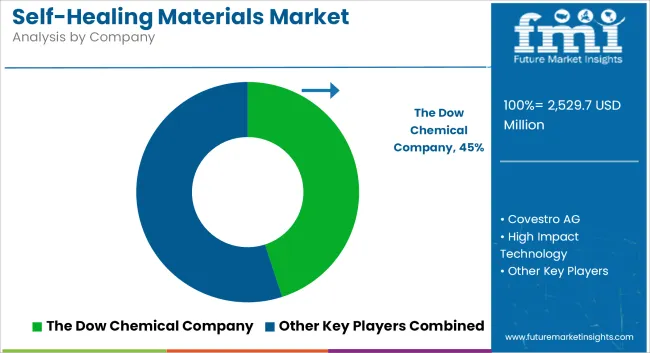
Among the leading companies in the self-healing materials markets are:
- The Dow Chemical Company
- Covestro AG
- High Impact Technology, LLC
- Huntsman International LLC
- Michelin Group
- MacDermid Autotype Ltd.
- Akzo Nobel N.V.
- Evonik Industries Corporation
- BASF SE
- NEI Corporation
Key Segments
By Product:
- Concrete
- Coatings
- Polymers
- Asphalt
- Fiber-reinforced Composites
- Ceramic
- Metals
By Technology:
- Reversible Polymers
- Microencapsulation
- Shape Memory Materials
- Biological Material Systems
- Others
By Application:
- Energy Generation
- Building & Construction
- Automotive & Transportation
- Electronics & Semiconductors
- Medical (Implants & devices)
- Others
By Region:
- North America
- U.S.
- Canada
- Mexico
- Europe
- Germany
- France
- U.K.
- Asia Pacific
- China
- India
- Japan
- Central & South America
- Brazil
- Middle East & Africa
Frequently Asked Questions
What is the Growth Outlook for Self-healing Materials Market?
The self-healing materials market is likely to secure a CAGR of 25.5% through 2032.
What is the Current Valuation of the Self-healing Materials Market?
The self-healing materials market is likely to record a value of USD 1.61 billion in 2022.
By 2032, how much can the Self-healing Materials Market Grow?
The self-healing materials market size is estimated to cross USD 15.57 billion by 2032.
Which Region is likely to Lead the Self-healing Materials Market?
Europe is likely to lead the self-healing materials market.
Table of Content
1. Executive Summary 1.1. Global Market Outlook 1.2. Demand-side Trends 1.3. Supply-side Trends 1.4. Technology Roadmap Analysis 1.5. Analysis and Recommendations 2. Market Overview 2.1. Market Coverage / Taxonomy 2.2. Market Definition / Scope / Limitations 3. Market Background 3.1. Market Dynamics 3.1.1. Drivers 3.1.2. Restraints 3.1.3. Opportunity 3.1.4. Trends 3.2. Scenario Forecast 3.2.1. Demand in Optimistic Scenario 3.2.2. Demand in Likely Scenario 3.2.3. Demand in Conservative Scenario 3.3. Opportunity Map Analysis 3.4. Investment Feasibility Matrix 3.5. PESTLE and Porter’s Analysis 3.6. Regulatory Landscape 3.6.1. By Key Regions 3.6.2. By Key Countries 3.7. Regional Parent Market Outlook 4. Global Market Analysis 2017-2021 and Forecast, 2022-2032 4.1. Historical Market Size Value (US$ Mn) Analysis, 2017-2021 4.2. Current and Future Market Size Value (US$ Mn) Projections, 2022-2032 4.2.1. Y-o-Y Growth Trend Analysis 4.2.2. Absolute $ Opportunity Analysis 5. Global Market Analysis 2017-2021 and Forecast 2022-2032, By Product 5.1. Introduction / Key Findings 5.2. Historical Market Size Value (US$ Mn) Analysis By Product, 2017-2021 5.3. Current and Future Market Size Value (US$ Mn) Analysis and Forecast By Product, 2022-2032 5.3.1. Concrete 5.3.2. Coatings 5.3.3. Polymers 5.3.4. Asphalt 5.3.5. Fiber-reinforced Composites 5.3.6. Ceramic 5.3.7. Metals 5.4. Y-o-Y Growth Trend Analysis By Product, 2017-2021 5.5. Absolute $ Opportunity Analysis By Product, 2022-2032 6. Global Market Analysis 2017-2021 and Forecast 2022-2032, By Technology 6.1. Introduction / Key Findings 6.2. Historical Market Size Value (US$ Mn) Analysis By Technology, 2017-2021 6.3. Current and Future Market Size Value (US$ Mn) Analysis and Forecast By Technology, 2022-2032 6.3.1. Reversible Polymers 6.3.2. Microencapsulation 6.3.3. Shape Memory Materials 6.3.4. Biological Material Systems 6.3.5. Others 6.4. Y-o-Y Growth Trend Analysis By Technology, 2017-2021 6.5. Absolute $ Opportunity Analysis By Technology, 2022-2032 7. Global Market Analysis 2017-2021 and Forecast 2022-2032, By Application 7.1. Introduction / Key Findings 7.2. Historical Market Size Value (US$ Mn) Analysis By Application, 2017-2021 7.3. Current and Future Market Size Value (US$ Mn) Analysis and Forecast By Application, 2022-2032 7.3.1. Energy Generation 7.3.2. Building & Construction 7.3.3. Automotive & Transportation 7.3.4. Electronics & Semiconductors 7.3.5. Medical 7.3.6. Others 7.4. Y-o-Y Growth Trend Analysis By Application, 2017-2021 7.5. Absolute $ Opportunity Analysis By Application, 2022-2032 8. Global Market Analysis 2017-2021 and Forecast 2022-2032, By Region 8.1. Introduction 8.2. Historical Market Size Value (US$ Mn) Analysis By Region, 2017-2021 8.3. Current Market Size Value (US$ Mn) Analysis and Forecast By Region, 2022-2032 8.3.1. North America 8.3.2. Latin America 8.3.3. Europe 8.3.4. Asia Pacific 8.3.5. MEA 8.4. Market Attractiveness Analysis By Region 9. North America Market Analysis 2017-2021 and Forecast 2022-2032, By Country 9.1. Historical Market Size Value (US$ Mn) Trend Analysis By Market Taxonomy, 2017-2021 9.2. Market Size Value (US$ Mn) Forecast By Market Taxonomy, 2022-2032 9.2.1. By Country 9.2.1.1. U.S. 9.2.1.2. Canada 9.2.2. By Product 9.2.3. By Technology 9.2.4. By Application 9.3. Market Attractiveness Analysis 9.3.1. By Country 9.3.2. By Product 9.3.3. By Technology 9.3.4. By Application 9.4. Key Takeaways 10. Latin America Market Analysis 2017-2021 and Forecast 2022-2032, By Country 10.1. Historical Market Size Value (US$ Mn) Trend Analysis By Market Taxonomy, 2017-2021 10.2. Market Size Value (US$ Mn) Forecast By Market Taxonomy, 2022-2032 10.2.1. By Country 10.2.1.1. Brazil 10.2.1.2. Mexico 10.2.1.3. Rest of Latin America 10.2.2. By Product 10.2.3. By Technology 10.2.4. By Application 10.3. Market Attractiveness Analysis 10.3.1. By Country 10.3.2. By Product 10.3.3. By Technology 10.3.4. By Application 10.4. Key Takeaways 11. Europe Market Analysis 2017-2021 and Forecast 2022-2032, By Country 11.1. Historical Market Size Value (US$ Mn) Trend Analysis By Market Taxonomy, 2017-2021 11.2. Market Size Value (US$ Mn) Forecast By Market Taxonomy, 2022-2032 11.2.1. By Country 11.2.1.1. Germany 11.2.1.2. U.K. 11.2.1.3. France 11.2.1.4. Spain 11.2.1.5. Italy 11.2.1.6. Rest of Europe 11.2.2. By Product 11.2.3. By Technology 11.2.4. By Application 11.3. Market Attractiveness Analysis 11.3.1. By Country 11.3.2. By Product 11.3.3. By Technology 11.3.4. By Application 11.4. Key Takeaways 12. Asia Pacific Market Analysis 2017-2021 and Forecast 2022-2032, By Country 12.1. Historical Market Size Value (US$ Mn) Trend Analysis By Market Taxonomy, 2017-2021 12.2. Market Size Value (US$ Mn) Forecast By Market Taxonomy, 2022-2032 12.2.1. By Country 12.2.1.1. China 12.2.1.2. Japan 12.2.1.3. South Korea 12.2.1.4. India 12.2.1.5. Malaysia 12.2.1.6. Singapore 12.2.1.7. Australia 12.2.1.8. New Zealand 12.2.1.9. Rest of APAC 12.2.2. By Product 12.2.3. By Technology 12.2.4. By Application 12.3. Market Attractiveness Analysis 12.3.1. By Country 12.3.2. By Product 12.3.3. By Technology 12.3.4. By Application 12.4. Key Takeaways 13. MEA Market Analysis 2017-2021 and Forecast 2022-2032, By Country 13.1. Historical Market Size Value (US$ Mn) Trend Analysis By Market Taxonomy, 2017-2021 13.2. Market Size Value (US$ Mn) Forecast By Market Taxonomy, 2022-2032 13.2.1. By Country 13.2.1.1. GCC Countries 13.2.1.2. South Africa 13.2.1.3. Israel 13.2.1.4. Rest of MEA 13.2.2. By Product 13.2.3. By Technology 13.2.4. By Application 13.3. Market Attractiveness Analysis 13.3.1. By Country 13.3.2. By Product 13.3.3. By Technology 13.3.4. By Application 13.4. Key Takeaways 14. Key Countries Market Analysis 14.1. U.S. 14.1.1. Pricing Analysis 14.1.2. Market Share Analysis, 2021 14.1.2.1. By Product 14.1.2.2. By Technology 14.1.2.3. By Application 14.2. Canada 14.2.1. Pricing Analysis 14.2.2. Market Share Analysis, 2021 14.2.2.1. By Product 14.2.2.2. By Technology 14.2.2.3. By Application 14.3. Brazil 14.3.1. Pricing Analysis 14.3.2. Market Share Analysis, 2021 14.3.2.1. By Product 14.3.2.2. By Technology 14.3.2.3. By Application 14.4. Mexico 14.4.1. Pricing Analysis 14.4.2. Market Share Analysis, 2021 14.4.2.1. By Product 14.4.2.2. By Technology 14.4.2.3. By Application 14.5. Germany 14.5.1. Pricing Analysis 14.5.2. Market Share Analysis, 2021 14.5.2.1. By Product 14.5.2.2. By Technology 14.5.2.3. By Application 14.6. U.K. 14.6.1. Pricing Analysis 14.6.2. Market Share Analysis, 2021 14.6.2.1. By Product 14.6.2.2. By Technology 14.6.2.3. By Application 14.7. France 14.7.1. Pricing Analysis 14.7.2. Market Share Analysis, 2021 14.7.2.1. By Product 14.7.2.2. By Technology 14.7.2.3. By Application 14.8. Spain 14.8.1. Pricing Analysis 14.8.2. Market Share Analysis, 2021 14.8.2.1. By Product 14.8.2.2. By Technology 14.8.2.3. By Application 14.9. Italy 14.9.1. Pricing Analysis 14.9.2. Market Share Analysis, 2021 14.9.2.1. By Product 14.9.2.2. By Technology 14.9.2.3. By Application 14.10. China 14.10.1. Pricing Analysis 14.10.2. Market Share Analysis, 2021 14.10.2.1. By Product 14.10.2.2. By Technology 14.10.2.3. By Application 14.11. Japan 14.11.1. Pricing Analysis 14.11.2. Market Share Analysis, 2021 14.11.2.1. By Product 14.11.2.2. By Technology 14.11.2.3. By Application 14.12. South Korea 14.12.1. Pricing Analysis 14.12.2. Market Share Analysis, 2021 14.12.2.1. By Product 14.12.2.2. By Technology 14.12.2.3. By Application 14.13. Malaysia 14.13.1. Pricing Analysis 14.13.2. Market Share Analysis, 2021 14.13.2.1. By Product 14.13.2.2. By Technology 14.13.2.3. By Application 14.14. Singapore 14.14.1. Pricing Analysis 14.14.2. Market Share Analysis, 2021 14.14.2.1. By Product 14.14.2.2. By Technology 14.14.2.3. By Application 14.15. Australia 14.15.1. Pricing Analysis 14.15.2. Market Share Analysis, 2021 14.15.2.1. By Product 14.15.2.2. By Technology 14.15.2.3. By Application 14.16. New Zealand 14.16.1. Pricing Analysis 14.16.2. Market Share Analysis, 2021 14.16.2.1. By Product 14.16.2.2. By Technology 14.16.2.3. By Application 14.17. GCC Countries 14.17.1. Pricing Analysis 14.17.2. Market Share Analysis, 2021 14.17.2.1. By Product 14.17.2.2. By Technology 14.17.2.3. By Application 14.18. South Africa 14.18.1. Pricing Analysis 14.18.2. Market Share Analysis, 2021 14.18.2.1. By Product 14.18.2.2. By Technology 14.18.2.3. By Application 14.19. Israel 14.19.1. Pricing Analysis 14.19.2. Market Share Analysis, 2021 14.19.2.1. By Product 14.19.2.2. By Technology 14.19.2.3. By Application 15. Market Structure Analysis 15.1. Competition Dashboard 15.2. Competition Benchmarking 15.3. Market Share Analysis of Top Players 15.3.1. By Regional 15.3.2. By Product 15.3.3. By Technology 15.3.4. By Application 16. Competition Analysis 16.1. Competition Deep Dive 16.1.1. The Dow Chemical Company 16.1.1.1. Overview 16.1.1.2. Product Portfolio 16.1.1.3. Profitability by Market Segments 16.1.1.4. Sales Footprint 16.1.1.5. Strategy Overview 16.1.1.5.1. Marketing Strategy 16.1.2. Covestro AG 16.1.2.1. Overview 16.1.2.2. Product Portfolio 16.1.2.3. Profitability by Market Segments 16.1.2.4. Sales Footprint 16.1.2.5. Strategy Overview 16.1.2.5.1. Marketing Strategy 16.1.3. High Impact Technology, LLC 16.1.3.1. Overview 16.1.3.2. Product Portfolio 16.1.3.3. Profitability by Market Segments 16.1.3.4. Sales Footprint 16.1.3.5. Strategy Overview 16.1.3.5.1. Marketing Strategy 16.1.4. Huntsman International LLC 16.1.4.1. Overview 16.1.4.2. Product Portfolio 16.1.4.3. Profitability by Market Segments 16.1.4.4. Sales Footprint 16.1.4.5. Strategy Overview 16.1.4.5.1. Marketing Strategy 16.1.5. Michelin Group 16.1.5.1. Overview 16.1.5.2. Product Portfolio 16.1.5.3. Profitability by Market Segments 16.1.5.4. Sales Footprint 16.1.5.5. Strategy Overview 16.1.5.5.1. Marketing Strategy 16.1.6. MacDermid Autotype Ltd. 16.1.6.1. Overview 16.1.6.2. Product Portfolio 16.1.6.3. Profitability by Market Segments 16.1.6.4. Sales Footprint 16.1.6.5. Strategy Overview 16.1.6.5.1. Marketing Strategy 16.1.7. Akzo Nobel N.V. 16.1.7.1. Overview 16.1.7.2. Product Portfolio 16.1.7.3. Profitability by Market Segments 16.1.7.4. Sales Footprint 16.1.7.5. Strategy Overview 16.1.7.5.1. Marketing Strategy 16.1.8. Evonik Industries Corporation 16.1.8.1. Overview 16.1.8.2. Product Portfolio 16.1.8.3. Profitability by Market Segments 16.1.8.4. Sales Footprint 16.1.8.5. Strategy Overview 16.1.8.5.1. Marketing Strategy 16.1.9. BASF SE 16.1.9.1. Overview 16.1.9.2. Product Portfolio 16.1.9.3. Profitability by Market Segments 16.1.9.4. Sales Footprint 16.1.9.5. Strategy Overview 16.1.9.5.1. Marketing Strategy 16.1.10. NEI Corporation 16.1.10.1. Overview 16.1.10.2. Product Portfolio 16.1.10.3. Profitability by Market Segments 16.1.10.4. Sales Footprint 16.1.10.5. Strategy Overview 16.1.10.5.1. Marketing Strategy 17. Assumptions & Acronyms Used 18. Research Methodology
Don't pay for what you don't need
Customize your report by selecting specific countries or regions and save 30%!
List of Tables
Table 1: Global Market Value (US$ Mn) Forecast by Region, 2017-2032 Table 2: Global Market Value (US$ Mn) Forecast by Product, 2017-2032 Table 3: Global Market Value (US$ Mn) Forecast by Technology, 2017-2032 Table 4: Global Market Value (US$ Mn) Forecast by Application, 2017-2032 Table 5: North America Market Value (US$ Mn) Forecast by Country, 2017-2032 Table 6: North America Market Value (US$ Mn) Forecast by Product, 2017-2032 Table 7: North America Market Value (US$ Mn) Forecast by Technology, 2017-2032 Table 8: North America Market Value (US$ Mn) Forecast by Application, 2017-2032 Table 9: Latin America Market Value (US$ Mn) Forecast by Country, 2017-2032 Table 10: Latin America Market Value (US$ Mn) Forecast by Product, 2017-2032 Table 11: Latin America Market Value (US$ Mn) Forecast by Technology, 2017-2032 Table 12: Latin America Market Value (US$ Mn) Forecast by Application, 2017-2032 Table 13: Europe Market Value (US$ Mn) Forecast by Country, 2017-2032 Table 14: Europe Market Value (US$ Mn) Forecast by Product, 2017-2032 Table 15: Europe Market Value (US$ Mn) Forecast by Technology, 2017-2032 Table 16: Europe Market Value (US$ Mn) Forecast by Application, 2017-2032 Table 17: Asia Pacific Market Value (US$ Mn) Forecast by Country, 2017-2032 Table 18: Asia Pacific Market Value (US$ Mn) Forecast by Product, 2017-2032 Table 19: Asia Pacific Market Value (US$ Mn) Forecast by Technology, 2017-2032 Table 20: Asia Pacific Market Value (US$ Mn) Forecast by Application, 2017-2032 Table 21: MEA Market Value (US$ Mn) Forecast by Country, 2017-2032 Table 22: MEA Market Value (US$ Mn) Forecast by Product, 2017-2032 Table 23: MEA Market Value (US$ Mn) Forecast by Technology, 2017-2032 Table 24: MEA Market Value (US$ Mn) Forecast by Application, 2017-2032
List of Charts
Figure 1: Global Market Value (US$ Mn) by Product, 2022-2032 Figure 2: Global Market Value (US$ Mn) by Technology, 2022-2032 Figure 3: Global Market Value (US$ Mn) by Application, 2022-2032 Figure 4: Global Market Value (US$ Mn) by Region, 2022-2032 Figure 5: Global Market Value (US$ Mn) Analysis by Region, 2017-2032 Figure 6: Global Market Value Share (%) and BPS Analysis by Region, 2022-2032 Figure 7: Global Market Y-o-Y Growth (%) Projections by Region, 2022-2032 Figure 8: Global Market Value (US$ Mn) Analysis by Product, 2017-2032 Figure 9: Global Market Value Share (%) and BPS Analysis by Product, 2022-2032 Figure 10: Global Market Y-o-Y Growth (%) Projections by Product, 2022-2032 Figure 11: Global Market Value (US$ Mn) Analysis by Technology, 2017-2032 Figure 12: Global Market Value Share (%) and BPS Analysis by Technology, 2022-2032 Figure 13: Global Market Y-o-Y Growth (%) Projections by Technology, 2022-2032 Figure 14: Global Market Value (US$ Mn) Analysis by Application, 2017-2032 Figure 15: Global Market Value Share (%) and BPS Analysis by Application, 2022-2032 Figure 16: Global Market Y-o-Y Growth (%) Projections by Application, 2022-2032 Figure 17: Global Market Attractiveness by Product, 2022-2032 Figure 18: Global Market Attractiveness by Technology, 2022-2032 Figure 19: Global Market Attractiveness by Application, 2022-2032 Figure 20: Global Market Attractiveness by Region, 2022-2032 Figure 21: North America Market Value (US$ Mn) by Product, 2022-2032 Figure 22: North America Market Value (US$ Mn) by Technology, 2022-2032 Figure 23: North America Market Value (US$ Mn) by Application, 2022-2032 Figure 24: North America Market Value (US$ Mn) by Country, 2022-2032 Figure 25: North America Market Value (US$ Mn) Analysis by Country, 2017-2032 Figure 26: North America Market Value Share (%) and BPS Analysis by Country, 2022-2032 Figure 27: North America Market Y-o-Y Growth (%) Projections by Country, 2022-2032 Figure 28: North America Market Value (US$ Mn) Analysis by Product, 2017-2032 Figure 29: North America Market Value Share (%) and BPS Analysis by Product, 2022-2032 Figure 30: North America Market Y-o-Y Growth (%) Projections by Product, 2022-2032 Figure 31: North America Market Value (US$ Mn) Analysis by Technology, 2017-2032 Figure 32: North America Market Value Share (%) and BPS Analysis by Technology, 2022-2032 Figure 33: North America Market Y-o-Y Growth (%) Projections by Technology, 2022-2032 Figure 34: North America Market Value (US$ Mn) Analysis by Application, 2017-2032 Figure 35: North America Market Value Share (%) and BPS Analysis by Application, 2022-2032 Figure 36: North America Market Y-o-Y Growth (%) Projections by Application, 2022-2032 Figure 37: North America Market Attractiveness by Product, 2022-2032 Figure 38: North America Market Attractiveness by Technology, 2022-2032 Figure 39: North America Market Attractiveness by Application, 2022-2032 Figure 40: North America Market Attractiveness by Country, 2022-2032 Figure 41: Latin America Market Value (US$ Mn) by Product, 2022-2032 Figure 42: Latin America Market Value (US$ Mn) by Technology, 2022-2032 Figure 43: Latin America Market Value (US$ Mn) by Application, 2022-2032 Figure 44: Latin America Market Value (US$ Mn) by Country, 2022-2032 Figure 45: Latin America Market Value (US$ Mn) Analysis by Country, 2017-2032 Figure 46: Latin America Market Value Share (%) and BPS Analysis by Country, 2022-2032 Figure 47: Latin America Market Y-o-Y Growth (%) Projections by Country, 2022-2032 Figure 48: Latin America Market Value (US$ Mn) Analysis by Product, 2017-2032 Figure 49: Latin America Market Value Share (%) and BPS Analysis by Product, 2022-2032 Figure 50: Latin America Market Y-o-Y Growth (%) Projections by Product, 2022-2032 Figure 51: Latin America Market Value (US$ Mn) Analysis by Technology, 2017-2032 Figure 52: Latin America Market Value Share (%) and BPS Analysis by Technology, 2022-2032 Figure 53: Latin America Market Y-o-Y Growth (%) Projections by Technology, 2022-2032 Figure 54: Latin America Market Value (US$ Mn) Analysis by Application, 2017-2032 Figure 55: Latin America Market Value Share (%) and BPS Analysis by Application, 2022-2032 Figure 56: Latin America Market Y-o-Y Growth (%) Projections by Application, 2022-2032 Figure 57: Latin America Market Attractiveness by Product, 2022-2032 Figure 58: Latin America Market Attractiveness by Technology, 2022-2032 Figure 59: Latin America Market Attractiveness by Application, 2022-2032 Figure 60: Latin America Market Attractiveness by Country, 2022-2032 Figure 61: Europe Market Value (US$ Mn) by Product, 2022-2032 Figure 62: Europe Market Value (US$ Mn) by Technology, 2022-2032 Figure 63: Europe Market Value (US$ Mn) by Application, 2022-2032 Figure 64: Europe Market Value (US$ Mn) by Country, 2022-2032 Figure 65: Europe Market Value (US$ Mn) Analysis by Country, 2017-2032 Figure 66: Europe Market Value Share (%) and BPS Analysis by Country, 2022-2032 Figure 67: Europe Market Y-o-Y Growth (%) Projections by Country, 2022-2032 Figure 68: Europe Market Value (US$ Mn) Analysis by Product, 2017-2032 Figure 69: Europe Market Value Share (%) and BPS Analysis by Product, 2022-2032 Figure 70: Europe Market Y-o-Y Growth (%) Projections by Product, 2022-2032 Figure 71: Europe Market Value (US$ Mn) Analysis by Technology, 2017-2032 Figure 72: Europe Market Value Share (%) and BPS Analysis by Technology, 2022-2032 Figure 73: Europe Market Y-o-Y Growth (%) Projections by Technology, 2022-2032 Figure 74: Europe Market Value (US$ Mn) Analysis by Application, 2017-2032 Figure 75: Europe Market Value Share (%) and BPS Analysis by Application, 2022-2032 Figure 76: Europe Market Y-o-Y Growth (%) Projections by Application, 2022-2032 Figure 77: Europe Market Attractiveness by Product, 2022-2032 Figure 78: Europe Market Attractiveness by Technology, 2022-2032 Figure 79: Europe Market Attractiveness by Application, 2022-2032 Figure 80: Europe Market Attractiveness by Country, 2022-2032 Figure 81: Asia Pacific Market Value (US$ Mn) by Product, 2022-2032 Figure 82: Asia Pacific Market Value (US$ Mn) by Technology, 2022-2032 Figure 83: Asia Pacific Market Value (US$ Mn) by Application, 2022-2032 Figure 84: Asia Pacific Market Value (US$ Mn) by Country, 2022-2032 Figure 85: Asia Pacific Market Value (US$ Mn) Analysis by Country, 2017-2032 Figure 86: Asia Pacific Market Value Share (%) and BPS Analysis by Country, 2022-2032 Figure 87: Asia Pacific Market Y-o-Y Growth (%) Projections by Country, 2022-2032 Figure 88: Asia Pacific Market Value (US$ Mn) Analysis by Product, 2017-2032 Figure 89: Asia Pacific Market Value Share (%) and BPS Analysis by Product, 2022-2032 Figure 90: Asia Pacific Market Y-o-Y Growth (%) Projections by Product, 2022-2032 Figure 91: Asia Pacific Market Value (US$ Mn) Analysis by Technology, 2017-2032 Figure 92: Asia Pacific Market Value Share (%) and BPS Analysis by Technology, 2022-2032 Figure 93: Asia Pacific Market Y-o-Y Growth (%) Projections by Technology, 2022-2032 Figure 94: Asia Pacific Market Value (US$ Mn) Analysis by Application, 2017-2032 Figure 95: Asia Pacific Market Value Share (%) and BPS Analysis by Application, 2022-2032 Figure 96: Asia Pacific Market Y-o-Y Growth (%) Projections by Application, 2022-2032 Figure 97: Asia Pacific Market Attractiveness by Product, 2022-2032 Figure 98: Asia Pacific Market Attractiveness by Technology, 2022-2032 Figure 99: Asia Pacific Market Attractiveness by Application, 2022-2032 Figure 100: Asia Pacific Market Attractiveness by Country, 2022-2032 Figure 101: MEA Market Value (US$ Mn) by Product, 2022-2032 Figure 102: MEA Market Value (US$ Mn) by Technology, 2022-2032 Figure 103: MEA Market Value (US$ Mn) by Application, 2022-2032 Figure 104: MEA Market Value (US$ Mn) by Country, 2022-2032 Figure 105: MEA Market Value (US$ Mn) Analysis by Country, 2017-2032 Figure 106: MEA Market Value Share (%) and BPS Analysis by Country, 2022-2032 Figure 107: MEA Market Y-o-Y Growth (%) Projections by Country, 2022-2032 Figure 108: MEA Market Value (US$ Mn) Analysis by Product, 2017-2032 Figure 109: MEA Market Value Share (%) and BPS Analysis by Product, 2022-2032 Figure 110: MEA Market Y-o-Y Growth (%) Projections by Product, 2022-2032 Figure 111: MEA Market Value (US$ Mn) Analysis by Technology, 2017-2032 Figure 112: MEA Market Value Share (%) and BPS Analysis by Technology, 2022-2032 Figure 113: MEA Market Y-o-Y Growth (%) Projections by Technology, 2022-2032 Figure 114: MEA Market Value (US$ Mn) Analysis by Application, 2017-2032 Figure 115: MEA Market Value Share (%) and BPS Analysis by Application, 2022-2032 Figure 116: MEA Market Y-o-Y Growth (%) Projections by Application, 2022-2032 Figure 117: MEA Market Attractiveness by Product, 2022-2032 Figure 118: MEA Market Attractiveness by Technology, 2022-2032 Figure 119: MEA Market Attractiveness by Application, 2022-2032 Figure 120: MEA Market Attractiveness by Country, 2022-2032
Recommendations
Explore Chemicals & Materials Insights
View Reports