Green Building Materials Market Forecast and Outlook from 2025 to 2035

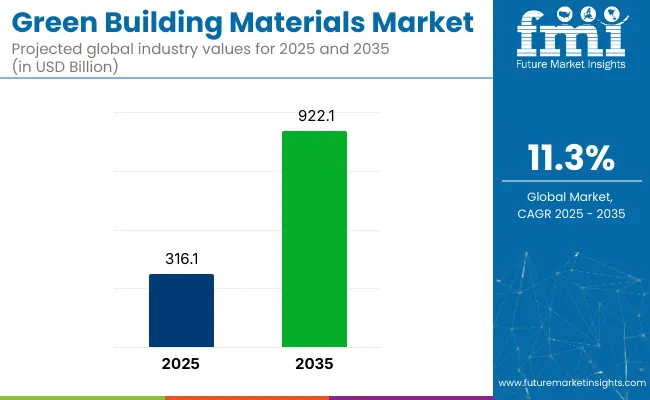
The green building materials market is projected to grow from USD 316.1 billion in 2025 to USD 922.1 billion by 2035, reflecting a compound annual growth rate (CAGR) of 11.3%. Growth is being supported by regulatory actions across the USA and Europe, in conjunction with increasing demand for sustainable construction materials, bio-based polymers, and energy-efficient components across industries.

In the United States, legislative support has intensified following the introduction of bipartisan initiatives aimed at improving green building standards. According to a 2024 report by Canary Media, new legislation has mandated the use of low-carbon construction materials in federally funded building projects.

This regulatory framework has boosted demand for verified green products in public infrastructure development. Additionally, the USA Environmental Protection Agency (EPA) continues to promote sustainable construction practices through programs such as ENERGY STAR and Smart Growth initiatives, which encourage the use of environmentally preferable building materials.

In Europe, regulatory changes have further advanced the market. A new EU regulation, adopted in January 2025, has introduced harmonized rules for the safety and sustainability of construction products across member states. The European Commission has emphasized that these measures aim to enhance product transparency and lifecycle efficiency while preserving industry competitiveness. These frameworks require manufacturers to disclose environmental performance metrics, thereby strengthening the adoption of certified green materials.
Green Building Materials Market

Metrics Values
Industry Size (2025E) USD 316.1 billion
Industry Size (2035F) USD 922.1 billion
CAGR 11.3%

Certifications and third-party environmental assessments are also supporting growth. Organizations such as Tunley Environmental have reported an uptick in demand for Life Cycle Assessments (LCAs), Environmental Product Declarations (EPDs), and carbon accounting services to support green material claims. Projects that comply with LEED, BREEAM, or WELL building certifications are increasingly mandating these third-party verifications for qualifying materials used in construction and retrofit projects.

Product innovations have included expanded use of recycled concrete aggregates, cross-laminated timber (CLT), cellulose insulation, and biodegradable polymers. Corporate initiatives have accelerated in alignment with decarbonization goals. Key materials suppliers have increased investment in recycled feedstocks, carbon capture-integrated cement, and plant-based construction polymers.

In the future, procurement frameworks are expected to favor regional and circular supply chains. With regulatory compliance and environmental impact disclosures becoming mainstream, the green materials market is positioned to witness sustained demand growth through 2035. Strategic emphasis will likely remain on low-embodied carbon materials, digital traceability platforms, and harmonized international sustainability standards.

Analyzing Green Building Materials Market by Top Investment Segments

Structural materials are projected to dominate product demand with increasing preference for low-carbon concrete, recycled steel, and engineered wood.

Structural materials are estimated to account for approximately 39% of the global green building materials market share in 2025 and are projected to grow at a CAGR of 11.5% through 2035. Demand is driven by their fundamental role in framing, foundation, and load-bearing applications across residential and commercial construction.

Builders and developers are increasingly adopting fly ash-based cement, cross-laminated timber (CLT), and high-recycled-content steel to reduce embodied carbon and improve lifecycle energy efficiency. Innovations in geopolymer concrete, carbon-negative aggregates, and sustainable prefabricated components are gaining momentum in both developed and emerging markets.

Governments and green certification programs such as LEED, BREEAM, and IGBC continue to incentivize the use of structural materials that align with circular economy goals and net-zero emissions targets.

Commercial buildings are expected to lead the adoption of end-use, with a strong focus on regulatory and investment in sustainable construction practices.

Commercial buildings are projected to account for nearly 34% of the global green building materials market share in 2025 and are expected to grow at a CAGR of 11.6% through 2035. This segment benefits from large-scale urbanization, ESG-led investment strategies, and rising demand for energy-efficient office spaces, hotels, and retail complexes.

In Europe and North America, green building codes and tax incentives are driving the adoption of thermally efficient insulation, low-emission interior products, and smart facade systems. Real estate developers and facility owners prioritize materials that support indoor air quality, moisture control, and reduced HVAC load, thereby boosting demand across both new construction and retrofit projects.

As commercial tenants seek wellness-certified and environmentally compliant spaces, green building materials form a core component of value-added construction across global commercial portfolios.

Green Building Materials Industry Overview and Future Opportunities

The industry for green building products is poised for robust growth, driven by more stringent environmental laws, increased demand for energy-efficient buildings, and innovations in environmentally friendly construction techniques.

Businesses manufacturing green insulation, cross-laminated wood, and reused products will reap the benefits. However, conventional material suppliers will lose if they do not diversify.

The change will be supported by governments, green builders, and ecologically aware buyers, who will drive demand for green materials to industry standards from current exceptions.

Top 3 Strategic Imperatives for Stakeholders

Invest in Sustainable Innovation

Prioritize R&D in eco-friendly materials, such as bio-based composites, recycled content, and carbon-neutral concrete, to stay competitive. Partner with research institutions and startups to accelerate breakthroughs and differentiate product offerings.

Align with Regulatory and Market Trends

Adapt to evolving sustainability mandates by ensuring compliance with green building certifications (LEED, BREEAM) and government incentives. Develop products that align with net-zero carbon goals to capitalize on the growing demand from developers and corporate ESG initiatives.

Expand Strategic Partnerships and Supply Chain Resilience

Strengthen collaborations with sustainable construction firms, architects, and policymakers to drive industry adoption. Invest in localized production and raw material sourcing to mitigate supply chain disruptions and reduce carbon footprints.

Top 3 Risks Stakeholders Should Monitor

Risk Probability & Impact
Regulatory Uncertainty: Shifting government policies or inconsistent green building standards may create compliance challenges. Medium Probability, High Impact
High Material Costs: The price volatility of sustainable raw materials could limit affordability and adoption. High Probability, Medium Impact
Slow Market Adoption: Resistance from traditional builders and developers may delay widespread implementation. Medium Probability, High Impact

1-Year Executive Watchlist

Priority Immediate Action
Sustainable Material Sourcing: Ensure a stable supply of eco-friendly raw materials. Run a feasibility study on regional sourcing for recycled and bio-based materials.
Regulatory Compliance & Certifications: Stay ahead of evolving green building mandates. Initiate legal and market review to align with upcoming LEED and BREEAM updates.
Market Adoption Acceleration: Drive demand for green materials among developers. Launch a targeted incentive program for builders adopting sustainable products.

For the Boardroom

To maintain competitiveness, companies must step up their investment in green innovation, enhance regulatory harmonization, and deepen strategic alliances. As green building regulations become stricter and there is a growing demand for environmentally friendly products, the time to scale carbon-neutral and recycled material R&D and secure low-cost supply chains is now. Prioritizing adaptation to changing LEED and BREEAM standards will open new revenue streams, and a push into incentives for builders and developers can accelerate industry take-up.

Future Market Insights Survey with Green Building Materials Market Stakeholders

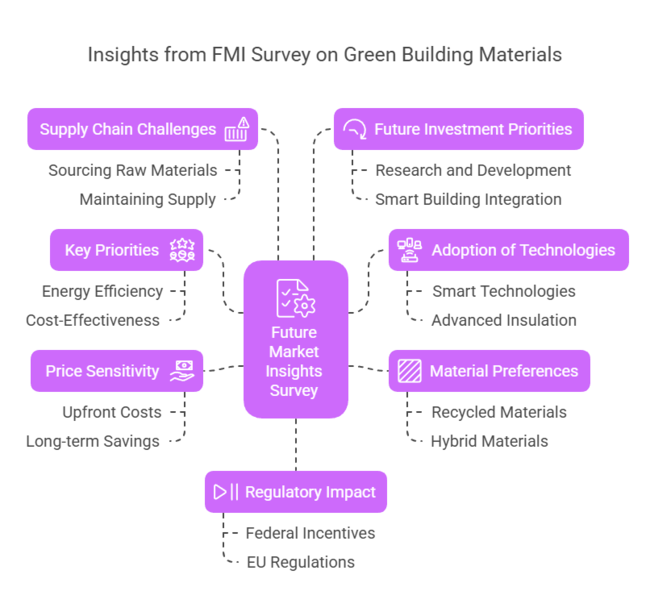
In Q4 2024, Future Market Insights (FMI) conducted a comprehensive survey involving 450 stakeholders from the green building materials sector, including manufacturers, distributors, architects, and developers across the United States, Western Europe, Japan, and South Korea. The survey revealed the following key insights: ​

Key Priorities of Stakeholders

  • Energy Efficiency and Sustainability: A significant 85% of stakeholders globally identified enhancing energy efficiency and sustainability as critical priorities. ​
  • Cost-Effectiveness: Approximately 78% emphasized the importance of balancing sustainability with cost-effectiveness to ensure broader industry adoption. ​

Regional Variations

  • United States: 70% of participants highlighted the need for materials that comply with LEED certification standards. ​
  • Western Europe: 82% prioritized materials with low carbon footprints, aligning with stringent EU environmental regulations. ​
  • Japan and South Korea: 65% focused on the durability and longevity of materials due to limited resources and high maintenance costs. ​

Adoption of Advanced Technologies

  • United States: 60% of stakeholders reported integrating smart technologies, such as IoT-enabled energy management systems, into green building designs. ​
  • Western Europe: 55% indicated the use of advanced insulation materials, like aerogels, to enhance building performance. ​
  • Japan: 40% adopted modular construction techniques to reduce waste and improve efficiency. ​
  • South Korea: 45% of the population explored the use of photovoltaic-integrated building materials to harness solar energy. ​

Material Preferences

Recycled and Renewable Materials: Globally, 68% of stakeholders preferred materials made from recycled or rapidly renewable resources. ​

Regional Variations

  • Western Europe: 75% showed a preference for cross-laminated timber due to its sustainability and structural benefits. ​
  • United States: 65% favored recycled steel and concrete for their strength and recyclability. ​
  • Japan and South Korea: 60% leaned towards hybrid materials that combine traditional and green components to balance performance and sustainability. ​

Price Sensitivity

Global Challenge: 80% of respondents cited the higher upfront costs of green building materials as a significant barrier to the adoption of green building practices. ​

Regional Insights

  • In the United States and Western Europe, 60% expressed willingness to invest in premium-priced materials if long-term savings and environmental benefits were evident.​
  • Japan and South Korea: 70% preferred cost-effective solutions, indicating a need for financial incentives or subsidies to promote green material adoption.​

Supply Chain and Logistical Challenges

  • Manufacturers: 50% reported difficulties in sourcing raw materials sustainably without inflating costs.​
  • Distributors: 45% highlighted challenges in maintaining a consistent supply due to fluctuating demand and transportation issues.​
  • End-users (Architects/Developers): 55% faced obstacles in sourcing certified green materials within project timelines, which affected construction schedules.​

Future Investment Priorities

  • Research and Development: 70% of global manufacturers plan to invest in R&D to innovate and improve the performance and affordability of green building materials.​

Regional Focus

  • United States: 65% aim to develop materials that integrate with smart building technologies.​
  • Western Europe: 60% are focusing on creating materials with enhanced recyclability and lower embodied carbon.​
  • Japan and South Korea: 55% intend to invest in materials suitable for high-density urban environments, emphasizing space efficiency and multifunctionality.​

Regulatory Impact

  • United States: 66% of stakeholders reported that federal and state-level incentives have a significant influence on material selection and project planning.​
  • Western Europe: 80% reported that stringent EU regulations drive the adoption of green building materials, making compliance a top priority.​
  • Japan and South Korea: 45% noted that while regulations exist, enforcement is less stringent, resulting in varied adoption rates.​

Insights From FMI Survey on Green Building Materials

Government Regulations

Countries Policies and Regulations
United States
  • Energy Policy Act (EPAct): Establishes energy management objectives, including energy efficiency requirements for commercial and federal buildings.- Energy Independence and Security Act (EISA): Established energy savings in federal buildings and encourages high-performance green buildings.
  • Mandatory Certification: Although not mandated by the federal government, several states and cities mandate compliance with the Leadership in Energy and Environmental Design (LEED) certification for public facilities. LEED measures buildings against standards such as energy efficiency, water use, and material selection.
United Kingdom
  • UK Net Zero Carbon Buildings Standard: Offers guidance on the design of buildings that meet net-zero carbon emissions, both operational and embodied emissions and construction.- Building Research Establishment Environmental Assessment Method (BREEAM): BREEAM, established in 1990, assesses the environmental performance of buildings, focusing on sustainability across various categories.
  • Mandatory Certification: Public sector projects are often required to meet BREEAM standards and are frequently used in the private sector to demonstrate environmental commitment.
India
  • National Building Code (NBC): Establishes building design and construction standards, including energy efficiency, water conservation, and the use of sustainable materials.
  • Energy Conservation Building Code (ECBC): Formulated by the Bureau of Energy Efficiency (BEE), ECBC encourages energy-efficient building construction and is used in large residential and commercial buildings.
  • Mandatory Certification: Adherence to NBC and ECBC requirements is compulsory for new building projects obtaining clearance from local authorities.
Japan
  • Comprehensive Assessment System for Built Environment Efficiency (CASBEE): Evaluates buildings based on environmental quality and performance, including energy efficiency and resource conservation.
  • Zero Energy Building (ZEB) Initiative: Aims to achieve net-zero energy consumption in buildings through energy conservation and generation strategies.
  • Mandatory Certification: While CASBEE certification is not mandatory, it is widely adopted, and government incentives promote the construction of ZEBs.
Singapore
  • Building and Construction Authority (BCA) Green Mark Scheme: Encourages environmental consciousness in the real estate and construction industries by grading buildings based on energy efficiency, water efficiency, environmental protection, indoor environmental quality, and other green attributes.
  • Mandatory Certification: New developments and major refurbishments of government buildings are required to achieve Green Mark Platinum levels, with a focus on sustainability in public sector development.
Malaysia
  • Green Building Index (GBI): Developed by the Malaysian Institute of Architects and industry stakeholders, the GBI assesses buildings based on energy efficiency, indoor environmental quality, sustainable site planning, materials and resources, water efficiency, and innovation.
  • Mandatory Certification: Although not compulsory, GBI certification is promoted through incentives, and adherence to its standards is becoming a standard for sustainable building in Malaysia.
Qatar
  • Qatar Sustainability Assessment System (QSAS): Established to design a sustainable built environment with reduced ecological footprints and an ability to tackle local needs.
  • Mandatory Certification: QSAS certification is compulsory for all new government buildings to ensure compliance with sustainability requirements on government projects.

Country-wise Analysis

Green Building Materials Market Country Wise Analysis

United States

The American green building materials industry is driven by strict environmental policies, growing consumer awareness, and a high-performing building industry.

The American industry is expected to hold a major share in the global industry. The Leadership in Energy and Environmental Design (LEED) certification continues to support green construction practices, further fuelling industry growth.

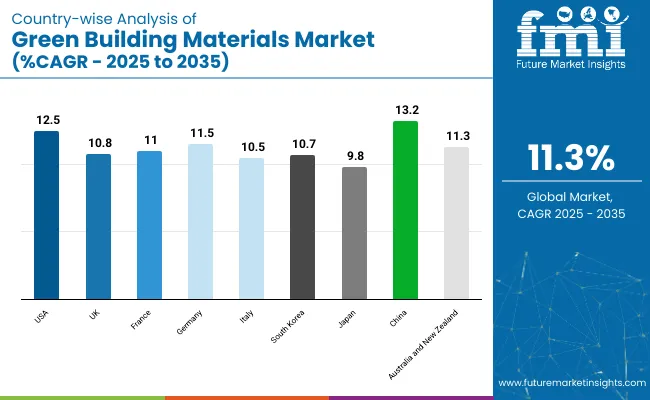
FMI opines that the United States' green building materials sales will grow at a nearly 12.5% CAGR through 2035.

United Kingdom

The market for green building materials in the UK is forecasted to increase at a CAGR of about 10.8% from 2025 to 2035.

The industry growth in the UK is an indication of the country's interest in sustainable development. The Building Research Establishment Environmental Assessment Method (BREEAM) certification has played a crucial role in promoting the use of environmentally friendly materials.

FMI opines that the United Kingdom's green building materials sales will grow at nearly 10.8% CAGR through 2025 to 2035.

France

France's green building materials industry is expected to expand rapidly from 2025 to 2035. The French government's focus on minimizing carbon emissions and sustainable urban growth propels the industry.

Policies like the HQE (Haute Qualité Environnementale) certification support the utilization of eco-friendly materials in buildings.

FMI opines that the French green building materials market sales will grow at nearly 11.0% CAGR through 2025 to 2035.

Germany

Germany is expected to experience significant growth in the green building materials industry over the projection period.

The engineering prowess of the country and policy push towards the Energiewende program to move towards a sustainable energy system support the sales of green building materials.

The DGNB (Deutsche Gesellschaft für Nachhaltiges Bauen) certification also encourages sustainable building activities.

FMI opines that Germany's green building materials sales will grow at nearly 11.5% CAGR through 2025 to 2035.

Italy

Italy's industry for green building materials will increase at a CAGR of approximately 10.5% between 2025 and 2035. The country's high level of architectural heritage, along with its growing emphasis on sustainable tourism and resulting efforts to renovate ancient structures using environmentally friendly products, enhances the industry.

Embracing procedures such as ITACA promotes the integration of sustainability in the building sector.

FMI opines that Italy's sales of green building materials will grow at a nearly 10.5% CAGR from 2025 to 2035.

South Korea

South Korea is estimated to witness a CAGR of about 10.7% from 2025 to 2035 in its green building materials industry. The industry is driven by government policies that favor energy-efficient buildings and smart city initiatives.

The G-SEED (Green Standard for Energy and Environmental Design) certification encourages the adoption of sustainable materials throughout the construction industry.

FMI opines that South Korea's green building materials sales will grow at nearly 10.7% CAGR through 2025 to 2035.

Japan

The industry size for green building materials in Japan is expected to expand rapidly from 2025 to 2035. The industry is driven by the implementation of green building materials to reduce natural disaster risks and enhance public health.

The Comprehensive Assessment System for Built Environment Efficiency (CASBEE) certification encourages the incorporation of environmentally friendly building materials into construction activities.

FMI opines that Japan's green building materials sales will grow at nearly a 9.8% CAGR through 2025 to 2035.

China

China is anticipated to register a strong growth in the green building materials industry from 2025 to 2035.

The industry is driven by escalating urbanization and government policies that support sustainable construction. Initiatives such as the Green Building Evaluation Standard facilitate the use of green materials.

FMI opines that China sales will grow at a nearly 13.2% CAGR from 2025 to 2035.

Australia and New Zealand

The Australian and New Zealand green building materials market is estimated to expand at a CAGR of approximately 11.3% from 2025 to 2035.

Both nations have demonstrated a considerable commitment to sustainability, with initiatives such as Green Star in Australia and Homestar in New Zealand encouraging the incorporation of environmentally friendly materials in construction.

Government policies and increasing awareness among consumers of environmental concerns are further fuelling the growth of the industry.

These nation-specific insights highlight the distinct growth trajectories of the industry at the global level, which are shaped by domestic policies, certifications, and industry-specific conditions.

FMI opines that Australia-NZ green building materials sales will grow at nearly 11.3% CAGR through 2025 to 2035.

Competitive Landscape

The industry for green building materials is led by a few major companies trying to expand their reach. They are growing their businesses by acquiring other companies and forming partnerships, all with the goal of providing more environmentally friendly products.

These companies focus on making new and better products, keeping costs competitive, and expanding by merging with or buying out other businesses.

For example, in February 2024, Holcim, a notable company, acquired ZinCo, renowned for its green roofing systems. This acquisition aimed to strengthen Holcim's business in the sustainable roofing sector.

Key Companies

  • Saint-Gobain
  • Owens Corning
  • Tata Steel
  • Armstrong World Industries
  • Kingspan Group
  • Knauf Insulation
  • Johns Manville
  • Rockwool International
  • PPG Industries
  • CertainTeed Corporation
  • BASF SE
  • Dow Chemical Company
  • DuPont
  • 3M Company
  • Asahi Glass Co., Ltd.
  • Lafarge
  • Henkel AG & Co. KGaA
  • USG Corporation
  • Akzo Nobel N.V.
  • Holcim Ltd.
  • Cemex
  • Sherwin-Williams Company
  • Sika AG
  • Wienerberger AG
  • Saint-Gobain Weber

Key Segments of Green Building Materials Market

By Product Type:

  • Structural Materials
    • Cross-Laminated Timber (CLT)
    • Bamboo
    • Recycled Steel
    • Recycled Aggregates
    • Fly Ash Bricks
    • Recycled Plastics
    • Reclaimed Wood
  • Insulation Materials
    • Cellulose Insulation
    • Mineral Wool
    • Recycled Textile
  • Interior & Exterior
    • Low VOC Paints
    • Cool Roof Coatings
    • Low Emissivity Glass

By End Use:

  • Residential Buildings
  • Commercial Buildings
  • Industrial Buildings
  • Institutional Buildings
    • Healthcare Facilities
    • Educational Facilities
  • Public Infrastructure

By Region:

  • North America
  • Latin America
  • Eastern Europe
  • Western Europe
  • South Asia & Pacific
  • East Asia
  • Middle East & Africa

Table of Content

  1. Executive Summary
    • Global Market Outlook
    • Demand-side Trends
    • Supply-side Trends
    • Technology Roadmap Analysis
    • Analysis and Recommendations
  2. Market Overview
    • Market Coverage / Taxonomy
    • Market Definition / Scope / Limitations
  3. Market Background
    • Market Dynamics
      • Drivers
      • Restraints
      • Opportunity
      • Trends
    • Scenario Forecast
      • Demand in Optimistic Scenario
      • Demand in Likely Scenario
      • Demand in Conservative Scenario
    • Opportunity Map Analysis
    • Product Life Cycle Analysis
    • Supply Chain Analysis
      • Supply Side Participants and their Roles
        • Producers
        • Mid-Level Participants (Traders/ Agents/ Brokers)
        • Wholesalers and Distributors
      • Value Added and Value Created at Node in the Supply Chain
      • List of Raw Material Suppliers
      • List of Existing and Potential Buyer’s
    • Investment Feasibility Matrix
    • Value Chain Analysis
      • Profit Margin Analysis
      • Wholesalers and Distributors
      • Retailers
    • PESTLE and Porter’s Analysis
    • Regulatory Landscape
      • By Key Regions
      • By Key Countries
    • Regional Parent Market Outlook
    • Production and Consumption Statistics
    • Import and Export Statistics
  4. Global Market Analysis 2020 to 2024 and Forecast, 2025 to 2035
    • Historical Market Size Value (USD Million) & Volume (KT) Analysis, 2020 to 2024
    • Current and Future Market Size Value (USD Million) & Volume (KT) Projections, 2025 to 2035
      • Y-o-Y Growth Trend Analysis
      • Absolute USD Opportunity Analysis
  5. Global Market Pricing Analysis 2020 to 2024 and Forecast 2025 to 2035
  6. Global Market Analysis 2020 to 2024 and Forecast 2025 to 2035, By Product Type
    • Introduction / Key Findings
    • Historical Market Size Value (USD Million) & Volume (KT) Analysis By Product Type, 2020 to 2024
    • Current and Future Market Size Value (USD Million) & Volume (KT) Analysis and Forecast By Product Type, 2025 to 2035
      • Structural Materials
        • Cross-Laminated Timber (CLT)
        • Bamboo
        • Recycled Steel
        • Recycled Aggregates
        • Fly Ash Bricks
        • Recycled Plastics
        • Reclaimed Wood
      • Insulation Materials
        • Cellulose Insulation
        • Mineral Wool
        • Recycled Textile
      • Interior & Exterior
        • Low VOC Paints
        • Cool Roof Coatings
        • Low Emissivity Glass
    • Y-o-Y Growth Trend Analysis By Product Type, 2020 to 2024
    • Absolute USD Opportunity Analysis By Product Type, 2025 to 2035
  7. Global Market Analysis 2020 to 2024 and Forecast 2025 to 2035, By End Use
    • Introduction / Key Findings
    • Historical Market Size Value (USD Million) & Volume (KT) Analysis By End Use, 2020 to 2024
    • Current and Future Market Size Value (USD Million) & Volume (KT) Analysis and Forecast By End Use, 2025 to 2035
      • Residential Buildings
      • Commercial Buildings
      • Industrial Buildings
      • Institutional Buildings
        • Healthcare Facilities
        • Educational Facilities
      • Public Infrastructure
    • Y-o-Y Growth Trend Analysis By End Use, 2020 to 2024
    • Absolute USD Opportunity Analysis By End Use, 2025 to 2035
  8. Global Market Analysis 2020 to 2024 and Forecast 2025 to 2035, By Region
    • Introduction
    • Historical Market Size Value (USD Million) & Volume (KT) Analysis By Region, 2020 to 2024
    • Current Market Size Value (USD Million) & Volume (KT) Analysis and Forecast By Region, 2025 to 2035
      • North America
      • Latin America
      • Western Europe
      • Eastern Europe
      • East Asia
      • South Asia & Pacific
      • Middle East and Africa
    • Market Attractiveness Analysis By Region
  9. North America Market Analysis 2020 to 2024 and Forecast 2025 to 2035, By Country
    • Historical Market Size Value (USD Million) & Volume (KT) Trend Analysis By Market Taxonomy, 2020 to 2024
    • Market Size Value (USD Million) & Volume (KT) Forecast By Market Taxonomy, 2025 to 2035
      • By Country
        • USA
        • Canada
        • Mexico
      • By Product Type
      • By End Use
    • Market Attractiveness Analysis
      • By Country
      • By Product Type
      • By End Use
    • Key Takeaways
  10. Latin America Market Analysis 2020 to 2024 and Forecast 2025 to 2035, By Country
    • Historical Market Size Value (USD Million) & Volume (KT) Trend Analysis By Market Taxonomy, 2020 to 2024
    • Market Size Value (USD Million) & Volume (KT) Forecast By Market Taxonomy, 2025 to 2035
      • By Country
        • Brazil
        • Argentina
        • Rest of LATAM
      • By Product Type
      • By End Use
    • Market Attractiveness Analysis
      • By Country
      • By Product Type
      • By End Use
    • Key Takeaways
  11. Western Europe Market Analysis 2020 to 2024 and Forecast 2025 to 2035, By Country
    • Historical Market Size Value (USD Million) & Volume (KT) Trend Analysis By Market Taxonomy, 2020 to 2024
    • Market Size Value (USD Million) & Volume (KT) Forecast By Market Taxonomy, 2025 to 2035
      • By Country
        • Germany
        • Italy
        • France
        • UK
        • Spain
        • BENELUX
        • Nordic
        • Rest of W.Europe
      • By Product Type
      • By End Use
    • Market Attractiveness Analysis
      • By Country
      • By Product Type
      • By End Use
    • Key Takeaways
  12. Eastern Europe Market Analysis 2020 to 2024 and Forecast 2025 to 2035, By Country
    • Historical Market Size Value (USD Million) & Volume (KT) Trend Analysis By Market Taxonomy, 2020 to 2024
    • Market Size Value (USD Million) & Volume (KT) Forecast By Market Taxonomy, 2025 to 2035
      • By Country
        • Russia
        • Hungary
        • Poland
        • Balkan & Baltics
        • Rest of E. Europe
      • By Product Type
      • By End Use
    • Market Attractiveness Analysis
      • By Country
      • By Product Type
      • By End Use
    • Key Takeaways
  13. East Asia Market Analysis 2020 to 2024 and Forecast 2025 to 2035, By Country
    • Historical Market Size Value (USD Million) & Volume (KT) Trend Analysis By Market Taxonomy, 2020 to 2024
    • Market Size Value (USD Million) & Volume (KT) Forecast By Market Taxonomy, 2025 to 2035
      • By Country
        • China
        • Japan
        • South Korea
      • By Product Type
      • By End Use
    • Market Attractiveness Analysis
      • By Country
      • By Product Type
      • By End Use
    • Key Takeaways
  14. South Asia & Pacific Market Analysis 2020 to 2024 and Forecast 2025 to 2035, By Country
    • Historical Market Size Value (USD Million) & Volume (KT) Trend Analysis By Market Taxonomy, 2020 to 2024
    • Market Size Value (USD Million) & Volume (KT) Forecast By Market Taxonomy, 2025 to 2035
      • By Country
        • India
        • Australia & New Zealand
        • ASEAN
        • Rest of SAP
      • By Product Type
      • By End Use
    • Market Attractiveness Analysis
      • By Country
      • By Product Type
      • By End Use
    • Key Takeaways
  15. Middle East and Africa Market Analysis 2020 to 2024 and Forecast 2025 to 2035, By Country
    • Historical Market Size Value (USD Million) & Volume (KT) Trend Analysis By Market Taxonomy, 2020 to 2024
    • Market Size Value (USD Million) & Volume (KT) Forecast By Market Taxonomy, 2025 to 2035
      • By Country
        • GCC Countries
        • Northern Africa
        • South Africa
        • Turkiye
        • Rest of MEA
      • By Product Type
      • By End Use
    • Market Attractiveness Analysis
      • By Country
      • By Product Type
      • By End Use
    • Key Takeaways
  16. Key Countries Market Analysis
    • USA
      • Pricing Analysis
      • Market Share Analysis, 2024
        • By Product Type
        • By End Use
    • Canada
      • Pricing Analysis
      • Market Share Analysis, 2024
        • By Product Type
        • By End Use
    • Brazil
      • Pricing Analysis
      • Market Share Analysis, 2024
        • By Product Type
        • By End Use
    • Mexico
      • Pricing Analysis
      • Market Share Analysis, 2024
        • By Product Type
        • By End Use
    • Argentina
      • Pricing Analysis
      • Market Share Analysis, 2024
        • By Product Type
        • By End Use
  17. Market Structure Analysis
    • Competition Dashboard
    • Competition Benchmarking
    • Market Share Analysis of Top Players
  18. Competition Analysis
    • Competition Deep Dive
      • BASF SE
        • Overview
        • Product Portfolio
        • Profitability by Market Segments (Product/Age /Sales Channel/Region)
        • Sales Footprint
        • Strategy Overview
      • SIKA AG
      • Holcim Group
      • Owens Corning
      • PPG Industries Inc.
      • RedBuilt
      • IsoHemp
      • Binderholz GmbH
      • Interface Inc.
      • Novagard Solutions
      • Kingspan Group
      • Acoustical Surfaces Inc.
      • Interface Inc
      • Tarkett
      • James Hardie Industries
      • Boral Limited
      • Saint-Gobain
      • USG Corporation
      • Masonite International
  19. Assumptions & Acronyms Used
  20. Research Methodology

List of Tables

  • Table 1: Global Market Value (USD Million) Forecast by Region, 2020-2035
  • Table 2: Global Market Volume (KT) Forecast by Region, 2020-2035
  • Table 3: Global Market Value (USD Million) Forecast by Product Type, 2020-2035
  • Table 4: Global Market Volume (KT) Forecast by Product Type, 2020-2035
  • Table 5: Global Market Value (USD Million) Forecast by End Use, 2020-2035
  • Table 6: Global Market Volume (KT) Forecast by End Use, 2020-2035
  • Table 7: North America Market Value (USD Million) Forecast by Country, 2020-2035
  • Table 8: North America Market Volume (KT) Forecast by Country, 2020-2035
  • Table 9: North America Market Value (USD Million) Forecast by Product Type, 2020-2035
  • Table 10: North America Market Volume (KT) Forecast by Product Type, 2020-2035
  • Table 11: North America Market Value (USD Million) Forecast by End Use, 2020-2035
  • Table 12: North America Market Volume (KT) Forecast by End Use, 2020-2035
  • Table 13: Latin America Market Value (USD Million) Forecast by Country, 2020-2035
  • Table 14: Latin America Market Volume (KT) Forecast by Country, 2020-2035
  • Table 15: Latin America Market Value (USD Million) Forecast by Product Type, 2020-2035
  • Table 16: Latin America Market Volume (KT) Forecast by Product Type, 2020-2035
  • Table 17: Latin America Market Value (USD Million) Forecast by End Use, 2020-2035
  • Table 18: Latin America Market Volume (KT) Forecast by End Use, 2020-2035
  • Table 19: Western Europe Market Value (USD Million) Forecast by Country, 2020-2035
  • Table 20: Western Europe Market Volume (KT) Forecast by Country, 2020-2035
  • Table 21: Western Europe Market Value (USD Million) Forecast by Product Type, 2020-2035
  • Table 22: Western Europe Market Volume (KT) Forecast by Product Type, 2020-2035
  • Table 23: Western Europe Market Value (USD Million) Forecast by End Use, 2020-2035
  • Table 24: Western Europe Market Volume (KT) Forecast by End Use, 2020-2035
  • Table 25: Eastern Europe Market Value (USD Million) Forecast by Country, 2020-2035
  • Table 26: Eastern Europe Market Volume (KT) Forecast by Country, 2020-2035
  • Table 27: Eastern Europe Market Value (USD Million) Forecast by Product Type, 2020-2035
  • Table 28: Eastern Europe Market Volume (KT) Forecast by Product Type, 2020-2035
  • Table 29: Eastern Europe Market Value (USD Million) Forecast by End Use, 2020-2035
  • Table 30: Eastern Europe Market Volume (KT) Forecast by End Use, 2020-2035
  • Table 31: East Asia Market Value (USD Million) Forecast by Country, 2020-2035
  • Table 32: East Asia Market Volume (KT) Forecast by Country, 2020-2035
  • Table 33: East Asia Market Value (USD Million) Forecast by Product Type, 2020-2035
  • Table 34: East Asia Market Volume (KT) Forecast by Product Type, 2020-2035
  • Table 35: East Asia Market Value (USD Million) Forecast by End Use, 2020-2035
  • Table 36: East Asia Market Volume (KT) Forecast by End Use, 2020-2035
  • Table 37: South Asia & Pacific Market Value (USD Million) Forecast by Country, 2020-2035
  • Table 38: South Asia & Pacific Market Volume (KT) Forecast by Country, 2020-2035
  • Table 39: South Asia & Pacific Market Value (USD Million) Forecast by Product Type, 2020-2035
  • Table 40: South Asia & Pacific Market Volume (KT) Forecast by Product Type, 2020-2035
  • Table 41: South Asia & Pacific Market Value (USD Million) Forecast by End Use, 2020-2035
  • Table 42: South Asia & Pacific Market Volume (KT) Forecast by End Use, 2020-2035
  • Table 43: Middle East and Africa Market Value (USD Million) Forecast by Country, 2020-2035
  • Table 44: Middle East and Africa Market Volume (KT) Forecast by Country, 2020-2035
  • Table 45: Middle East and Africa Market Value (USD Million) Forecast by Product Type, 2020-2035
  • Table 46: Middle East and Africa Market Volume (KT) Forecast by Product Type, 2020-2035
  • Table 47: Middle East and Africa Market Value (USD Million) Forecast by End Use, 2020-2035
  • Table 48: Middle East and Africa Market Volume (KT) Forecast by End Use, 2020-2035

List of Figures

  • Figure 1: Global Market Volume (KT) Forecast 2020-2035
  • Figure 2: Global Market Pricing Analysis
  • Figure 3: Global Market Value (USD Million) Forecast 2020-2035
  • Figure 4: Global Market Value Share and BPS Analysis by Product Type, 2025 and 2035
  • Figure 5: Global Market Y-o-Y Growth Comparison by Product Type, 2025-2035
  • Figure 6: Global Market Attractiveness Analysis by Product Type
  • Figure 7: Global Market Value Share and BPS Analysis by End Use, 2025 and 2035
  • Figure 8: Global Market Y-o-Y Growth Comparison by End Use, 2025-2035
  • Figure 9: Global Market Attractiveness Analysis by End Use
  • Figure 10: Global Market Value (USD Million) Share and BPS Analysis by Region, 2025 and 2035
  • Figure 11: Global Market Y-o-Y Growth Comparison by Region, 2025-2035
  • Figure 12: Global Market Attractiveness Analysis by Region
  • Figure 13: North America Market Incremental USD Opportunity, 2025-2035
  • Figure 14: Latin America Market Incremental USD Opportunity, 2025-2035
  • Figure 15: Western Europe Market Incremental USD Opportunity, 2025-2035
  • Figure 16: Eastern Europe Market Incremental USD Opportunity, 2025-2035
  • Figure 17: East Asia Market Incremental USD Opportunity, 2025-2035
  • Figure 18: South Asia & Pacific Market Incremental USD Opportunity, 2025-2035
  • Figure 19: Middle East and Africa Market Incremental USD Opportunity, 2025-2035
  • Figure 20: North America Market Value Share and BPS Analysis by Country, 2025 and 2035
  • Figure 21: North America Market Value Share and BPS Analysis by Product Type, 2025 and 2035
  • Figure 22: North America Market Y-o-Y Growth Comparison by Product Type, 2025-2035
  • Figure 23: North America Market Attractiveness Analysis by Product Type
  • Figure 24: North America Market Value Share and BPS Analysis by End Use, 2025 and 2035
  • Figure 25: North America Market Y-o-Y Growth Comparison by End Use, 2025-2035
  • Figure 26: North America Market Attractiveness Analysis by End Use
  • Figure 27: Latin America Market Value Share and BPS Analysis by Country, 2025 and 2035
  • Figure 28: Latin America Market Value Share and BPS Analysis by Product Type, 2025 and 2035
  • Figure 29: Latin America Market Y-o-Y Growth Comparison by Product Type, 2025-2035
  • Figure 30: Latin America Market Attractiveness Analysis by Product Type
  • Figure 31: Latin America Market Value Share and BPS Analysis by End Use, 2025 and 2035
  • Figure 32: Latin America Market Y-o-Y Growth Comparison by End Use, 2025-2035
  • Figure 33: Latin America Market Attractiveness Analysis by End Use
  • Figure 34: Western Europe Market Value Share and BPS Analysis by Country, 2025 and 2035
  • Figure 35: Western Europe Market Value Share and BPS Analysis by Product Type, 2025 and 2035
  • Figure 36: Western Europe Market Y-o-Y Growth Comparison by Product Type, 2025-2035
  • Figure 37: Western Europe Market Attractiveness Analysis by Product Type
  • Figure 38: Western Europe Market Value Share and BPS Analysis by End Use, 2025 and 2035
  • Figure 39: Western Europe Market Y-o-Y Growth Comparison by End Use, 2025-2035
  • Figure 40: Western Europe Market Attractiveness Analysis by End Use
  • Figure 41: Eastern Europe Market Value Share and BPS Analysis by Country, 2025 and 2035
  • Figure 42: Eastern Europe Market Value Share and BPS Analysis by Product Type, 2025 and 2035
  • Figure 43: Eastern Europe Market Y-o-Y Growth Comparison by Product Type, 2025-2035
  • Figure 44: Eastern Europe Market Attractiveness Analysis by Product Type
  • Figure 45: Eastern Europe Market Value Share and BPS Analysis by End Use, 2025 and 2035
  • Figure 46: Eastern Europe Market Y-o-Y Growth Comparison by End Use, 2025-2035
  • Figure 47: Eastern Europe Market Attractiveness Analysis by End Use
  • Figure 48: East Asia Market Value Share and BPS Analysis by Country, 2025 and 2035
  • Figure 49: East Asia Market Value Share and BPS Analysis by Product Type, 2025 and 2035
  • Figure 50: East Asia Market Y-o-Y Growth Comparison by Product Type, 2025-2035
  • Figure 51: East Asia Market Attractiveness Analysis by Product Type
  • Figure 52: East Asia Market Value Share and BPS Analysis by End Use, 2025 and 2035
  • Figure 53: East Asia Market Y-o-Y Growth Comparison by End Use, 2025-2035
  • Figure 54: East Asia Market Attractiveness Analysis by End Use
  • Figure 55: South Asia & Pacific Market Value Share and BPS Analysis by Country, 2025 and 2035
  • Figure 56: South Asia & Pacific Market Value Share and BPS Analysis by Product Type, 2025 and 2035
  • Figure 57: South Asia & Pacific Market Y-o-Y Growth Comparison by Product Type, 2025-2035
  • Figure 58: South Asia & Pacific Market Attractiveness Analysis by Product Type
  • Figure 59: South Asia & Pacific Market Value Share and BPS Analysis by End Use, 2025 and 2035
  • Figure 60: South Asia & Pacific Market Y-o-Y Growth Comparison by End Use, 2025-2035
  • Figure 61: South Asia & Pacific Market Attractiveness Analysis by End Use
  • Figure 62: Middle East and Africa Market Value Share and BPS Analysis by Country, 2025 and 2035
  • Figure 63: Middle East and Africa Market Value Share and BPS Analysis by Product Type, 2025 and 2035
  • Figure 64: Middle East and Africa Market Y-o-Y Growth Comparison by Product Type, 2025-2035
  • Figure 65: Middle East and Africa Market Attractiveness Analysis by Product Type
  • Figure 66: Middle East and Africa Market Value Share and BPS Analysis by End Use, 2025 and 2035
  • Figure 67: Middle East and Africa Market Y-o-Y Growth Comparison by End Use, 2025-2035
  • Figure 68: Middle East and Africa Market Attractiveness Analysis by End Use
  • Figure 69: Global Market - Tier Structure Analysis
  • Figure 70: Global Market - Company Share Analysis

Frequently Asked Questions

What drives the demand for green building materials?

Stricter regulations, sustainability goals, and cost savings fuel adoption.

How do these materials improve energy efficiency?

They enhance insulation, reduce heat absorption, and lower energy use.

Which sectors use green building materials the most?

Residential, commercial, and institutional buildings lead adoption.

What are the latest innovations in green building materials?

Self-healing concrete, bio-based insulation, and solar-integrated roofing.

Are there government incentives for green building materials?

Yes, tax credits, grants, and subsidies promote eco-friendly construction.

Explore Similar Insights

Future Market Insights

Green Building Materials Market