The green coffee bean extract market is projected to grow from USD 294.3 million in 2025 to USD 369.4 million by 2035, reflecting a CAGR of 2.3% during the forecast period.
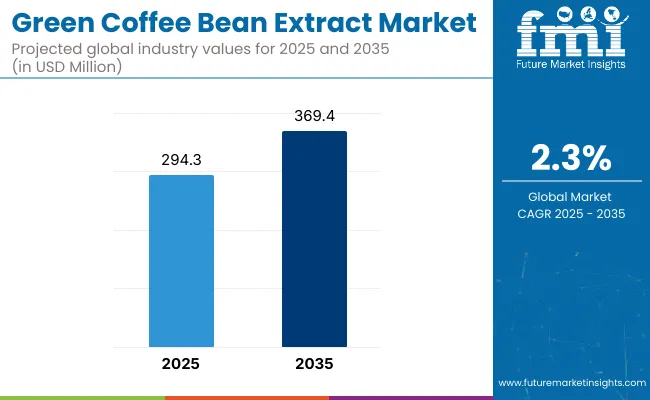
The increasing interest in natural weight management solutions, antioxidant-rich supplements, and clean-label functional ingredients has driven steady expansion. Consumers are shifting toward herbal and plant-based extracts, favoring green coffee bean extract for its metabolism-boosting and energy-enhancing properties.
Manufacturers are expanding production capacities and investing in advanced extraction techniques to enhance chlorogenic acid content, the primary bioactive compound responsible for weight management and cardiovascular benefits.
The demand for standardized, high-potency green coffee bean extracts is rising in the nutraceutical, functional beverage, and dietary supplement sectors. Companies are also launching organic-certified and non-GMO variants to appeal to health-conscious consumers.
The increasing preference for natural ingredients is driving new product formulations in weight-loss supplements, herbal teas, and clean-label energy drinks. With concerns about synthetic weight-loss products and artificial stimulants, consumers are turning to green coffee bean extract-based alternatives. Manufacturers are responding by developing capsules, powders, and RTD (ready-to-drink) beverages to cater to evolving consumer preferences.
The growing fitness and wellness trend is further supporting market growth. Green coffee bean extract is being integrated into sports nutrition and metabolism-boosting formulations, targeting athletes and individuals looking for natural fat burners. Additionally, direct-to-consumer (DTC) sales, e-commerce expansion, and personalized nutrition trends are increasing the accessibility of green coffee bean extract products.
With clean-label positioning, scientific validation, and expanding applications across industries, the green coffee bean extract industry is set for moderate yet sustained growth over the next decade.
The industry is growing due to its antioxidant and weight management properties, fueling demand in various industries. In dietary supplements, the extract is in high demand because of its high chlorogenic acid levels, which are renowned for their ability to support metabolism and fat loss.
The beverage and food industry uses green coffee extract in flavored coffees, energy drinks, and functional beverages with an emphasis on natural energy stimulants. Pharmaceutical use is based on its antioxidant and anti-inflammatory characteristics, and thus, it is added to cardiovascular and metabolic health products.
The cosmetic and personal care industry is also adopting green coffee extract as an anti-aging and firming skin care product because it contains high polyphenols. Within the retail space, consumer demand for organic, non-GMO, and minimally processed foods continues to shape purchasing behavior. Clean-label, plant-based wellness products are fueling innovation and growth in this category.
The below table presents a comparative assessment of the variation in CAGR over six months for the base year (2024) and the current year (2025) for the global green coffee bean extract industry.
This analysis reveals crucial shifts in performance and indicates revenue realization patterns, thus providing stakeholders with a better vision of the growth trajectory over the year. The first half of the year, or H1, spans from January to June. The second half, H2, includes the months from July to December.
| Particular | Value CAGR |
|---|---|
| H1 (2024 to 2034) | 2.0% |
| H2 (2024 to 2034) | 2.4% |
| H1 (2025 to 2035) | 2.1% |
| H2 (2025 to 2035) | 2.5% |
In the first half (H1) of the decade from 2025 to 2035, the business is predicted to surge at a CAGR of 2.3%, followed by a slightly higher growth rate of 2.4% in the second half (H2) of the same decade.
Moving into the subsequent period, from H1 2025 to H2 2035, the CAGR is projected to increase to 2.5% in the first half and remain stable at 2.3% in the second half. In the first half (H1), the sector witnessed an increase of 10 BPS, while in the second half (H2), the business experienced increase of 10 BPS.
Between 2020 and 2024, the green coffee bean extract industry expanded continuously due to an increasing interest among consumers in natural dietary supplements for weight loss and functional drinks.
Green coffee bean extract gained popularity due to its high content of chlorogenic acid, which supports metabolism and weight loss. Big data and artificial intelligence helped manufacturers know the preferences of customers and design products with higher efficacy and flavor.
Clean-label foods and increasing uses of plant-based ingredients propelled the use of green coffee bean extract in health drinks, nutraceuticals, and functional foods. Nonetheless, supply chain interferences, varying raw material prices, and varying product quality created issues.
Towards 2025 to 2035, predictive modeling using AI and quantum-fueled molecular screening will enhance bioavailability and bioactivity of green coffee bean extract. Blockchain supply chains will facilitate increased traceability to validate legitimacy and authenticate quality control.
Green agricultural practices and carbon-neutral extraction will minimize the ecological footprint. AI-developed products will produce green coffee bean products tailored to an individual's metabolic fingerprint. Functional variants with added probiotics, adaptogens, and cognitive function boosters will be the focal point of product development. Intelligent AI-based manufacturing systems will maximize production efficiency and reduce waste, making green coffee bean extract a key active in the expanding health and wellness industry.
A Comparative Market Shift Analysis 2020 to 2024 vs. 2025 to 2035
| 2020 to 2024 | 2025 to 2035 |
|---|---|
| Increasing demand for natural weight loss products and functional drinks | Customized green coffee bean formulations for specific healthcare requirements |
| AI-informed taste and nutrient preservation improvements | Quantum analytics for increased potency and bioavailability |
| Raw material sourcing disruptions and uneven quality | Transparent supply chains with blockchain-based real-time tracking |
| Priority on environmentally friendly extraction and less waste | Carbon-neutral extraction powered by AI using renewable energy |
| Compliance with regulation of supplement safety and labeling | AI-powered automated compliance and real-time monitoring |
| AI in big data for trend analysis and product formulation | Edge AI for real-time production optimization and intelligent formulation |
| Popular for weight loss and metabolic support | Enhanced health benefits with added probiotics, adaptogens, and cognitive enhancers |
The green coffee bean extract industry is at risk for its raw material supply fluctuations, regulatory scrutiny, and evolving consumer preferences. Green coffee beans are considered as agricultural commodities, and their rates are volatile largely because of climate change, pests, and geopolitical factors that are relating to coffee-growing regions.
This results in instability in the supply chain and potential increases in the costs for manufacturers. Regulatory risks also considerably affect the situation. Health claims related to the green coffee bean extract, particularly those associated with weight loss, have pushed food safety authorities like the FDA and EFSA to impose stringent regulations. Non-compliance or misleading advertising might lead to product recalls, lawsuits, or fines, which consequently harm the integrity of the brand.
Industry saturation and pricing pressure from competitors further complicate the operation. The enhancement of other natural foods alternates consumer interest, which could fluctuate more with regard to the newest superfoods, reducing it. Along with that, in order to differentiate themselves from competitors and ensure relevance, the brands have to maintain high quality and organic certification or use functional blends.
Low-quality or adulterated goods that are available on the industry can cause consumers' worries about their authenticity and efficacy, leading to the disassociation of the customers among themselves. To keep their credibility, firms are to invest in the supply of materials that are from trusted sources, ensure product quality, and administer third-party testing programs.
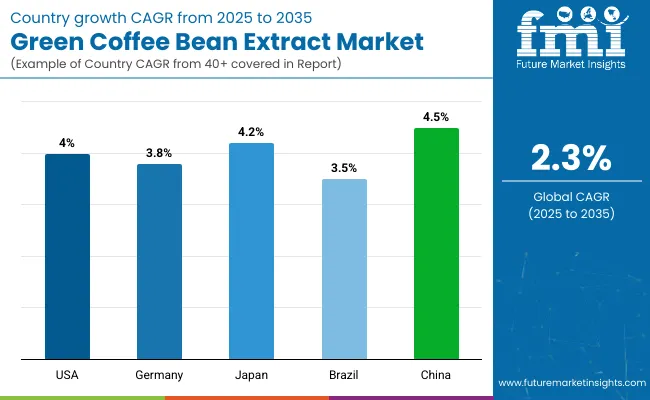
| Countries | CAGR (2025 to 2035) |
|---|---|
| The USA | 4.0% |
| Germany | 3.8% |
| Japan | 4.2% |
| Brazil | 3.5% |
| China | 4.5% |
The USA dominates the world in the green coffee bean extract industry with a projected CAGR of 4.0% between 2025 and 2035. Increased health and wellness awareness among consumers fuels the demand for natural and organic supplements.
Green coffee bean extract, prized for its antioxidant value and its possible function in weight management, has become popular among wellness-oriented consumers. The dense concentration of nutraceutical firms and health food stores makes growth potential. Moreover, consumers embrace clean-label foods and plant-based consumption, which stimulates the adoption of dietary supplements and functional beverages.
Growth Factors in the USA
| Key Drivers | Details |
|---|---|
| Health-conscious consumers | The increasing rate of obesity and growing wellness trends drive demand for natural supplements. |
| Strong nutraceutical industry | Established industry guarantees supply of products and innovation. |
| Clean-label movement | Customers look for minimal processing and no artificial additives in products. |
| Retail growth | Health food stores, online, and pharmacies make life easier. |
The German green coffee bean extract market will grow at a CAGR of 3.8% during the forecast period. The long tradition of herbal remedies and natural health products drives customer demand for botanical extracts.
High-quality, evidence-based products attract German customers, and therefore, manufacturers invest in R&D. The industry has established distribution channels through pharmacies, health food stores, and websites. Greater lifestyle disease, i.e., obesity and diabetes, also brings greater demand for natural weight management supplements and equilibrium of metabolism.
Growth Factors in Germany
| Key Drivers | Details |
|---|---|
| Traditional herbal medicine | The traditional use of herbal medicine enables green coffee extract uses |
| Clinical support | Consumer demand for quality-tested, substantiated products. |
| Additional distribution channels | Coverage across pharmacy chain stores and internet retail stores elevates its accessibility. |
| Spurts in growth in metabolic disorders | Increased levels of obesity and diabetes propel demands for weight control supplements. |
The industry in Japan is likely to grow in 2035 with a projected growth CAGR of 4.2%. Consumers' emphasis on longevity and well-being generates a growing demand for functional foods and supplements. Green coffee bean extract finds applications in a range of products, from beverages to capsules and beauty supplements.
New product development and retail support drive growth. The partnership of local producers with overseas brands enhances product access and customer confidence. Focus on effectiveness and quality resonates with consumer demands, delivering steady market growth.
Growth Factors in Japan
| Key Drivers | Details |
|---|---|
| Wellness culture | Japanese consumers demand functional food and anti-aging products. |
| Product innovation | Firms launch varied products, such as capsules and beauty supplements. |
| Strong retail network | Internet channels, convenience stores, and specialty stores improve penetration. |
| Global partnerships | Partnerships increase product accessibility and brand credibility. |
The industry is expected to grow at a CAGR of 3.5% through 2035. As one of the biggest producers of coffee globally, Brazil has an abundance of raw materials available, and hence production is cheaper and the industry remains competitive. Growing middle-class incomes and greater interest in healthy lifestyles propel natural supplement demand.
Local manufacturers also leverage Brazil's robust agricultural base to create organic and sustainable product offerings. Retail distribution support, such as supermarkets and websites, guarantees greater consumer access.
Growth Factors in Brazil
| Key Drivers | Details |
|---|---|
| Industry leader coffee grower | Raw materials available ensure production remains cost-competitive. |
| Health and wellness trends | Increasing numbers of consumers look for natural alternatives to traditional weight management products. |
| Growing middle class | Greater disposable incomes translate into premium health supplement purchases. |
| Multiple retailing channels | Supermarkets, pharmacies, and websites provide greater access to the product. |
The industry in China is forecast to grow at the highest rate of the countries listed, at a 4.5% CAGR over the 2025 to 2035 period. Growing middle class, higher disposable income, and rising health concerns propel growth.
Natural means of weight management are gaining popularity among city consumers, and green coffee bean extract is in line with the teachings of traditional Chinese medicine in support of herbal therapy. Online retail websites are a major distribution driver, with international and domestic players fighting for share. Government promotion of plant foods and functional foods are other growth drivers.
Growth Factors in China
| Key Drivers | Details |
|---|---|
| Increase in middle-class incomes | More people are increasing access to quality health products. |
| Herbal medicine compatibility | Green coffee extract is easily compatible with mainstream Chinese philosophies of health. |
| E-commerce dominance | Easy online sales access to local and international brands. |
| Government initiatives | Regulations for plant-based health solutions propel market expansion. |
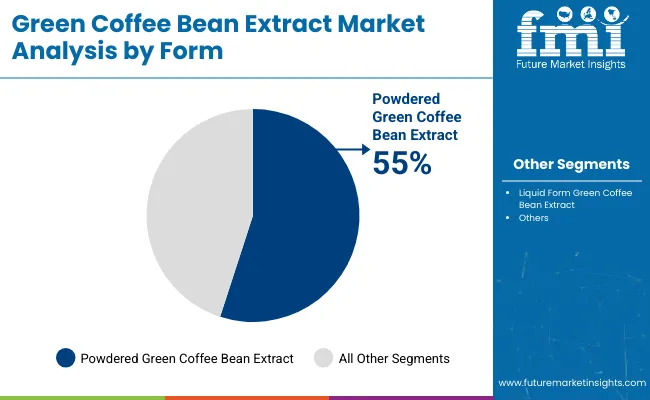
| Segment | Value Share (2025) |
|---|---|
| Powdered Green Coffee Bean Extract (By Application) | 55% |
The industry for green coffee bean extract is divided into powdered and liquid forms, and powdered extracts will dominate with a share of more than 55% in the global market by 2025, owing to stability, long shelf life, and versatility in dietary supplements and functional beverages.
Powder forms are also popular applications for weight management and metabolic enhancement, which can be seen in all sorts of nutraceuticals, protein blends, and ready-to-drinks. Supplement potency was standardized by DW for chlorogenic acids.
Analysts also highlight the importance of investments in technologies, like spray drying and micronization, to boost solubility and bioavailability as key players like Naturex, Applied Food Sciences, and Sabinsa Corporation continue to invest in the segment.
The demand, especially among health-sensitive consumers, is further being stimulated by the push for DIY health beverages and functional home-brewing trends. Liquid extracts have a smaller market share when compared to other forms but are witnessing strong growth in the energy drinks, functional shots, and liquid supplements markets due to their rapid absorption and higher bioavailability.
Despite the advantages, hurdles like shorter shelf life and transport/ storage constraints limit their adoption compared to powders. There is an increasing demand for clean-label products; in addition, with the growing preference for natural energy booster products, both powdered and liquid extracts are likely to witness this innovation during the forecast period, especially in North America, Europe, and emerging Asia-Pacific markets.
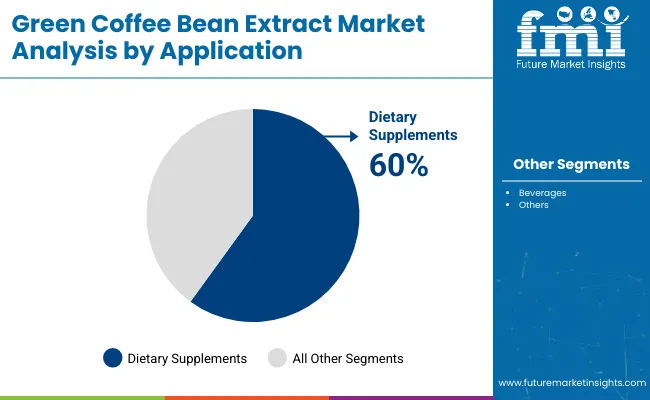
| Segment | Value Share (2025) |
|---|---|
| Dietary Supplements (By Application ) | 60% |
On the basis of applications, green coffee bean extract can be segmented into dietary supplements, beverages, and others. Dietary supplements dominated the segment, accounting for over 60% of total sales by 2025. This appetite is fuelled by the growing consumer interest in natural metabolisers and fat-burners.
They are one of the most common forms of dietary supplements and are available in capsules, tablets, or powder (note brands like NatureWise, NOW Foods, and Sports Research provide extracts with a standardized concentration to promote fat metabolism and cardiovascular wellness).
Additionally, the growth of e-commerce and direct-to-consumer supplement sales has played an important role in the general market increase, leading to enhanced availability of these products worldwide. Furthermore, personalized nutrition is driving tailored supplement formulations as consumers seek targeted health solutions.
Estimated to retain a market share of 25%, the beverages segment is growing steadily, especially in functional beverages like energy drinks and health shots or ready-to-drink functional beverages. The growing demand for clean-label, plant-based energy boosters has led to the infusion of green coffee extract into cold brews, herbal teas, and antioxidant-fortified beverages.
Brands such as Starbucks and VitaCup have taken note of this shift by developing green coffee infusion beverages for health-conscious consumers looking for caffeine without the added negative health consequences. Because of further innovation in nutraceuticals and functional beverages, demand for green coffee bean extract is expected to grow significantly in major markets such as North America, Europe, and Asia Pacific.
Green coffee bean extract is steadily rising in popularity, given the increasing consumer demand for natural weight management ingredients, antioxidant-laden supplements, and functional beverages. The health benefits of chlorogenic acid in metabolism support and blood glucose regulation are perhaps marketing factors that would likely drive chlorogenic acid product adoption in the nutraceutical, pharmaceutical, and functional food sectors.
Market leaders such as Alchem International, Nature Wise, Naturex, Nature's Way Products, and MKC Food Products have rightly dominated the market through scientific research, premium sourcing organizations, and product differentiation via well-known ingredients. In the meantime, emerging companies and private-label brands are trying to capture niche consumer segments with organic, non-GMO, and high-potency formulations.
Changes in the market are made by advances in standardized extraction techniques, capsule formulation, and clean-label transparency. Companies are pursuing their global distribution expansion via the health stores and DTC e-commerce channels.
Strategic elements impacting competition will be securing quality green coffee bean sourcing, complying with dietary supplement regulations, and investing in clinical studies to back up health claims. All companies able to claim distinguished, with proven efficacy, along with sustainably sourced ingredients and strong branding, will cement their position in this growing market.
Market Share Analysis by Company
| Company Name | Estimated Market Share (%) |
|---|---|
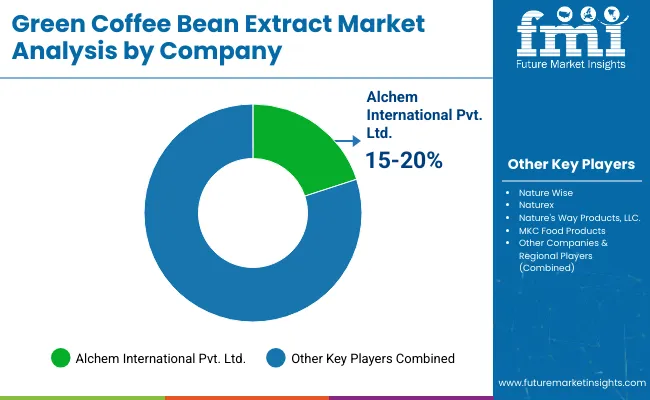
| Alchem International Pvt. Ltd. | 15-20% |
| Nature Wise | 12-16% |
| Naturex | 10-14% |
| Nature's Way Products, LLC. | 8-12% |
| MKC Food Products | 7-10% |
| Other Players | 35-45% |
| Company Name | Key Offerings & Market Focus |
|---|---|
| Alchem International Pvt. Ltd. | A leader in phytochemicals and botanical extracts, offering high-potency green coffee bean extract for pharma and nutraceutical applications. |
| Nature Wise | Focuses on organic, non-GMO, clinically tested green coffee bean supplements, leveraging strong DTC (Direct-to-Consumer) and online retail channels. |
| Naturex | Specializes in natural plant-based extracts, serving food, beverage, and supplement manufacturers with high-purity green coffee extracts. |
| Nature's Way Products, LLC. | A leading herbal supplement brand, integrating green coffee bean extract into multi-ingredient wellness formulations. |
| MKC Food Products | Expanding into functional food applications, offering customized green coffee powder and extract solutions. |
Key Company Insights
Alchem International (15-20%)
World leader in botanical extracts and high-standard, clinically backed green coffee bean extracts to pharmaceutical, nutraceutical, and cosmetic industries.
Nature Wise (12-16%)
Online well-being with clean-label, organic, clinically tested supplements focusing on weight management.
Naturex (10-14%)
Manufactures food-grade botanical extracts and supplies functional beverage and supplement markets with chlorogenic acid extracts of high potency.
Nature's Way (8-12%)
Mainstreaming green coffee extract by herbal supplement lines with a focus on holistic health and traditional medicine approaches.
MKC Food Products (7-10%)
Its applications in food industries are being widened by tapping functional drinks and nutritional powders exhibiting amphiphilicity and customized extracts for them.
Other Key Players (35-45% Combined)
The industry is segmented into powdered and liquid forms, with increasing demand for highly soluble and bioavailable extracts in dietary supplements and functional beverages.
The industry is divided into in beverages, in dietary supplements, and in others, with dietary supplements leading due to rising consumer preference for natural metabolism-boosting and fat-burning products.
The industry is segmented into in drug stores, in specialty stores, in supermarket, in hypermarket, in convenience stores, and in others, with online retail expanding due to direct-to-consumer sales strategies.
The industry is categorized into North America, Latin America, Western Europe, Eastern Europe, South Asia & Pacific, East Asia, Central Asia, Balkan and Baltic Countries, Russia and Belarus, and The Middle East & Africa.
The industry is projected to grow at a CAGR of 2.3% from 2025 to 2035, driven by increasing demand for natural metabolism-boosting and antioxidant-rich supplements.
By 2035, the industry is expected to reach approximately USD 369.4 million, supported by expanding applications in dietary supplements, functional beverages, and weight management products.
The dietary supplements segment is expected to grow the fastest, as green coffee bean extract is widely used for its chlorogenic acid content, aiding in weight management and metabolic health.
Rising consumer preference for plant-based fat burners, increasing demand for stimulant-free energy boosters, growing awareness of natural antioxidants, and expansion of e-commerce supplement sales are key growth drivers.
Leading players in the industry include Pure Svetol, NatureWise, Sports Research, Lumen, Huntington, and Muscletech, focusing on product innovation, clinically tested formulations, and organic-certified extracts.


Our Research Products

The "Full Research Suite" delivers actionable market intel, deep dives on markets or technologies, so clients act faster, cut risk, and unlock growth.

The Leaderboard benchmarks and ranks top vendors, classifying them as Established Leaders, Leading Challengers, or Disruptors & Challengers.

Locates where complements amplify value and substitutes erode it, forecasting net impact by horizon

We deliver granular, decision-grade intel: market sizing, 5-year forecasts, pricing, adoption, usage, revenue, and operational KPIs—plus competitor tracking, regulation, and value chains—across 60 countries broadly.

Spot the shifts before they hit your P&L. We track inflection points, adoption curves, pricing moves, and ecosystem plays to show where demand is heading, why it is changing, and what to do next across high-growth markets and disruptive tech

Real-time reads of user behavior. We track shifting priorities, perceptions of today’s and next-gen services, and provider experience, then pace how fast tech moves from trial to adoption, blending buyer, consumer, and channel inputs with social signals (#WhySwitch, #UX).

Partner with our analyst team to build a custom report designed around your business priorities. From analysing market trends to assessing competitors or crafting bespoke datasets, we tailor insights to your needs.
Supplier Intelligence
Discovery & Profiling
Capacity & Footprint
Performance & Risk
Compliance & Governance
Commercial Readiness
Who Supplies Whom
Scorecards & Shortlists
Playbooks & Docs
Category Intelligence
Definition & Scope
Demand & Use Cases
Cost Drivers
Market Structure
Supply Chain Map
Trade & Policy
Operating Norms
Deliverables
Buyer Intelligence
Account Basics
Spend & Scope
Procurement Model
Vendor Requirements
Terms & Policies
Entry Strategy
Pain Points & Triggers
Outputs
Pricing Analysis
Benchmarks
Trends
Should-Cost
Indexation
Landed Cost
Commercial Terms
Deliverables
Brand Analysis
Positioning & Value Prop
Share & Presence
Customer Evidence
Go-to-Market
Digital & Reputation
Compliance & Trust
KPIs & Gaps
Outputs
Full Research Suite comprises of:
Market outlook & trends analysis
Interviews & case studies
Strategic recommendations
Vendor profiles & capabilities analysis
5-year forecasts
8 regions and 60+ country-level data splits
Market segment data splits
12 months of continuous data updates
DELIVERED AS:
PDF EXCEL ONLINE
Coffee Bean Grind Machine Market Trends - Growth & Forecast 2025 to 2035
Coffee Extract Market Analysis by Nature, Product, End Use, Formulation, and Region through 2025 to 2035
Green Tea Extracts Market Analysis – Size, Share & Forecast 2025 to 2035
Cocoa Bean Extract Market Trends - Nature & Cocoa Type Insights
Demand for Coffee Extracts in USA Size and Share Forecast Outlook 2025 to 2035
Demand for Coffee Extracts in Japan Size and Share Forecast Outlook 2025 to 2035
Climate resilient Coffee Beans Market Size and Share Forecast Outlook 2025 to 2035
Glycine Soja (Soybean) Seed Extract Market Size and Share Forecast Outlook 2025 to 2035
Coffee Cherry Market Forecast and Outlook 2025 to 2035
Coffee Filter Paper Market Size and Share Forecast Outlook 2025 to 2035
Green and Bio-based Polyol Market Size and Share Forecast Outlook 2025 to 2035
Green Ammonia Market Size and Share Forecast Outlook 2025 to 2035
Green Cement Market Size and Share Forecast Outlook 2025 to 2035
Green Power Market Size and Share Forecast Outlook 2025 to 2035
Bean Flour Market Size and Share Forecast Outlook 2025 to 2035
Green Chemicals Market Size and Share Forecast Outlook 2025 to 2035
Green Power Transformer Market Size and Share Forecast Outlook 2025 to 2035
Coffee Roaster Machine Market Analysis - Size, Share, and Forecast 2025 to 2035
Bean Ingredients Market Size and Share Forecast Outlook 2025 to 2035
Green Preservatives Market Size and Share Forecast Outlook 2025 to 2035

Thank you!
You will receive an email from our Business Development Manager. Please be sure to check your SPAM/JUNK folder too.
Chat With
MaRIA