Greenwrap Market Size, Share, and Forecast Outlook 2025 to 2035

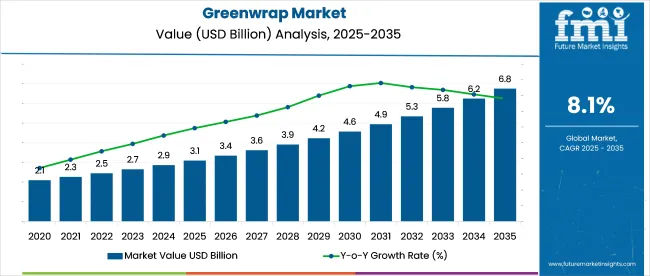
In 2025, the global greenwrap market is likely to be valued at USD 3.1 billion, with projections indicating growth to USD 6.8 billion by 2035 at a CAGR of 8.1%. Between 2020 and 2024, the greenwrap market expanded from USD 2.05 billion to USD 2.88 billion at an average YoY growth of 8.6%.
Quick Stats of the Greenwrap Market

  • Market Value (2025): USD 3.1 billion
  • Forecast Value (2035): USD 6.8 billion
  • Forecast CAGR: 8.1%
  • Product Leader in 2025: High-Grade Bubble Wraps (47% market share)
  • Top Distribution Channel: E-commerce & Automotive Logistics
  • Key Growth Region: South Korea (8.2% CAGR, leading globally)
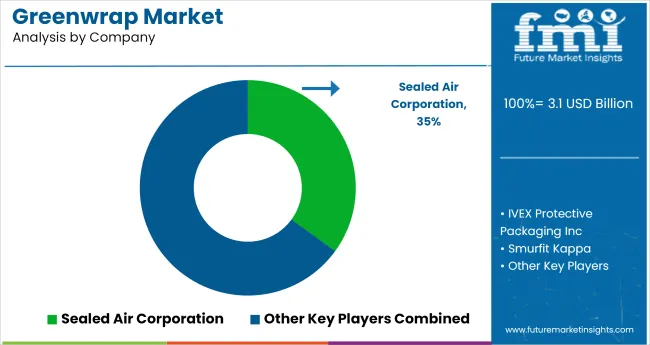
  • Leading Player: Sealed Air Corporation (35% industry share)

Greenwrap Market Market Value Analysis

Metric Value
Market Size in 2025 USD 3.1 billion
Projected Market Size in 2035 USD 6.8 billion
CAGR (2025 to 2035) 8.1%

Early growth was driven by adoption in EV logistics and pharmaceutical cold-chain packaging. In 2021, vaccine transport requirements created a short-term spike, particularly for temperature-controlled variants. Automotive use expanded from 2022 as manufacturers replaced rigid packaging with recyclable insulation wraps. By 2024, stabilization was observed as demand shifted from emergency healthcare logistics to structural packaging needs in e-commerce and electronics.

From 2025 to 2035, steady YoY gains of around 8% are expected through 2034, followed by a 10.9% jump in 2035. Regulatory mandates in the USA, South Korea, and Germany will likely accelerate adoption across sectors. Growth in India is expected to remain gradual due to cost sensitivity, though local wrap production may improve accessibility.

Forecast expansion will rely on integration in food delivery, expansion of cold-chain infrastructure, and compliance with evolving producer responsibility norms across OECD and BRICS economies.

As of 2025, the greenwrap market accounts for an estimated 4-6% share of the global protective packaging market, valued at over USD 55 billion. In the sustainable packaging market is projected at USD 285 billion, greenwrap represents a smaller share of around 1-2%, reflecting the wide range of materials included in that segment.

In the e-commerce packaging market, estimated at USD 78 billion, greenwrap holds a share of approximately 3-4%, driven by growing demand for eco-friendly alternatives. Its presence in the void fill packaging market is more pronounced, at around 7-9%, due to its direct application in that function. In the biodegradable packaging market, which stands at about USD 25 billion, greenwrap comprises roughly 6-8%, reflecting its compostable composition and material profile.

Analysing Greenwrap Market by Top Investment Segments

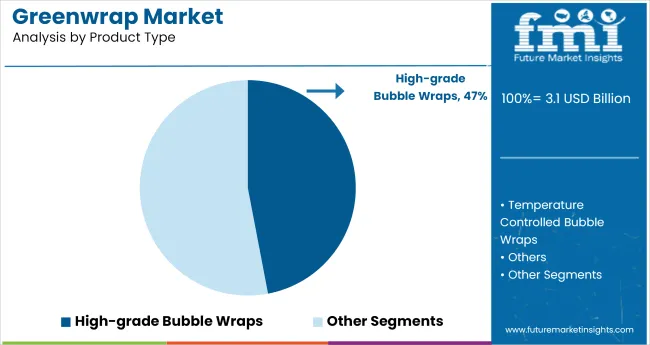
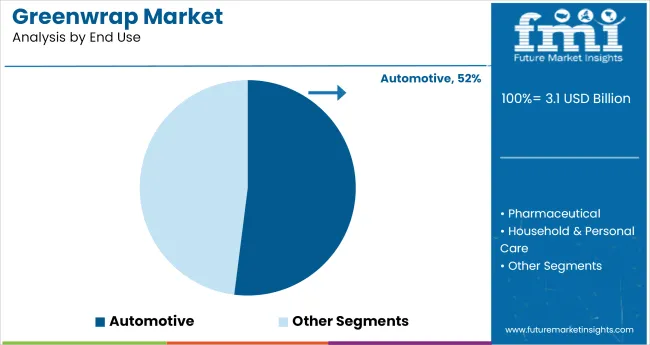
The greenwrap market is growing steadily, supported by increased demand for lightweight, durable, and efficient protective packaging. High-grade bubble wraps lead the product category with 47% market share in 2025, offering enhanced protection for precision items during transit. Among end users, the automotive sector dominates with 52% share, driven by consistent use in component wrapping and cross-border logistics.
High-Grade Bubble Wraps Secure 47% Share in 2025

Greenwrap Market Analysis By Product Type

High-grade bubble wraps are projected to hold 47% of the global bubble wrap packaging market in 2025, reaching a value of USD 1.57 billion. This growth is driven by rising demand for protective packaging across electronics, precision tools, and luxury goods. Between 2020 and 2024, adoption surged due to the expansion of e-commerce, where fragile items required consistent cushioning to minimize damage and returns.
  • Brands preferred high-grade wraps for their anti-static features, uniform bubble structure, and enhanced unboxing aesthetics.
  • Export-driven sectors such as automotive and machinery adopted them to meet strict transit protection standards.
  • Regulatory pressure also pushed firms to consolidate materials, making high-grade wraps a preferred solution for performance, compliance, and presentation.

Automotive Sector to Maintain 52% Market Share In 2025

Greenwrap Market Analysis By End Use

Automotive is projected to account for 52% of greenwrap end-use demand in 2025, sustained by long-term packaging shifts across EV and component logistics. Between 2020 and 2024, OEMs in Germany, South Korea, and the United States gradually replaced rigid foams with recyclable insulation wraps for batteries, sensors, and lightweight body parts.

  • Packaging specifications introduced by EV producers like Tesla and Hyundai favored multi-layer bubble configurations with vibration-dampening properties.
  • Post-2022, tier-1 suppliers aligned with packaging compliance targets across cross-border shipments.
  • From 2025 onward, aftermarket parts logistics and extended producer responsibility mandates are expected to preserve greenwrap’s dominance in automotive transit workflows.

Top Greenwrap Market Dynamics

The greenwrap market is adjusting to shifts in protective packaging demand across perishables, direct-to-consumer shipments, and light electronics. Converter decisions are being shaped by input volatility, volume-to-weight optimization, and wrapping automation feasibility. Material sourcing adjustments and retailer kitting changes are influencing how vendors address breakage reduction, unit throughput, and inbound logistics.

Format Substitution Reducing Void Fill And Labor Hours

E-commerce fulfillment centers in Canada and Spain replaced kraft paper and bubble wrap with die-cut greenwrap for boxed glassware, trimming void fill use by 38% and reducing pack station time per order by 19%. Artisanal food exporters in Chile switched to roll-fed perforated greenwrap sheets for chilled hampers, eliminating the need for inner liners while maintaining damage thresholds on long-haul deliveries.

Boutique cosmetics brands in Australia adopted interleaf dispensers for jar and bottle SKUs under 200 g, which allowed single-operator kitting with no post-wrap taping. USA-based distributors of handmade ceramics noted a 14% drop in breakage claims after transitioning to multi-ply greenwrap structures for regional shipments.

Input Cost Fluctuation and Throughput Adjustments Affect Margin Structure

Between January and June 2025, virgin kraft paper prices rose by 9.6%, while demand for pre-expanded wrap formats pushed film-lamination costs up in select SKUs. Converters in South Korea and India noted input-linked per-roll price increases of USD 0.07-USD 0.11, particularly in multi-color variants.

Subscription box brands in the UK capped unit wrap costs at Q3 2024 levels, forcing vendors to offset losses by adjusting roll widths and sheet thicknesses. Some Chinese producers shifted toward regional pulp blends to moderate input volatility, though early feedback flagged minor elasticity mismatches on automated dispensers. These changes reshaped supply agreements for giftware, pottery, and small-format electronics segments.
Top Countries Manufacturing, Supplying, and Utilizing Greenwrap in Protective Packaging Systems

Greenwrap Market Cagr Analysis By Country

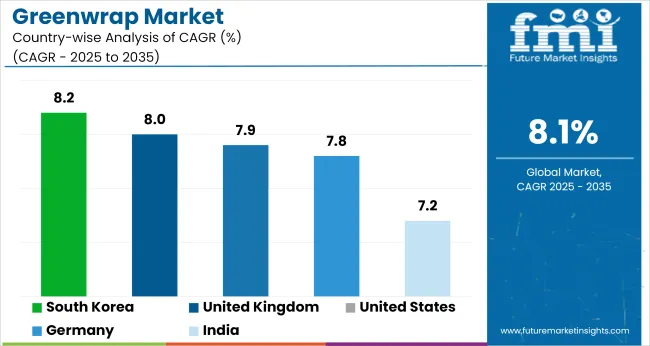
Country CAGR (2025 to 2035)
South Korea 8.2%
United Kingdom 8.0%
United States 7.9%
Germany 7.8%
India 7.2%

The global industry is projected to grow at a CAGR of 8.1% between 2025 and 2035. South Korea (OECD) leads among the profiled countries at 8.2%, just 0.1% above the global rate. The United Kingdom (OECD) closely follows with 8.0% (- 0.1%), while the United States (OECD) posts 7.9% (- 0.2%) and Germany (OECD) reports 7.8% (- 0.3%).

India (BRICS) stands at 7.2%, falling short by 0.9% relative to the global benchmark. These differences reflect levels of integration of fiber-based alternatives in secondary packaging lines. OECD members show near-parallel growth patterns, likely supported by consistent policy frameworks and supplier ecosystems. India’s gap may stem from limited access to compostable barrier wraps at scale, though overall interest remains positive across both groups.

The report covers detailed analysis of 40+ countries, with the top five countries shared as a reference.

Automation Drive High-Performance Adoption in South Korea's Greenwrap Market

In 2025, the greenwrap market in South Korea is projected to reach USD 216.7 million, supported by sustained procurement from EV battery exporters and semiconductor manufacturers. Between 2020 and 2024, market expansion was underpinned by material substitution initiatives targeting non-recyclable fillers.

Firms such as Samsung SDI and LG Chem transitioned to high-grade bubble wraps for cathode and sensor shipments, reinforcing demand stability. Packaging compliance updates in 2021 under Korea’s EPR policy prompted OEMs to formalize greenwrap in outbound logistics workflows.

  • Increase in use of greenwrap for biotech and defense logistics.
  • Cross-sector alignment with EU and USA packaging regulations will remain a critical driver, positioning South Korea as an early adopter of advanced wrap technologies in East Asia.

Policy-Driven Waste Reduction Supports Packaging Conversion in the United Kingdom

The UK greenwrap market, projected to reach approximately USD 217 million in 2025, is expected to maintain an 8% CAGR through 2035. Between 2020 and 2024, the market likely expanded from around USD 140 million to USD 200 million, driven primarily by early shifts in retail and e-commerce packaging. The introduction of the Plastic Packaging Tax in 2022 created a compliance-driven inflection point, prompting large retailers to adopt recyclable alternatives to conventional fillers.
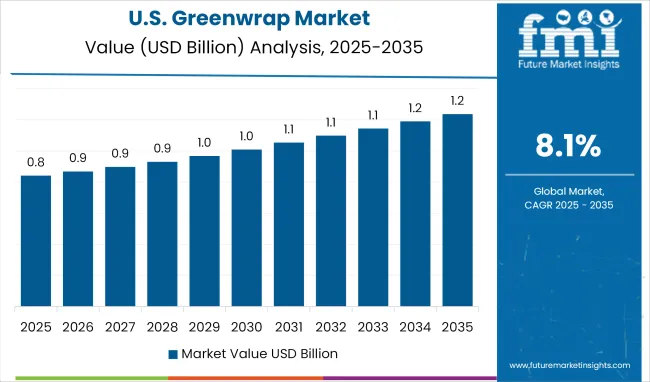
  • In 2025, growth is expected to be broad-based across pharmaceutical, personal care, and grocery logistics.
  • Continued compliance with EU environmental reporting standards, coupled with rising penalties for non-compliant materials, will likely keep packaging strategies under pressure, reinforcing demand for performance-certified greenwrap variants.

High-Volume E-Commerce Fulfillment Accelerates Paper Wrap Use in the United States

Greenwrap Market Country Value Analysis

In 2025, the USA greenwrap market is estimated to grow at 7.9% CAGR through 2035. Growth between 2020 and 2024 was primarily fueled by pharmaceutical distribution networks and the scaling of e-commerce fulfillment centers. The shift to temperature-sensitive packaging during vaccine rollout created long-term demand for insulated wrap formats.

  • Regulatory pressure has remained fragmented at the federal level but aggressive at the state level, especially in California, Washington, and New York.
  • Adoption is expected to accelerate in grocery logistics and third-party fulfillment as procurement policies align with state-level bans on expanded polystyrene and single-use plastic fillers.

Industrial Sectors and Retail Exports Shift Toward Mono-Materials In Germany

  • The market in Germany is expected to grow at a CAGR of 7.8% through 2035. The market was valued at USD 190 million in 2020. The early-stage expansion was tied to reforms under the Verpackungsgesetz (VerpackG), which set stringent packaging reuse and recyclability requirements. Between 2021 and 2024, pharmaceutical and medical device exporters shifted toward recyclable thermal wraps to comply with EU cold-chain packaging directives. Automotive manufacturers, especially those supplying EVs to the EU and China, initiated a transition to compliant, shock-resistant greenwraps in outbound shipments.
  • By 2035, packaging audits under supply chain due diligence laws are expected to further entrench demand for traceable, recyclable protective materials.

SME-Led Transformation Reshapes India’s Protective Packaging Dynamics

The industry in India is forecast to grow at a CAGR of 7.2% from 2025 to 2035, with adoption fueled by government incentives for micro and small enterprises and increasing demand from apparel, food, and handicraft exporters. India’s greenwrap market is projected to reach USD 145 million in 2025, rising from approximately USD 102 million in 2020. Growth remained limited until 2022 due to cost barriers, informal logistics networks, and minimal enforcement of packaging norms.
  • Production Linked Incentive (PLI) schemes supporting bioplastics manufacturing create supply-side incentives for affordable greenwrap production.
  • Post-2022, major e-commerce players and consumer electronics exporters began adopting biodegradable bubble wraps, especially in urban fulfillment hubs.

Leading Greenwrap Manufacturers

Greenwrap Market Analysis By Company

The industry is evolving as key players like Sealed Air Corporation and Smurfit Kappa drive competition through product launches and acquisitions. Sealed Air recently introduced a high-performance protective film for industrial use, while Smurfit Kappa expanded its portfolio by acquiring a European packaging firm. Pregis Corporation opened a new production facility, enhancing its void-fill solutions, and IVEX Protective Packaging invested in R&D to develop stronger lightweight wraps.

Emerging players like Fastpack Packaging are gaining traction with specialized solutions for perishables. Entry barriers include high capital costs for manufacturing and strict material regulations. Established firms benefit from economies of scale, making it tough for new entrants like Eco Packaging International to compete. Recent innovations, such as Pregis’ compostable adhesives, are reshaping industry standards, pushing rivals to accelerate development efforts. Mergers and R&D investments remain key growth strategies

Recent Industry News

  • In March 2024, Dow Inc. introduced a plant-based resin greenwrap film- the first to match conventional plastic durability while being industrially compostable, targeting food and medical packaging.
  • In May 2025, Berry Global secured patents for a self-healing greenwrap film that uses microcapsule technology to automatically repair tears under heat, cutting transit damage by up to 30% in pilot tests with major logistics firm

Leading players

  • Sealed Air Corporation
  • IVEX Protective Packaging Inc
  • Smurfit Kappa
  • Pregis Corporation
  • Barton Jones Packaging Ltd.
  • Fastpack Packaging
  • Cortec Corporation
  • Eco Packaging International Company
  • Dana Poly In

Report Scope of Greenwrap Market

Report Attributes Details
Market Size (2025) USD 3.1 billion
Projected Market Size (2035) USD 6.8 billion
CAGR (2025 to 2035) 8.1%
Base Year for Estimation 2024
Historical Period 2020 to 2024
Projection Period 2025 to 2035
Quantitative Units USD billion (value), million units (volume)
Product Types Analyzed High-Grade Bubble Wraps, Temperature Controlled Bubble Wraps, Others
End-use Industries Analyzed Automotive, Pharmaceutical, Household & Personal Care, E-Commerce, Food & Beverage, Others
Regions Covered North America, Latin America, Western Europe, Eastern Europe, East Asia, South Asia Pacific, Middle East and Africa
Countries Tracked United States, Canada, Germany, United Kingdom, France, China, Japan, India, Brazil, South Africa
Key Companies Profiled Sealed Air Corporation, IVEX Protective Packaging Inc, Smurfit Kappa, Pregis Corporation, Barton Jones Packaging Ltd., Fastpack Packaging, Cortec Corporation, Eco Packaging International Company, Dana Poly Inc
Additional Attributes Dollar sales, share by end-use vertical and product innovation, strong demand from e-commerce and personal care segments, regulatory preference for biodegradable formats, growing investments in temperature-controlled protective wrap, regional sourcing opportunities and local production hubs

Key Segmentation

By Product Type:

  • High-Grade Bubble Wraps
  • Temperature Controlled Bubble Wraps
  • Others

By End-use:

  • Automotive
  • Pharmaceutical
  • Household & Personal Care
  • E-Commerce
  • Food & beverage
  • Others

By Region:

  • North America
  • Latin America
  • Western Europe
  • Eastern Europe
  • East Asia
  • South Asia Pacific
  • Middle East and Africa

Table of Content

  1. Executive Summary
    • Global Market Outlook
    • Demand-side Trends
    • Supply-side Trends
    • Technology Roadmap Analysis
    • Analysis and Recommendations
  2. Market Overview
    • Market Coverage / Taxonomy
    • Market Definition / Scope / Limitations
  3. Market Background
    • Market Dynamics
      • Drivers
      • Restraints
      • Opportunity
      • Trends
    • Scenario Forecast
      • Demand in Optimistic Scenario
      • Demand in Likely Scenario
      • Demand in Conservative Scenario
    • Opportunity Map Analysis
    • Product Life Cycle Analysis
    • Supply Chain Analysis
      • Supply Side Participants and their Roles
        • Producers
        • Mid-Level Participants (Traders/ Agents/ Brokers)
        • Wholesalers and Distributors
      • Value Added and Value Created at Node in the Supply Chain
      • List of Raw Material Suppliers
      • List of Existing and Potential Buyer’s
    • Investment Feasibility Matrix
    • Value Chain Analysis
      • Profit Margin Analysis
      • Wholesalers and Distributors
      • Retailers
    • PESTLE and Porter’s Analysis
    • Regulatory Landscape
      • By Key Regions
      • By Key Countries
    • Regional Parent Market Outlook
    • Production and Consumption Statistics
    • Import and Export Statistics
  4. Global Market Analysis 2020 to 2024 and Forecast, 2025 to 2035
    • Historical Market Size Value (USD Billion) & Volume (KT) Analysis, 2020 to 2024
    • Current and Future Market Size Value (USD Billion) & Volume (KT) Projections, 2025 to 2035
      • Y-o-Y Growth Trend Analysis
      • Absolute $ Opportunity Analysis
  5. Global Market Pricing Analysis 2020 to 2024 and Forecast 2025 to 2035
  6. Global Market Analysis 2020 to 2024 and Forecast 2025 to 2035, By Product Type
    • Introduction / Key Findings
    • Historical Market Size Value (USD Billion) & Volume (KT) Analysis By Product Type, 2020 to 2024
    • Current and Future Market Size Value (USD Billion) & Volume (KT) Analysis and Forecast By Product Type, 2025 to 2035
      • High-Grade Bubble Wraps
      • Temperature Controlled Bubble Wraps
      • Others
    • Y-o-Y Growth Trend Analysis By Product Type, 2020 to 2024
    • Absolute $ Opportunity Analysis By Product Type, 2025 to 2035
  7. Global Market Analysis 2020 to 2024 and Forecast 2025 to 2035, By End-use
    • Introduction / Key Findings
    • Historical Market Size Value (USD Billion) & Volume (KT) Analysis By End-use, 2020 to 2024
    • Current and Future Market Size Value (USD Billion) & Volume (KT) Analysis and Forecast By End-use, 2025 to 2035
      • Automotive
      • Pharmaceutical
      • Household & Personal Care
      • E-Commerce
      • Food & beverage
      • Others
    • Y-o-Y Growth Trend Analysis By End-use, 2020 to 2024
    • Absolute $ Opportunity Analysis By End-use, 2025 to 2035
  8. Global Market Analysis 2020 to 2024 and Forecast 2025 to 2035, By Region
    • Introduction
    • Historical Market Size Value (USD Billion) & Volume (KT) Analysis By Region, 2020 to 2024
    • Current Market Size Value (USD Billion) & Volume (KT) Analysis and Forecast By Region, 2025 to 2035
      • North America
      • Latin America
      • Western Europe
      • Eastern Europe
      • East Asia
      • South Asia & Pacific
      • Middle East and Africa
    • Market Attractiveness Analysis By Region
  9. North America Market Analysis 2020 to 2024 and Forecast 2025 to 2035, By Country
    • Historical Market Size Value (USD Billion) & Volume (KT) Trend Analysis By Market Taxonomy, 2020 to 2024
    • Market Size Value (USD Billion) & Volume (KT) Forecast By Market Taxonomy, 2025 to 2035
      • By Country
        • USA
        • Canada
        • Mexico
      • By Product Type
      • By End-use
    • Market Attractiveness Analysis
      • By Country
      • By Product Type
      • By End-use
    • Key Takeaways
  10. Latin America Market Analysis 2020 to 2024 and Forecast 2025 to 2035, By Country
    • Historical Market Size Value (USD Billion) & Volume (KT) Trend Analysis By Market Taxonomy, 2020 to 2024
    • Market Size Value (USD Billion) & Volume (KT) Forecast By Market Taxonomy, 2025 to 2035
      • By Country
        • Brazil
        • Argentina
        • Rest of LATAM
      • By Product Type
      • By End-use
    • Market Attractiveness Analysis
      • By Country
      • By Product Type
      • By End-use
    • Key Takeaways
  11. Western Europe Market Analysis 2020 to 2024 and Forecast 2025 to 2035, By Country
    • Historical Market Size Value (USD Billion) & Volume (KT) Trend Analysis By Market Taxonomy, 2020 to 2024
    • Market Size Value (USD Billion) & Volume (KT) Forecast By Market Taxonomy, 2025 to 2035
      • By Country
        • Germany
        • Italy
        • France
        • UK
        • Spain
        • BENELUX
        • Nordic
        • Rest of W.Europe
      • By Product Type
      • By End-use
    • Market Attractiveness Analysis
      • By Country
      • By Product Type
      • By End-use
    • Key Takeaways
  12. Eastern Europe Market Analysis 2020 to 2024 and Forecast 2025 to 2035, By Country
    • Historical Market Size Value (USD Billion) & Volume (KT) Trend Analysis By Market Taxonomy, 2020 to 2024
    • Market Size Value (USD Billion) & Volume (KT) Forecast By Market Taxonomy, 2025 to 2035
      • By Country
        • Russia
        • Hungary
        • Poland
        • Balkan & Baltics
        • Rest of E. Europe
      • By Product Type
      • By End-use
    • Market Attractiveness Analysis
      • By Country
      • By Product Type
      • By End-use
    • Key Takeaways
  13. East Asia Market Analysis 2020 to 2024 and Forecast 2025 to 2035, By Country
    • Historical Market Size Value (USD Billion) & Volume (KT) Trend Analysis By Market Taxonomy, 2020 to 2024
    • Market Size Value (USD Billion) & Volume (KT) Forecast By Market Taxonomy, 2025 to 2035
      • By Country
        • China
        • Japan
        • South Korea
      • By Product Type
      • By End-use
    • Market Attractiveness Analysis
      • By Country
      • By Product Type
      • By End-use
    • Key Takeaways
  14. South Asia & Pacific Market Analysis 2020 to 2024 and Forecast 2025 to 2035, By Country
    • Historical Market Size Value (USD Billion) & Volume (KT) Trend Analysis By Market Taxonomy, 2020 to 2024
    • Market Size Value (USD Billion) & Volume (KT) Forecast By Market Taxonomy, 2025 to 2035
      • By Country
        • India
        • Australia & New Zealand
        • ASEAN
        • Rest of SAP
      • By Product Type
      • By End-use
    • Market Attractiveness Analysis
      • By Country
      • By Product Type
      • By End-use
    • Key Takeaways
  15. Middle East and Africa Market Analysis 2020 to 2024 and Forecast 2025 to 2035, By Country
    • Historical Market Size Value (USD Billion) & Volume (KT) Trend Analysis By Market Taxonomy, 2020 to 2024
    • Market Size Value (USD Billion) & Volume (KT) Forecast By Market Taxonomy, 2025 to 2035
      • By Country
        • GCC Countries
        • Northern Africa
        • South Africa
        • Turkiye
        • Rest of MEA
      • By Product Type
      • By End-use
    • Market Attractiveness Analysis
      • By Country
      • By Product Type
      • By End-use
    • Key Takeaways
  16. Key Countries Market Analysis
    • USA
      • Pricing Analysis
      • Market Share Analysis, 2024
        • By Product Type
        • By End-use
    • Canada
      • Pricing Analysis
      • Market Share Analysis, 2024
        • By Product Type
        • By End-use
    • Brazil
      • Pricing Analysis
      • Market Share Analysis, 2024
        • By Product Type
        • By End-use
    • Mexico
      • Pricing Analysis
      • Market Share Analysis, 2024
        • By Product Type
        • By End-use
    • Argentina
      • Pricing Analysis
      • Market Share Analysis, 2024
        • By Product Type
        • By End-use
  17. Market Structure Analysis
    • Competition Dashboard
    • Competition Benchmarking
    • Market Share Analysis of Top Players
      • By Regional
      • By Product Type
      • By End-use
  18. Competition Analysis
    • Competition Deep Dive
      • Sealed Air Corporation
        • Overview
        • Product Portfolio
        • Profitability by Market Segments (Product/Age /Sales Channel/Region)
        • Sales Footprint
        • Strategy Overview
          • Marketing Strategy
          • Product Strategy
          • Channel Strategy
      • IVEX Protective Packaging Inc
        • Overview
        • Product Portfolio
        • Profitability by Market Segments (Product/Age /Sales Channel/Region)
        • Sales Footprint
        • Strategy Overview
          • Marketing Strategy
          • Product Strategy
          • Channel Strategy
      • Smurfit Kappa
        • Overview
        • Product Portfolio
        • Profitability by Market Segments (Product/Age /Sales Channel/Region)
        • Sales Footprint
        • Strategy Overview
          • Marketing Strategy
          • Product Strategy
          • Channel Strategy
      • Pregis Corporation
        • Overview
        • Product Portfolio
        • Profitability by Market Segments (Product/Age /Sales Channel/Region)
        • Sales Footprint
        • Strategy Overview
          • Marketing Strategy
          • Product Strategy
          • Channel Strategy
      • Barton Jones Packaging Ltd.
        • Overview
        • Product Portfolio
        • Profitability by Market Segments (Product/Age /Sales Channel/Region)
        • Sales Footprint
        • Strategy Overview
          • Marketing Strategy
          • Product Strategy
          • Channel Strategy
      • Fastpack Packaging
        • Overview
        • Product Portfolio
        • Profitability by Market Segments (Product/Age /Sales Channel/Region)
        • Sales Footprint
        • Strategy Overview
          • Marketing Strategy
          • Product Strategy
          • Channel Strategy
      • Cortec Corporation
        • Overview
        • Product Portfolio
        • Profitability by Market Segments (Product/Age /Sales Channel/Region)
        • Sales Footprint
        • Strategy Overview
          • Marketing Strategy
          • Product Strategy
          • Channel Strategy
      • Eco Packaging International Company
        • Overview
        • Product Portfolio
        • Profitability by Market Segments (Product/Age /Sales Channel/Region)
        • Sales Footprint
        • Strategy Overview
          • Marketing Strategy
          • Product Strategy
          • Channel Strategy
      • Dana Poly In
        • Overview
        • Product Portfolio
        • Profitability by Market Segments (Product/Age /Sales Channel/Region)
        • Sales Footprint
        • Strategy Overview
          • Marketing Strategy
          • Product Strategy
          • Channel Strategy
  19. Assumptions & Acronyms Used
  20. Research Methodology

List of Tables

  • Table 1: Global Market Value (USD Billion) Forecast by Region, 2020-2035
  • Table 2: Global Market Volume (KT) Forecast by Region, 2020-2035
  • Table 3: Global Market Value (USD Billion) Forecast by Product Type, 2020-2035
  • Table 4: Global Market Volume (KT) Forecast by Product Type, 2020-2035
  • Table 5: Global Market Value (USD Billion) Forecast by End-use, 2020-2035
  • Table 6: Global Market Volume (KT) Forecast by End-use, 2020-2035
  • Table 7: North America Market Value (USD Billion) Forecast by Country, 2020-2035
  • Table 8: North America Market Volume (KT) Forecast by Country, 2020-2035
  • Table 9: North America Market Value (USD Billion) Forecast by Product Type, 2020-2035
  • Table 10: North America Market Volume (KT) Forecast by Product Type, 2020-2035
  • Table 11: North America Market Value (USD Billion) Forecast by End-use, 2020-2035
  • Table 12: North America Market Volume (KT) Forecast by End-use, 2020-2035
  • Table 13: Latin America Market Value (USD Billion) Forecast by Country, 2020-2035
  • Table 14: Latin America Market Volume (KT) Forecast by Country, 2020-2035
  • Table 15: Latin America Market Value (USD Billion) Forecast by Product Type, 2020-2035
  • Table 16: Latin America Market Volume (KT) Forecast by Product Type, 2020-2035
  • Table 17: Latin America Market Value (USD Billion) Forecast by End-use, 2020-2035
  • Table 18: Latin America Market Volume (KT) Forecast by End-use, 2020-2035
  • Table 19: Western Europe Market Value (USD Billion) Forecast by Country, 2020-2035
  • Table 20: Western Europe Market Volume (KT) Forecast by Country, 2020-2035
  • Table 21: Western Europe Market Value (USD Billion) Forecast by Product Type, 2020-2035
  • Table 22: Western Europe Market Volume (KT) Forecast by Product Type, 2020-2035
  • Table 23: Western Europe Market Value (USD Billion) Forecast by End-use, 2020-2035
  • Table 24: Western Europe Market Volume (KT) Forecast by End-use, 2020-2035
  • Table 25: Eastern Europe Market Value (USD Billion) Forecast by Country, 2020-2035
  • Table 26: Eastern Europe Market Volume (KT) Forecast by Country, 2020-2035
  • Table 27: Eastern Europe Market Value (USD Billion) Forecast by Product Type, 2020-2035
  • Table 28: Eastern Europe Market Volume (KT) Forecast by Product Type, 2020-2035
  • Table 29: Eastern Europe Market Value (USD Billion) Forecast by End-use, 2020-2035
  • Table 30: Eastern Europe Market Volume (KT) Forecast by End-use, 2020-2035
  • Table 31: East Asia Market Value (USD Billion) Forecast by Country, 2020-2035
  • Table 32: East Asia Market Volume (KT) Forecast by Country, 2020-2035
  • Table 33: East Asia Market Value (USD Billion) Forecast by Product Type, 2020-2035
  • Table 34: East Asia Market Volume (KT) Forecast by Product Type, 2020-2035
  • Table 35: East Asia Market Value (USD Billion) Forecast by End-use, 2020-2035
  • Table 36: East Asia Market Volume (KT) Forecast by End-use, 2020-2035
  • Table 37: South Asia & Pacific Market Value (USD Billion) Forecast by Country, 2020-2035
  • Table 38: South Asia & Pacific Market Volume (KT) Forecast by Country, 2020-2035
  • Table 39: South Asia & Pacific Market Value (USD Billion) Forecast by Product Type, 2020-2035
  • Table 40: South Asia & Pacific Market Volume (KT) Forecast by Product Type, 2020-2035
  • Table 41: South Asia & Pacific Market Value (USD Billion) Forecast by End-use, 2020-2035
  • Table 42: South Asia & Pacific Market Volume (KT) Forecast by End-use, 2020-2035
  • Table 43: Middle East and Africa Market Value (USD Billion) Forecast by Country, 2020-2035
  • Table 44: Middle East and Africa Market Volume (KT) Forecast by Country, 2020-2035
  • Table 45: Middle East and Africa Market Value (USD Billion) Forecast by Product Type, 2020-2035
  • Table 46: Middle East and Africa Market Volume (KT) Forecast by Product Type, 2020-2035
  • Table 47: Middle East and Africa Market Value (USD Billion) Forecast by End-use, 2020-2035
  • Table 48: Middle East and Africa Market Volume (KT) Forecast by End-use, 2020-2035

List of Figures

  • Figure 1: Global Market Volume (KT) Forecast 2020-2035
  • Figure 2: Global Market Pricing Analysis
  • Figure 3: Global Market Value (USD Billion) Forecast 2020-2035
  • Figure 4: Global Market Value Share and BPS Analysis by Product Type, 2025 and 2035
  • Figure 5: Global Market Y-o-Y Growth Comparison by Product Type, 2025-2035
  • Figure 6: Global Market Attractiveness Analysis by Product Type
  • Figure 7: Global Market Value Share and BPS Analysis by End-use, 2025 and 2035
  • Figure 8: Global Market Y-o-Y Growth Comparison by End-use, 2025-2035
  • Figure 9: Global Market Attractiveness Analysis by End-use
  • Figure 10: Global Market Value (USD Billion) Share and BPS Analysis by Region, 2025 and 2035
  • Figure 11: Global Market Y-o-Y Growth Comparison by Region, 2025-2035
  • Figure 12: Global Market Attractiveness Analysis by Region
  • Figure 13: North America Market Incremental $ Opportunity, 2025-2035
  • Figure 14: Latin America Market Incremental $ Opportunity, 2025-2035
  • Figure 15: Western Europe Market Incremental $ Opportunity, 2025-2035
  • Figure 16: Eastern Europe Market Incremental $ Opportunity, 2025-2035
  • Figure 17: East Asia Market Incremental $ Opportunity, 2025-2035
  • Figure 18: South Asia & Pacific Market Incremental $ Opportunity, 2025-2035
  • Figure 19: Middle East and Africa Market Incremental $ Opportunity, 2025-2035
  • Figure 20: North America Market Value Share and BPS Analysis by Country, 2025 and 2035
  • Figure 21: North America Market Value Share and BPS Analysis by Product Type, 2025 and 2035
  • Figure 22: North America Market Y-o-Y Growth Comparison by Product Type, 2025-2035
  • Figure 23: North America Market Attractiveness Analysis by Product Type
  • Figure 24: North America Market Value Share and BPS Analysis by End-use, 2025 and 2035
  • Figure 25: North America Market Y-o-Y Growth Comparison by End-use, 2025-2035
  • Figure 26: North America Market Attractiveness Analysis by End-use
  • Figure 27: Latin America Market Value Share and BPS Analysis by Country, 2025 and 2035
  • Figure 28: Latin America Market Value Share and BPS Analysis by Product Type, 2025 and 2035
  • Figure 29: Latin America Market Y-o-Y Growth Comparison by Product Type, 2025-2035
  • Figure 30: Latin America Market Attractiveness Analysis by Product Type
  • Figure 31: Latin America Market Value Share and BPS Analysis by End-use, 2025 and 2035
  • Figure 32: Latin America Market Y-o-Y Growth Comparison by End-use, 2025-2035
  • Figure 33: Latin America Market Attractiveness Analysis by End-use
  • Figure 34: Western Europe Market Value Share and BPS Analysis by Country, 2025 and 2035
  • Figure 35: Western Europe Market Value Share and BPS Analysis by Product Type, 2025 and 2035
  • Figure 36: Western Europe Market Y-o-Y Growth Comparison by Product Type, 2025-2035
  • Figure 37: Western Europe Market Attractiveness Analysis by Product Type
  • Figure 38: Western Europe Market Value Share and BPS Analysis by End-use, 2025 and 2035
  • Figure 39: Western Europe Market Y-o-Y Growth Comparison by End-use, 2025-2035
  • Figure 40: Western Europe Market Attractiveness Analysis by End-use
  • Figure 41: Eastern Europe Market Value Share and BPS Analysis by Country, 2025 and 2035
  • Figure 42: Eastern Europe Market Value Share and BPS Analysis by Product Type, 2025 and 2035
  • Figure 43: Eastern Europe Market Y-o-Y Growth Comparison by Product Type, 2025-2035
  • Figure 44: Eastern Europe Market Attractiveness Analysis by Product Type
  • Figure 45: Eastern Europe Market Value Share and BPS Analysis by End-use, 2025 and 2035
  • Figure 46: Eastern Europe Market Y-o-Y Growth Comparison by End-use, 2025-2035
  • Figure 47: Eastern Europe Market Attractiveness Analysis by End-use
  • Figure 48: East Asia Market Value Share and BPS Analysis by Country, 2025 and 2035
  • Figure 49: East Asia Market Value Share and BPS Analysis by Product Type, 2025 and 2035
  • Figure 50: East Asia Market Y-o-Y Growth Comparison by Product Type, 2025-2035
  • Figure 51: East Asia Market Attractiveness Analysis by Product Type
  • Figure 52: East Asia Market Value Share and BPS Analysis by End-use, 2025 and 2035
  • Figure 53: East Asia Market Y-o-Y Growth Comparison by End-use, 2025-2035
  • Figure 54: East Asia Market Attractiveness Analysis by End-use
  • Figure 55: South Asia & Pacific Market Value Share and BPS Analysis by Country, 2025 and 2035
  • Figure 56: South Asia & Pacific Market Value Share and BPS Analysis by Product Type, 2025 and 2035
  • Figure 57: South Asia & Pacific Market Y-o-Y Growth Comparison by Product Type, 2025-2035
  • Figure 58: South Asia & Pacific Market Attractiveness Analysis by Product Type
  • Figure 59: South Asia & Pacific Market Value Share and BPS Analysis by End-use, 2025 and 2035
  • Figure 60: South Asia & Pacific Market Y-o-Y Growth Comparison by End-use, 2025-2035
  • Figure 61: South Asia & Pacific Market Attractiveness Analysis by End-use
  • Figure 62: Middle East and Africa Market Value Share and BPS Analysis by Country, 2025 and 2035
  • Figure 63: Middle East and Africa Market Value Share and BPS Analysis by Product Type, 2025 and 2035
  • Figure 64: Middle East and Africa Market Y-o-Y Growth Comparison by Product Type, 2025-2035
  • Figure 65: Middle East and Africa Market Attractiveness Analysis by Product Type
  • Figure 66: Middle East and Africa Market Value Share and BPS Analysis by End-use, 2025 and 2035
  • Figure 67: Middle East and Africa Market Y-o-Y Growth Comparison by End-use, 2025-2035
  • Figure 68: Middle East and Africa Market Attractiveness Analysis by End-use
  • Figure 69: Global Market - Tier Structure Analysis
  • Figure 70: Global Market - Company Share Analysis

Frequently Asked Questions

What is the expected market size of greenwrap by 2035?

The industry is projected to reach USD 6.8 billion by 2035, up from USD 3.1 billion in 2025.

Which product type leads the market in 2025?

High-grade bubble wraps hold a 47% market share as the top product type in 2025.

How much of the market does the automotive sector represent?

Automotive accounts for 52% of greenwrap end-use demand in 2025.

Which country has the highest CAGR in the forecast period?

South Korea leads with a CAGR of 8.2% from 2025 to 2035.

Who is the leading company in the greenwrap market?

Sealed Air Corporation holds the top position with a 35% industry share as of 2025.

Future Market Insights

Greenwrap Market