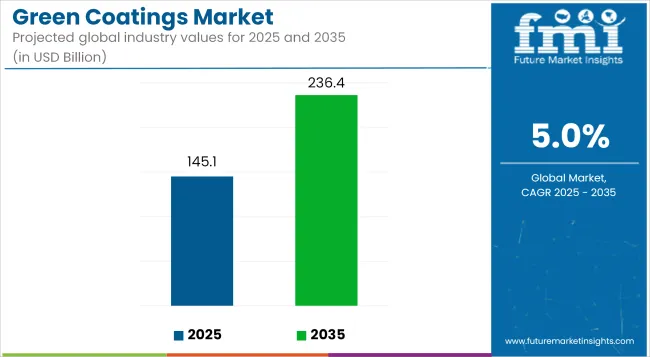
The global green coatings market is anticipated to be valued at USD 145.05 billion in 2025 and is projected to reach USD 236.39 billion by 2035, reflecting a compound annual growth rate (CAGR) of 5.0% during the forecast period. Growth is being supported by increasingly stringent environmental regulations and industry-wide sustainability initiatives across construction, automotive, and general manufacturing sectors.

| Metric | Value |
|---|---|
| Estimated Market Size in 2025 | USD 145.05 Billion |
| Projected Market Size in 2035 | USD 236.39 Billion |
| CAGR (2025 to 2035) | 5.0% |
Green coatings, which include low-VOC, zero-VOC, waterborne, powder, and UV-cured formulations, are being adopted as regulatory frameworks tighten across regions. Demand has been rising in response to compliance requirements under environmental standards such as the U.S. Environmental Protection Agency (EPA) regulations and the European Union’s REACH directives. In construction and architectural applications, adoption is being encouraged by certification systems including LEED and BREEAM, where coatings with minimal environmental impact contribute to scoring criteria.
In the Asia-Pacific region, strong adoption rates are being observed, particularly in China and India. Urbanization, coupled with national sustainability programs, has led to increased application of environmentally compliant coating systems in residential, commercial, and infrastructure projects. In North America and Europe, green building codes and low-emission construction practices are supporting the uptake of bio-based and recyclable coating products.
Advancements in resin chemistry and formulation techniques have improved the durability, drying time, and substrate compatibility of green coatings. Innovations in bio-acrylic, alkyd, and polyurethane resins are enhancing the performance of waterborne and powder coatings, making them suitable for industrial-scale deployment. In the packaging sector, interest has grown in recyclable and compostable coatings designed for food-contact safety and circular material recovery.
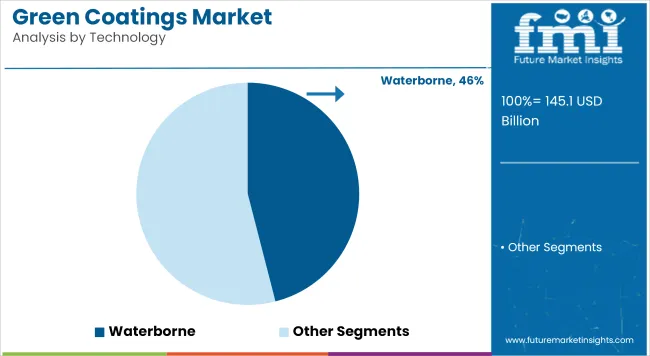
The waterborne technology segment is projected to account for approximately 46% of the global green coatings market share in 2025 and is forecast to grow at a CAGR of 5.1% through 2035. These coatings use water as the primary solvent, significantly reducing volatile organic compound (VOC) emissions compared to solvent-based formulations.
Waterborne systems are increasingly preferred in architectural and general industrial applications due to their environmental benefits, ease of application, and cost-effectiveness. As global environmental standards become stricter, particularly across North America and Europe, demand for waterborne coatings is expected to remain strong across both OEM and maintenance applications.

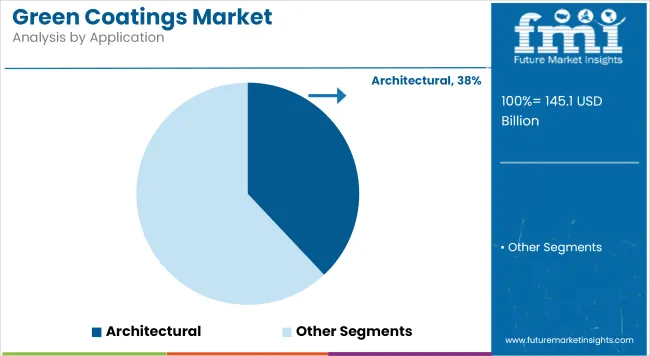
The architectural segment is estimated to hold approximately 38% of the global green coatings market share in 2025 and is projected to grow at a CAGR of 5.2% through 2035. Green coatings used in residential and commercial buildings are formulated to improve indoor air quality, reduce energy consumption, and meet eco-labeling standards.
Increasing investment in green buildings and LEED-certified construction is supporting the adoption of low-emission and energy-efficient paint systems. With ongoing urbanization and retrofitting of existing infrastructure, especially in Asia-Pacific and Western Europe, the use of environmentally friendly coatings in walls, façades, and roofing applications is expected to rise steadily.

FMI conducted a survey of representatives from the major green coatings industry stakeholders such as manufacturers, suppliers, end-users, and regulators. The result revealed that there was an industry-wide movement toward sustainability with more than 70% of respondents noting that regulatory requirements and environmental factors were the principal movers toward adoption.
In terms of driving force, construction and automotive sectors emerged as the leading early adopters, with industries actively pursuing low-VOC, waterborne, and powder-based alternatives to fulfil the constantly changing standards.
On the other hand, the trade-offs in cost versus performance still remain as the greatest challenge. Nearly 60% of the respondents cited increased initial costs as a barrier to mass acceptance, especially by small and medium enterprises (SMEs).
Long-term benefits such as lower maintenance costs, longevity, and the ability to satisfy green certification criteria were, however, seen as significant advantages. In addition, R&D investments in bio-based resins and advanced curing technologies were considered vital to close the gap between cost and performance.
Demand for customized solutions was also mentioned by participants as a growing trend. Over 50% of respondents stated that application-specific coatings were required, particularly in specialty markets such as aerospace, electronics, and healthcare.
Manufacturers are actively focusing on formulating coatings with enhanced adhesion, UV resistance, and antimicrobial properties to respond to this evolving consumer need. Stakeholders also envision cooperation throughout the value chain: partnerships with raw material suppliers and regulatory agencies to help foster innovation.
In the future, industry analysts predict a faster demand to emanate from developing economies, as consumer awareness, and government policies, continue to become more robust on environmentally friendly coatings.
More than 80% of respondents expect significant sector growth within the next five years. With sustainability increasingly determining purchasing decisions, the industry is ripe for speedy innovation and significant investment in greener alternatives.
Governments worldwide are enforcing stringent regulations and certifications to reduce the environmental impact of coatings. These policies center on the regulation of volatile organic compounds (VOCs), encouraging sustainable products, and achieving eco-friendly standards. Consequently, manufacturers are becoming more inclined towards using low-VOC, waterborne, and bio-based paints to satisfy changing regulatory demands.
| Countries/Region | Regulations & Certifications Impacting the Industry |
|---|---|
| United States | EPA's National Volatile Organic Compound Emission Standards, LEED certification for green buildings, and Green Seal Standards (GS-11) for paints and coatings. More stringent VOC limits are pushing the transition to waterborne and powder coatings. |
| European Union | REACH restricts dangerous chemicals in coatings; Ecolabel Certification encourages low-VOC coatings, Directive 2004/42/EC (Paints Directive) caps solvent-based coatings, fueling demand for eco-friendly alternatives. |
| China | GB 18582 to 2020 imposes VOC limits on interior coatings. China Environmental Labelling (Ten Rings Certification) encourages green coatings, and more stringent MIIT regulations are driving high-VOC paints out of business. |
| India | Additionally, it is mentioned in Indian Standards 101 of Bureau of Indian Standards (BIS) for green coating standards as well as Swachh Bharat Abhiyan and Smart Cities Mission government policies as they contribute to sustainable coatings regarding construction projects. |
| Japan | JIS K 5663 Standard sets VOC limitations, and Japan Eco Mark Certification promotes environmental-friendly coatings. The Tokyo Metropolitan Government has stringent air pollution control laws, and low-VOC systems are preferable. |
| South Korea | K-REACH (Korean REACH) harmonizes with EU REACH legislation to control harmful substances, and Ecolabel Certification encourages sustainability. Seoul's Clean Air Policy has strengthened restrictions on solvent-based coatings. |
| Canada | Canadian Environmental Protection Act (CEPA) and VOC Concentration Limits for Architectural Coatings Regulations enforce stringent regulations on toxic emissions, stimulating demand for waterborne and bio-based coatings. |
| Australia | Green Star Certification by the Green Building Council of Australia stimulates the application of low-VOC coatings, while National Pollutant Inventory (NPI) guidelines manage hazardous emissions during coatings production. |
EPA Regulations, Climate Policies and bio-based resin innovations driving the landscape
The USA is projected to grow at a CAGR of 5.4% from 2025 to 2035, driven by EPA regulations and increasing adoption of LEED-certified buildings. Strict VOC limits are pushing the use of waterborne, powder, and UV-cured coatings in the construction and automotive sectors.
Demand is also being strengthened by the Biden administration's climate policies and the shift toward bio-based coatings in EV manufacturing. Self-healing and bio-based resin innovations are gaining traction, although they are still hindered by high costs. R&D investments for the development of cost-effective formulations will be the key to elevating their acceptance in residential and commercial applications.
Green Building Regulations and VOC Restrictions Fueling Industry Expansion
The UK is anticipated to grow at a CAGR of 5.2% from 2025 to 2035, supported by Net Zero 2050 policies and VOC reduction mandates. Compliance with BS EN 13300 and REACH regulations is accelerating the shift toward low-emission coatings-the rise of BREEAM-certified buildings and growth in EV production fuel industry expansion.
Nevertheless, the trade barriers arising from Brexit could restrain the supplies of raw materials. As of the present, increased consumption of waterborne and bio-based coatings is witnessed. While the automotive and construction sectors lead the uptake in this regard, innovation in high-performance, non-toxic coatings is anticipated to significantly raise the adoption levels within the industry.
Eco-Labeled Coatings and Sustainable Construction Driving Demand
France is forecasted to grow at a CAGR of 5.1% during the period 2025 to 2035, also backed by the presence of tough VOC regulations and HQE certification for construction. The Energy Transition Law involves eco-labeling, hence driving demand for low-emission coatings for residential and commercial purposes.
Industry leaders like Renault and Airbus are adopting bio-based and waterborne coatings to meet EU sustainability objectives. Nanotechnology and antimicrobial coatings are becoming more established in the healthcare and transport sectors. However, high production costs are an obstacle for SMEs; government incentives and investments in R&D should nevertheless offer long-term growth.
Automotive Innovations and REACH Compliance Boosting Industry Growth
Germany is expected to grow at a CAGR of 5.3% from 2025 to 2035, driven by stringent VOC regulations under REACH and rising industrial demand. The automotive sector, led by Volkswagen, BMW, and Mercedes-Benz, is shifting its focus toward bio-based coatings to achieve EU carbon reduction targets.
Ecolabel and DGNB certification is promoting the idea of sustainable coatings in infrastructure projects. Investment in UV-cured and smart coatings is growing; however, high R&D costs are proving to be a stumbling block. Demand for energy-efficient, low-carbon coatings is growing in construction and industrial applications, expanding industry opportunities.
Sustainable Restoration and Luxury Furniture Industries Creating Opportunities
Italy is forecasted to expand at a CAGR of 5% from 2025 to 2035, fueled by EcoLabel certification and strict VOC emission controls. The sector that focuses on heritage restoration is fostering demand for enduring, green coatings. Luxury furniture and automobile manufacturers are adopting biotechnology-based solutions for sustainability and aesthetics.
The barriers include high production costs and lack of consumer awareness. The Ecobonus, a scheme sponsored by the government, has a potential to influence residential adoption, whereas R&D in high-performance coatings will provide new growth opportunities for architectural and industrial applications.
Stringent VOC Regulations and Smart Coatings Advancements Driving Industry Growth
South Korea's industry is expected to grow at a CAGR of 5.3% from 2025 to 2035, driven by K-REACH regulations and the Clean Air Policy of Seoul. The automotive and electronics are leading sectors, with players such as Hyundai and Samsung presently investing in low VOC and high-performance coatings.
Smart coatings with self-cleaning and anti-fouling properties are gaining traction in the marine and aerospace industries. Eco-friendly coatings are being pursued for infrastructure thorough Green Remodeling Projects supported by the government. Even with high production costs, nanotechnology-based coatings and antimicrobial coatings, through the advent of better technologies, are expected to spur growth in the industry.
Technological Innovations and Low-VOC Mandates Accelerating Growth
Japan is forecasted to grow at a CAGR of 5.1% from 2025 to 2035 on account of stringent regulations regarding VOCs and advanced technology for coatings. There are low-VOC, waterborne, ultraviolet-cured coatings that the JIS K 5663 standard and Japan Eco Mark Certification mandate for different industries.
Because of that, all the major industries like automotive and electronics are now focusing on investing in nanotechnology-based coatings, especially for durability and eco-friendliness. Energy-efficient applications for construction and infrastructure projects are also related to those zero-carbon policies being pushed in Japan. Although these coatings have some high production costs, hence more R&D is being done on self-cleaning and smart coatings, the challenge remains.
Government Policies and Industrial Shifts Driving Large-Scale Adoption
China is forecasted to expand at a CAGR of 5.6% from 2025 to 2035, fueled by strict VOC regulations and rapid industrialization. The GB 18582 to 2020 regulations and China Environmental Labelling facilitate the application of green coatings. Main growth drivers are both construction and EV sectors, enhanced by urban densification and carbon neutrality goals that accelerate the consumption of eco-friendly paints.
In addition, sectors such as marine and aerospace are adopting powder and bio-based coatings. Despite challenges such as regulatory gaps and raw material price fluctuations, innovations in graphene-enhanced coatings are expected to create new growth opportunities.
Eco-Certifications and Renewable Construction Trends Boosting Industry Expansion
Australia and New Zealand are projected to grow at a CAGR of 5.2% from 2025 to 2035 under the impact of stringent environmental laws and sustainable construction programs. Green Star Certification and NPI guidelines promote the application of low-VOC coatings. The construction domain is the largest user and growing demand for bio-based and waterborne coatings.
The marine and automotive industries, too, are rapidly transitioning towards high-performance, eco-friendly coatings. Very high production costs present a significant hurdle, but investment in solar-reflective and anti-corrosion coatings is opening new windows of opportunity in the market.
Market curriculums for global green coatings in effect for macroeconomic factors such as growth in industries on eco-policies and a consumer switch for sustainable products. Governments worldwide have called for more stringent VOC emission norms that drive green industries to low VOC, bio-based, and energy-efficient coatings. This has aligned with net-zero directives globally and opened long-term growth opportunities.
Demand for green architectural coatings is spearheaded by infrastructural development and urbanization, particularly in most emerging economies: India, China, and Brazil foremost among them. At this time, the changing automotive industry with EV-related components also contributed to the increased demand for green coatings since OEMs are looking for eco-friendly coatings to meet their sustainability goals.
Expectations for the development of smart coatings, nanotechnology, and antimicrobial formulations are expected to progress towards improving the performance of products as well as reducing costs, which in turn will promote their acceptance. Nevertheless, the biggest concern is inflation, inconsistency in the supply chain, and increased production cost.
Growth Opportunities
Expansion in Emerging Regions
Rapid industrialization in India, Brazil, and Southeast Asia is driving demand for green coatings. Strengthening distribution networks and local production can help manufacturers efficiently meet rising demand in architectural and industrial applications.
Smart Coatings and Advanced Materials
Self-healing, antimicrobial, and nanotechnology-based coatings illustrate an enormous future growth revenue area in the aerospace, health care, and electronics sectors. It can create new streams of revenue in specialized applications through investment by UV-curing and high-performance coatings.
Automotive & EV Coatings
Emerging electric vehicles are raising demand for light, energy-efficient coatings. These coatings are gaining popularity due to their low VOC emissions and durability in automotive applications.
Strategic Recommendations
Invest into Regional Production Hub
Building local manufacturing units within the region of high growth will help to offset supply chain disruptions, thus reducing dependence on imported raw materials and increasing cost efficiency.
Develop Low-Cost Green Coatings
The high cost remains a barrier. Companies need to develop affordable, bio-based, low-cost resins, high-volume powder coatings, and water-borne alternatives to penetrate the industry.
Target the Sectors with Highest Growth
Industry specializations such as anti-corrosion, heat-resistant, and anti-fouling coatings applied to the marine, aerospace, and electronics sectors can generate extra revenues beyond the automotive and construction industries.
Manufacturers are investing in solar-reflective coatings for energy-efficient buildings, antimicrobial coatings for hygienic surfaces, and corrosion-resistant finishes for infrastructure. These solutions are being developed with lifecycle emissions and environmental toxicity in focus. Market expansion is expected to continue as brand owners and OEMs implement carbon-reduction strategies and adopt greener raw material inputs in line with corporate ESG commitments. Digital tools for compliance tracking and formulation optimization are also gaining traction in R&D and supply chain workflows.

By technology, the industry is segmented into radiation-cure, high-solids, powder, and waterborne.
Based on application, the sector is segmented into product finishes, packaging, wood, high-performance, industrial, automotive, and architectural.
The industry is segmented by region into North America, Latin America, Western Europe, South Asia & Pacific, East Asia, Middle East, and Africa.
Increasing environmental regulations, rising demand for low-VOC coatings, and the expansion of sustainable construction and automotive industries are key factors.
The construction, automotive, aerospace, and consumer electronics industries are rapidly integrating sustainable coating solutions to meet regulatory and performance standards.
Waterborne, powder, radiation-cure, and high-solid coatings are the leading technologies, with waterborne coatings dominating due to their low toxicity and high application versatility.
High production costs, raw material availability, and performance concerns compared to conventional coatings remain significant barriers to broader usage.
Advancements in self-healing, antimicrobial, and nanotechnology-based coatings are enhancing durability, efficiency, and application diversity across various industries.


Full Research Suite comprises of:
Market outlook & trends analysis
Interviews & case studies
Strategic recommendations
Vendor profiles & capabilities analysis
5-year forecasts
8 regions and 60+ country-level data splits
Market segment data splits
12 months of continuous data updates
DELIVERED AS:
PDF EXCEL ONLINE
Green and Bio-based Polyol Market Size and Share Forecast Outlook 2025 to 2035
Green Ammonia Market Size and Share Forecast Outlook 2025 to 2035
Green Cement Market Size and Share Forecast Outlook 2025 to 2035
Green Power Market Size and Share Forecast Outlook 2025 to 2035
Green Chemicals Market Size and Share Forecast Outlook 2025 to 2035
Green Power Transformer Market Size and Share Forecast Outlook 2025 to 2035
Green Preservatives Market Size and Share Forecast Outlook 2025 to 2035
Green Tea Supplements Market Analysis - Size, Share, and Forecast 2025 to 2035
Green Data Center Market Size and Share Forecast Outlook 2025 to 2035
Green Logistics Market Size and Share Forecast Outlook 2025 to 2035
Green Methanol Market Size and Share Forecast Outlook 2025 to 2035
Green Technology And Sustainability Market Size and Share Forecast Outlook 2025 to 2035
Greenwrap Market Analysis - Size, Share, and Forecast Outlook 2025 to 2035
Green Building Materials Market Analysis by Type, Application, End-user and Region: Forecast for 2025 and 2035
Green UPS Market - Trends & Forecast 2025 to 2035
Green Tire Market Growth – Trends & Forecast 2025 to 2035
Green Tea Extracts Market Analysis – Size, Share & Forecast 2025 to 2035
Green Banana Flour Market Analysis - Growth & Demand 2025 to 2035
Green Transformer Market Growth – Trends & Forecast 2025 to 2035
Green Electronics Manufacturing Market – Sustainability & Trends 2025 to 2035

Thank you!
You will receive an email from our Business Development Manager. Please be sure to check your SPAM/JUNK folder too.
Chat With
MaRIA