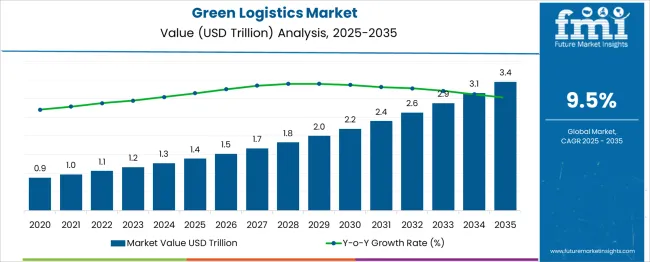
The Green Logistics Market is estimated to be valued at USD 1.4 trillion in 2025 and is projected to reach USD 3.4 trillion by 2035, registering a compound annual growth rate (CAGR) of 9.5% over the forecast period. This robust growth reflects increasing investments in low-emission transport systems, sustainable packaging, renewable energy-powered warehouses, and carbon-neutral last-mile delivery services. The market is set to expand at a compound annual growth rate (CAGR) of 9.5%, with nearly 59% of the total projected market size in 2035 representing new value creation.
Breaking down the opportunity across the timeline, the market is anticipated to generate USD 100–150 billion in incremental value annually from 2026 to 2030, accelerating further between 2031 and 2035, when annual additions may cross USD 200 billion. Key contributors to this incremental growth include the electrification of freight fleets, rail and intermodal optimization, real-time tracking and routing technologies, and government-enforced carbon emission mandates across supply chains. This significant dollar opportunity suggests that logistics providers, investors, and policymakers who prioritize green infrastructure and innovation are likely to benefit from a sizable return on investment, while simultaneously aligning with growing environmental compliance standards and consumer demand for sustainable operations.
| Metric | Value |
|---|---|
| Green Logistics Market Estimated Value in (2025 E) | USD 1.4 trillion |
| Green Logistics Market Forecast Value in (2035 F) | USD 3.4 trillion |
| Forecast CAGR (2025 to 2035) | 9.5% |
As of 2025, the Green Logistics Market holds approximately 16.3% of the broader Global Logistics Market, which is valued at USD 8.6 trillion. With the Green Logistics segment projected to grow from USD 1.4 trillion in 2025 to USD 3.4 trillion by 2035, its share is expected to rise to about 28.3% of the total logistics market, assuming a base growth of 4.8% CAGR for the overall logistics industry. This notable shift indicates a growing industry emphasis on operational models that prioritize energy efficiency, low emissions, and carbon accountability.
The integration of green logistics solutions such as EV-based fleets, optimized freight routing, and carbon offset strategies is becoming central to large-scale logistics operations, particularly among global 3PL providers. In addition to expanding its share within the logistics sector, green logistics is also gaining traction in adjacent industries like e-commerce fulfillment, where it accounts for 21.5% of logistics expenditure as of 2025. This figure is expected to exceed 35% by 2035, fueled by regulatory mandates and growing consumer demand for sustainable delivery practices. By 2035, green logistics is forecast to represent one of the most dynamic sub-segments of the logistics ecosystem, reshaping value chains across continents.
The green logistics market is expanding rapidly due to regulatory mandates, carbon neutrality goals, and growing investor focus on ESG-compliant supply chains. Governments across regions are tightening emission standards and incentivizing fuel-efficient transport methods, pushing logistics providers to adopt cleaner technologies.
Businesses are shifting toward route optimization, load consolidation, and electric or alternative-fuel fleets to cut Scope 3 emissions. Digital platforms are enabling better tracking of carbon footprints, while blockchain and IoT are improving visibility and traceability across end-to-end operations.
As consumers become more eco-conscious, pressure is rising on brands to adopt sustainable warehousing, packaging, and freight systems. Investment in smart logistics hubs, renewable-powered warehouses, and low-impact last-mile delivery is expected to accelerate over the next decade, supported by green public-private partnerships.
The green logistics market is segmented by component, mode, end-use industry and geographic regions. By component of the green logistics market is divided into Solutions and Service. In terms of the mode, the green logistics market is classified into Road, Rail, Sea, Air, and Intermodal. The green logistics market is segmented by end-use industry into Retail and E-commerce, Manufacturing, Healthcare, Automotive, Agriculture, Food and Beverage, and Others. Regionally, the green logistics industry is classified into North America, Latin America, Western Europe, Eastern Europe, Balkan & Baltic Countries, Russia & Belarus, Central Asia, East Asia, South Asia & Pacific, and the Middle East & Africa.
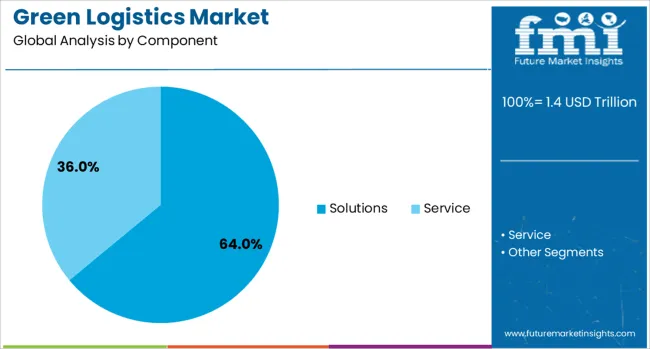
The solutions segment is expected to dominate the green logistics market with a 64.00% share in 2025. This includes software platforms for route optimization, emission tracking, carbon accounting, and reverse logistics systems.
Companies are prioritizing solutions that offer real-time emissions visibility, fuel efficiency analytics, and AI-based supply chain planning. These tools are critical for meeting sustainability reporting requirements and driving operational cost reduction.
As more companies adopt Science-Based Targets (SBTs), demand for integrated green logistics solutions is accelerating across global and regional supply chains.
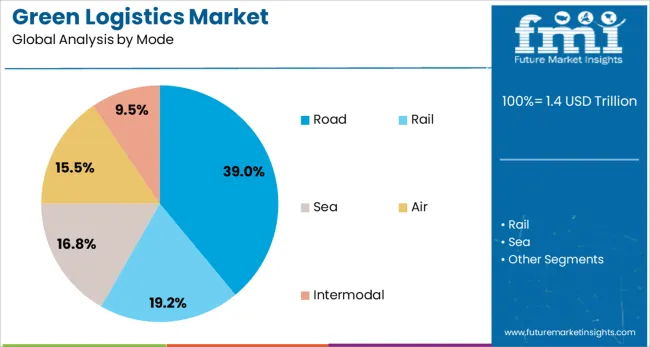
Road transport is projected to lead the market with a 39.00% share in 2025 among all transportation modes. The segment’s size is attributed to the widespread use of trucks for short- and medium-haul delivery, particularly in e-commerce and retail sectors.
Green transformation in this space includes deployment of electric delivery vans, hybrid trucks, and low-emission fuels such as biodiesel and LNG.
Investments in electrified logistics corridors, urban consolidation centers, and regulatory incentives for fleet conversion are further accelerating adoption of road-based green logistics solutions.
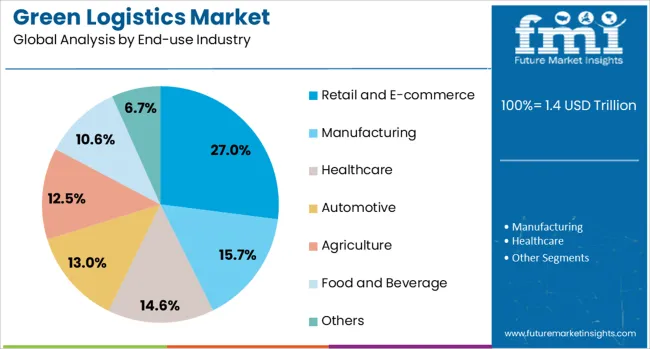
Retail and e-commerce are set to contribute 27.00% of total revenue to the green logistics market by 2025, making it the top end-use segment. The rise of online shopping, rapid delivery expectations, and reverse logistics volume are prompting e-retailers to invest in sustainable logistics frameworks.
This includes carbon-neutral shipping programs, recyclable packaging, and climate-conscious warehousing practices.
Companies such as Amazon, Walmart, and others are scaling efforts to achieve net-zero logistics targets, driving green innovation across their third-party logistics networks.
The green logistics market is growing steadily as businesses prioritize cleaner and more efficient transport and supply chain operations. Companies across freight, warehousing, and distribution are adopting measures to reduce emissions, improve fuel efficiency, and minimize waste. These practices include optimized routing, fleet upgrades, modal shifts, and eco-conscious packaging. Governments, investors, and customers increasingly favor logistics providers that demonstrate environmental responsibility. Market growth is also supported by evolving supply chain strategies that emphasize accountability and long-term efficiency improvements across logistics operations.
Companies are increasingly revamping logistics operations to reduce environmental impact while enhancing operational efficiency. Fleet operators are integrating lower-emission vehicles, implementing route optimization tools, and reducing empty hauls to decrease fuel use and unnecessary mileage. Third-party logistics providers are investing in cleaner fuels and improving vehicle load capacity. Warehouses are also being redesigned to support more efficient energy use and smarter material handling systems. Shippers are favoring rail or maritime options over road or air, where feasible, to lower their footprint. Procurement teams seek logistics partners with cleaner practices and transparent reporting. Businesses are increasingly making green logistics part of their procurement criteria, supplier evaluations, and branding narratives. As companies link logistics performance to internal environmental benchmarks, the demand for providers who can demonstrate measurable performance gains is rising. These integrated approaches reinforce the growth of green logistics as part of broader supply chain transformation efforts.
Adopting cleaner logistics practices often requires high initial investment in vehicles, infrastructure, and digital systems. Fleet replacement or retrofit projects demand capital and operational planning, especially for companies operating in multiple regions or with varied cargo types. Alternative fuel stations, compatible maintenance facilities, and reliable power sources are still unevenly distributed, making route planning for cleaner vehicles complex. Smaller logistics firms and carriers may lack access to financing or government incentives, slowing their ability to modernize. Additionally, compatibility issues across supply chain partners can limit integrated solutions. For example, investments in energy-efficient warehousing or green packaging may not align with practices downstream. Coordination across fragmented networks adds cost and complexity. These limitations make it difficult for some logistics players to justify or execute comprehensive transitions. Until infrastructure gaps narrow and funding becomes more accessible, the pace of change will vary, and adoption may remain limited to more mature or better-funded operators.
Evolving policy frameworks and customer expectations are creating strong opportunities for logistics providers with cleaner practices. Many regions are introducing mandates for emission reporting, fleet emissions caps, and restrictions on high-emission transport modes in urban areas. These regulatory measures create a clear incentive for early movers to upgrade operations. Companies are also being held accountable by customers who prefer products with cleaner delivery chains. Retailers and manufacturers are pushing their logistics partners to demonstrate progress on cleaner operations and footprint reduction. These expectations open up new avenues for differentiation, partnership, and premium contracts. Logistics providers that can offer measurable improvements in delivery impact or carbon reporting can gain a competitive edge in tenders and long-term contracts. Market leaders are expanding green service portfolios and promoting their capabilities to align with evolving buyer values. As government programs and business procurement strategies reinforce these trends, providers who adapt early can secure growth opportunities.
Despite increasing interest, the green logistics market faces fragmentation due to the lack of unified standards or measurement frameworks. Different regions and industry players adopt varying benchmarks, emission models, and reporting protocols, making comparison difficult. Logistics firms may find it challenging to align internal operations with client expectations or comply with international requests due to this inconsistency. Even among large global companies, supply chain data on fuel consumption, emissions, or warehouse energy use may be incomplete or not shared in standardized formats. These gaps hinder meaningful benchmarking, certification, and recognition. Additionally, in multi-modal transport chains, it is often unclear how responsibility for cleaner practices is allocated among shippers, carriers, and freight forwarders. Without harmonized approaches or globally recognized tools for evaluation, some progress remains siloed or unrecognized. This lack of clarity may discourage investment or delay commitments. Until widely accepted standards emerge, fragmented metrics and alignment issues will continue to restrain the market’s full momentum.
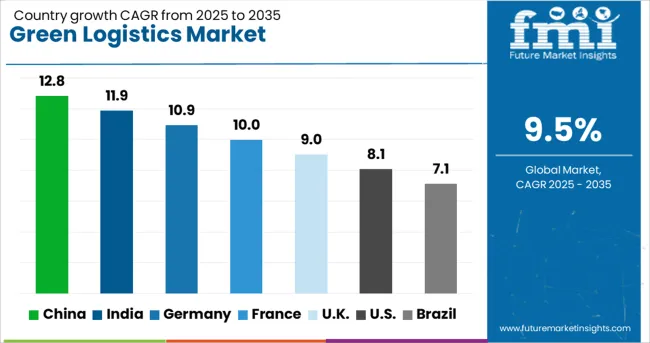
| Country | CAGR |
|---|---|
| China | 12.8% |
| India | 11.9% |
| Germany | 10.9% |
| France | 10.0% |
| UK | 9.0% |
| USA | 8.1% |
| Brazil | 7.1% |
The global green logistics market is projected to grow at a CAGR of 9.5% through 2035, driven by sustainability mandates, carbon reduction goals, and innovations in eco-efficient supply chains. Among BRICS nations, China leads with 12.8% growth, supported by investments in electric fleets, green warehousing, and logistics park decarbonization. India follows at 11.9%, fueled by government-led sustainability initiatives, electrified last-mile delivery, and multimodal transport integration. Within the OECD region, Germany records a 10.9% growth rate, reflecting strong environmental regulations, circular logistics practices, and automation in freight systems. The United Kingdom shows 9.0% growth, emphasizing green delivery solutions, emissions reporting frameworks, and urban logistics innovation. The United States, growing at 8.1%, focuses on fleet electrification, energy-efficient cold chain logistics, and ESG-driven operational shifts. These nations are leading the global shift toward sustainable, low-carbon logistics ecosystems. This report includes insights on 40+ countries; the top five markets are shown here for reference.
The green logistics market in China is advancing at a CAGR of 12.8%, backed by increased use of electric and low-emission transport across logistics zones. Major logistics firms are investing in electric delivery vans and battery-powered freight trucks for both intra-city and mid-range routes. Key industrial clusters along the eastern and southern corridors are supported by government-led installation of charging infrastructure on logistics highways. Cold chain service providers have begun installing solar-supported refrigeration units, particularly in Jiangsu and Guangdong provinces. Efforts are also underway to replace single-use shipping containers with modular, returnable systems that support large-scale distribution. In major cities like Shanghai and Shenzhen, route planning software has helped reduce total mileage by enabling coordinated deliveries. With rising e-commerce activity, logistics players are increasingly focusing on full-load capacity runs, which help lower emissions and reduce the number of trips.
The green logistics market in India is growing at a CAGR of 11.9%, supported by the shift to cleaner fuels and better freight coordination. Compressed natural gas (CNG) vehicles have replaced older diesel fleets across Delhi, Mumbai, and other high-traffic zones. In tier-2 cities, last-mile distribution is increasingly handled by electric three-wheelers and compact vans. Rail networks are also playing a growing role in freight movement, particularly along industrial corridors between Gujarat, Maharashtra, and northern states. Several warehouse hubs have switched to automated daylight lighting systems to reduce power usage, while distribution centers are optimizing storage layouts to limit unnecessary vehicle idling. Third-party logistics firms are collaborating to share delivery routes in overlapping zones, which helps improve vehicle utilization and lowers operational emissions. In the agricultural sector, multi-use containers are replacing disposable packaging, reducing waste generation along the supply chain.
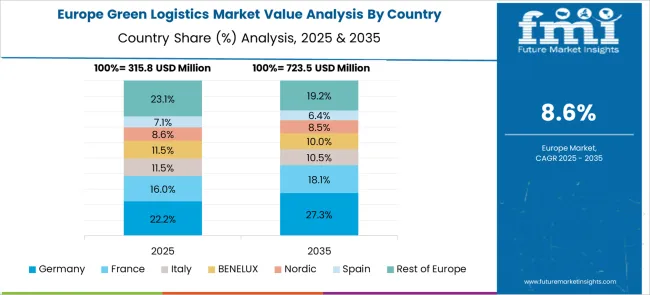
The green logistics market in Germany is advancing at a CAGR of 10.9%, shaped by the country’s strong investment in electrified warehousing and intermodal freight. Major cities like Hamburg, Frankfurt, and Leipzig have seen expansion of electric cargo fleets used for regional and last-mile delivery. Distribution centers are being outfitted with motion-based lighting and automated ventilation to reduce energy waste. Rail freight has become a preferred method for transporting consumer goods and industrial supplies across long distances, cutting reliance on trucks. Supermarket chains are retrofitting their logistics terminals with electric forklifts and equipment to reduce exhaust emissions during operations. In port cities, electric cranes and cargo handlers have replaced conventional diesel models. Companies are also reworking pallet design and loading processes to maximize cubic capacity per shipment, reducing the number of trips needed.
The green logistics market in United Kingdom is expanding at a CAGR of 9.0%, driven by changes in vehicle choice and improvements in delivery network planning. Logistics firms in London, Birmingham, and Leeds are deploying electric vans for short-haul deliveries and switching to shared loading zones to minimize urban traffic. Warehouses are adopting modular construction with improved insulation, reducing temperature loss in storage areas. Companies have begun using route planning platforms that combine deliveries across vendors, resulting in fewer trips per day. Rail freight is gradually replacing road transport in long-distance movement, especially between ports and inland hubs. In food and beverage sectors, reusable crates are now standard for local deliveries, replacing disposable packaging. Several freight terminals have installed electric charging docks and retrofitted loading bays with systems that reduce idling during transfers.
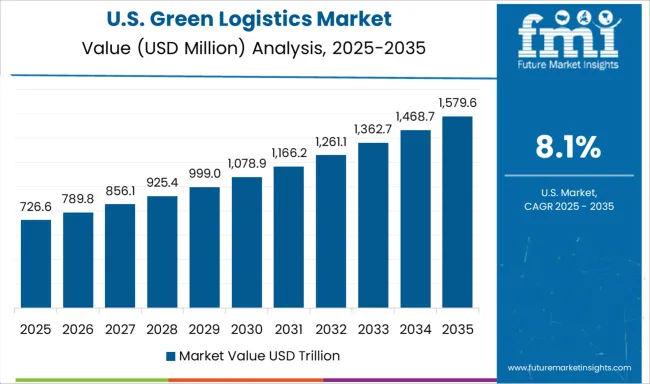
The green logistics market in United States is growing at a CAGR of 8.1%, shaped by operational shifts in vehicle routing and energy usage. In states like California, Texas, and Illinois, logistics providers are deploying hybrid and electric vehicles for both last-mile and regional operations. Cold chain companies are adjusting temperature management settings based on real-time cargo needs, helping reduce overall energy use during transport. At large distribution hubs, logistics firms are using software that groups shipments by proximity, reducing total vehicle mileage and cutting back on empty returns. Ports in the Gulf Coast and East Coast are phasing out diesel-powered cranes and switching to electric systems for container handling. Retailers are consolidating warehouse deliveries to off-peak hours to reduce urban congestion and fuel waste. Packaging redesigns have also helped maximize load capacity per trip, reducing the number of truck runs required.
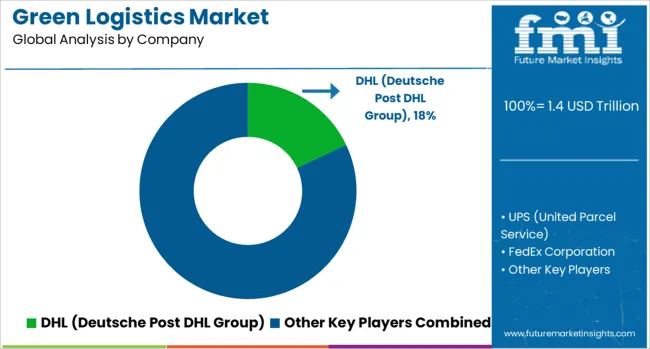
The green logistics market is driven by major global players like DHL, UPS, and FedEx, which have gradually transitioned their core operations to meet emerging environmental mandates and client expectations. These firms leverage their extensive fleet control and global infrastructure to adopt practices that reduce inefficiencies in transport, warehousing, and distribution. Their scale allows them to pilot cost-saving measures such as route optimization, energy-efficient facilities, and alternative fuel integration across continents. Maersk, DB Schenker, and Kuehne + Nagel are reshaping freight and maritime operations by integrating long-term logistics strategies that cut down on resource-intensive practices. These companies are also restructuring regional networks to shift more goods through intermodal systems, minimizing reliance on carbon-heavy routes. Their strong relationships with multinational clients give them an early mover advantage in offering supply chain reengineering as a packaged service. Challengers like XPO Logistics are leveraging their agility and data-driven operations to compete with traditional giants. Instead of overhauling legacy infrastructure, they focus on reducing idle times, improving load utilization, and trimming waste across logistics nodes. This leaner approach allows them to partner with retailers and manufacturers seeking immediate results without large capital commitments. As pressure grows from end-clients and regulators to meet stricter environmental baselines, the companies most responsive in aligning logistics efficiency with measurable environmental benefits are expected to lead in securing long-term, large-scale contracts.
TGE (ex-Toll Group) in Australia has launched a trial fleet of 60 Daimler and Volvo EV trucks for suburban logistics in Western Sydney, backed by the Australian Renewable Energy Agency a move emblematic of green logistics scaling.
| Item | Value |
|---|---|
| Quantitative Units | USD 1.4 Trillion |
| Component | Solutions and Service |
| Mode | Road, Rail, Sea, Air, and Intermodal |
| End-use Industry | Retail and E-commerce, Manufacturing, Healthcare, Automotive, Agriculture, Food and Beverage, and Others |
| Regions Covered | North America, Europe, Asia-Pacific, Latin America, Middle East & Africa |
| Country Covered | United States, Canada, Germany, France, United Kingdom, China, Japan, India, Brazil, South Africa |
| Key Companies Profiled | DHL (Deutsche Post DHL Group), UPS (United Parcel Service), FedEx Corporation, Maersk (A.P. Moller-Maersk), DB Schenker, Kuehne + Nagel, and XPO Logistics |
| Additional Attributes | Dollar sales vary by logistics mode and business type, with road and distribution services dominating, and warehousing leading value share. Asia‑Pacific leads volume, while North America and Europe drive premium green investments. Pricing fluctuates with EV and renewable infrastructure costs. Growth accelerates via electric fleets, AI route optimization, green warehouses, and carbon tracking under regulatory mandates. |
The global green logistics market is estimated to be valued at USD 1.4 trillion in 2025.
The market size for the green logistics market is projected to reach USD 3.4 trillion by 2035.
The green logistics market is expected to grow at a 9.5% CAGR between 2025 and 2035.
The key product types in green logistics market are solutions, _green transportation, _green warehousing, _green packaging, _recycling, _waste management, service, _consulting, _transportation management, _warehousing management and _green supply chain planning.
In terms of mode, road segment to command 39.0% share in the green logistics market in 2025.


Our Research Products

The "Full Research Suite" delivers actionable market intel, deep dives on markets or technologies, so clients act faster, cut risk, and unlock growth.

The Leaderboard benchmarks and ranks top vendors, classifying them as Established Leaders, Leading Challengers, or Disruptors & Challengers.

Locates where complements amplify value and substitutes erode it, forecasting net impact by horizon

We deliver granular, decision-grade intel: market sizing, 5-year forecasts, pricing, adoption, usage, revenue, and operational KPIs—plus competitor tracking, regulation, and value chains—across 60 countries broadly.

Spot the shifts before they hit your P&L. We track inflection points, adoption curves, pricing moves, and ecosystem plays to show where demand is heading, why it is changing, and what to do next across high-growth markets and disruptive tech

Real-time reads of user behavior. We track shifting priorities, perceptions of today’s and next-gen services, and provider experience, then pace how fast tech moves from trial to adoption, blending buyer, consumer, and channel inputs with social signals (#WhySwitch, #UX).

Partner with our analyst team to build a custom report designed around your business priorities. From analysing market trends to assessing competitors or crafting bespoke datasets, we tailor insights to your needs.
Supplier Intelligence
Discovery & Profiling
Capacity & Footprint
Performance & Risk
Compliance & Governance
Commercial Readiness
Who Supplies Whom
Scorecards & Shortlists
Playbooks & Docs
Category Intelligence
Definition & Scope
Demand & Use Cases
Cost Drivers
Market Structure
Supply Chain Map
Trade & Policy
Operating Norms
Deliverables
Buyer Intelligence
Account Basics
Spend & Scope
Procurement Model
Vendor Requirements
Terms & Policies
Entry Strategy
Pain Points & Triggers
Outputs
Pricing Analysis
Benchmarks
Trends
Should-Cost
Indexation
Landed Cost
Commercial Terms
Deliverables
Brand Analysis
Positioning & Value Prop
Share & Presence
Customer Evidence
Go-to-Market
Digital & Reputation
Compliance & Trust
KPIs & Gaps
Outputs
Full Research Suite comprises of:
Market outlook & trends analysis
Interviews & case studies
Strategic recommendations
Vendor profiles & capabilities analysis
5-year forecasts
8 regions and 60+ country-level data splits
Market segment data splits
12 months of continuous data updates
DELIVERED AS:
PDF EXCEL ONLINE
Green and Bio-based Polyol Market Size and Share Forecast Outlook 2025 to 2035
Green Ammonia Market Size and Share Forecast Outlook 2025 to 2035
Green Cement Market Size and Share Forecast Outlook 2025 to 2035
Green Power Market Size and Share Forecast Outlook 2025 to 2035
Green Chemicals Market Size and Share Forecast Outlook 2025 to 2035
Green Power Transformer Market Size and Share Forecast Outlook 2025 to 2035
Green Preservatives Market Size and Share Forecast Outlook 2025 to 2035
Green Tea Supplements Market Analysis - Size, Share, and Forecast 2025 to 2035
Green Data Center Market Size and Share Forecast Outlook 2025 to 2035
Green Methanol Market Size and Share Forecast Outlook 2025 to 2035
Green Technology And Sustainability Market Size and Share Forecast Outlook 2025 to 2035
Greenwrap Market Analysis - Size, Share, and Forecast Outlook 2025 to 2035
Green Coatings Market Analysis by Technology, Application, and Region Forecast through 2035
Green Building Materials Market Analysis by Type, Application, End-user and Region: Forecast for 2025 and 2035
Green UPS Market - Trends & Forecast 2025 to 2035
Green Tire Market Growth – Trends & Forecast 2025 to 2035
Green Tea Extracts Market Analysis – Size, Share & Forecast 2025 to 2035
Green Banana Flour Market Analysis - Growth & Demand 2025 to 2035
Green Transformer Market Growth – Trends & Forecast 2025 to 2035
Green Electronics Manufacturing Market – Sustainability & Trends 2025 to 2035

Thank you!
You will receive an email from our Business Development Manager. Please be sure to check your SPAM/JUNK folder too.
Chat With
MaRIA