The global green ammonia market is projected to reach USD 85,100 million by 2035, recording an absolute increase of USD 84.6 billion over the forecast period. The market is valued at USD 475.2 million in 2025 and is set to rise at a CAGR of 68.0% during the assessment period.
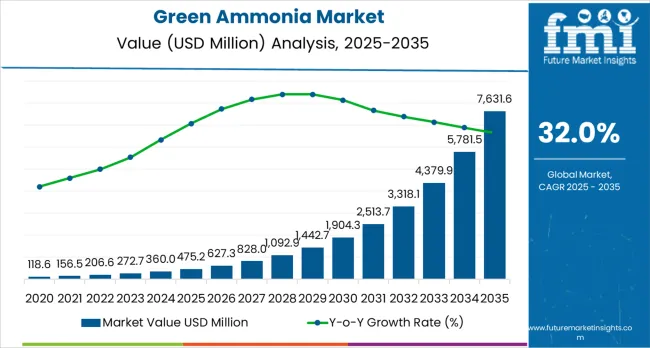
The overall market size is expected to grow by nearly 179 times during the same period, supported by increasing demand for carbon-free energy carriers and decarbonized fertilizer production worldwide, driving demand for efficient renewable hydrogen-based synthesis systems and increasing investments in energy transition infrastructure and zero-emission fuel development projects globally. However, high production costs compared to conventional ammonia and electrolyser technology scalability constraints may pose challenges to market expansion.
Between 2025 and 2030, the green ammonia market is projected to expand from USD 475.2 million to USD 6.3 billion, resulting in a value increase of USD 5.8 billion, which represents 6.9% of the total forecast growth for the decade.
This phase of development will be shaped by rising demand for decarbonized fertilizer production and maritime fuel alternatives, product innovation in electrolyser technologies and ammonia synthesis integration, as well as expanding integration with renewable energy mega-projects and hydrogen economy infrastructure initiatives.
Companies are establishing competitive positions through investment in multi-gigawatt electrolyser programs, strategic export terminal development, and offtake agreements with utilities, shipping companies, and fertilizer producers.
From 2030 to 2035, the market is forecast to grow from USD 6.3 billion to USD 85,100 million, adding another USD 78.8 billion, which constitutes 93.1% of the overall ten-year expansion. This period is expected to be characterized by the mass commercialization of green ammonia systems, including large-scale export infrastructure and integrated renewable energy-to-ammonia complexes tailored for maritime shipping and power generation requirements, strategic collaborations between energy majors and industrial consumers, and an enhanced focus on cost competitiveness and supply chain establishment.
The growing emphasis on shipping decarbonization mandates and fertilizer industry net-zero commitments will drive demand for advanced, cost-competitive green ammonia solutions across diverse industrial applications.
| Metric | Value |
|---|---|
| Market Value (2025) | USD 475.2 million |
| Market Forecast Value (2035) | USD 85,100 million |
| Forecast CAGR (2025-2035) | 68.0% |
The green ammonia market grows by enabling industries to achieve zero-carbon production pathways for fertilizers, marine fuels, and energy storage applications that address urgent climate mitigation requirements. Maritime shipping operators face mounting pressure to comply with International Maritime Organization decarbonization targets, with regulations requiring 40% carbon intensity reduction by 2030 and net-zero emissions by 2050, making green ammonia one of the few scalable zero-carbon marine fuel alternatives. The fertilizer industry's need to decarbonize production processes creates sustained demand for green ammonia, as conventional Haber-Bosch synthesis using natural gas-derived hydrogen accounts for approximately 2% of global CO2 emissions, driving major fertilizer producers toward renewable hydrogen integration.
Government initiatives including the U.S. Inflation Reduction Act, European Union hydrogen strategy, and Asian net-zero commitments provide substantial production incentives, with green hydrogen subsidies of USD 3 per kilogram supporting ammonia production economics. The renewable energy sector's excess generation capacity creates opportunities for power-to-ammonia applications, where green ammonia serves as a chemical energy carrier enabling long-duration storage and international energy trade across continents. However, production cost premiums of 2-3 times versus conventional ammonia, limited electrolyser manufacturing capacity, and ammonia synthesis integration challenges may limit adoption rates among price-sensitive fertilizer markets and delay widespread shipping fuel conversion timelines in the near term.
The market is segmented by production process, end use, offtake model, and region. By production process, the market is divided into Proton Exchange Membrane electrolysis, Alkaline Water Electrolysis, Solid Oxide Electrolysis, and hybrid/other routes. Based on end use, the market is categorized into fertilizer, transportation, power generation &energy storage, industrial feedstock, and others.
By offtake model, the market includes export-led projects, domestic utility/industrial offtake, and spot/pilot demonstration volumes. Regionally, the market is divided into Asia Pacific, Europe, North America, Latin America, and Middle East &Africa.
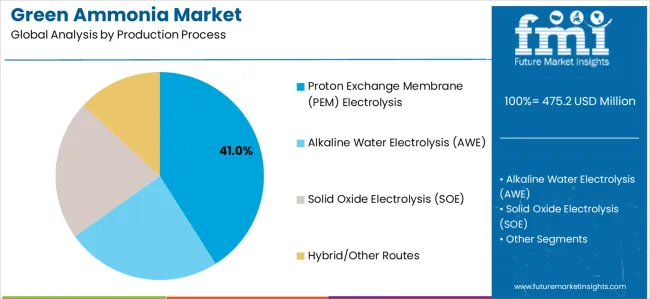
The Proton Exchange Membrane electrolysis segment represents the dominant force in the green ammonia market, capturing approximately 41.0% of total market share in 2025. This advanced technology category delivers superior operational flexibility enabling dynamic response to variable renewable energy generation, compact footprint characteristics suitable for offshore wind integration, and rapid load-following capabilities essential for matching intermittent solar and wind power availability.
The PEM electrolysis segment's market leadership stems from its exceptional compatibility with renewable energy sources, faster start-up and shutdown cycles compared to alkaline alternatives, and growing manufacturing scale-up from leading suppliers including Siemens Energy and ITM Power.
The Alkaline Water Electrolysis segment maintains a substantial 36.0% market share, serving projects prioritizing proven technology maturity and lower capital costs in large-scale applications. Solid Oxide Electrolysis captures 18.0% market share through high-temperature efficiency advantages, while hybrid and other routes represent 5.0% addressing specialized applications and emerging technology demonstrations.
Key advantages driving the PEM electrolysis segment include:
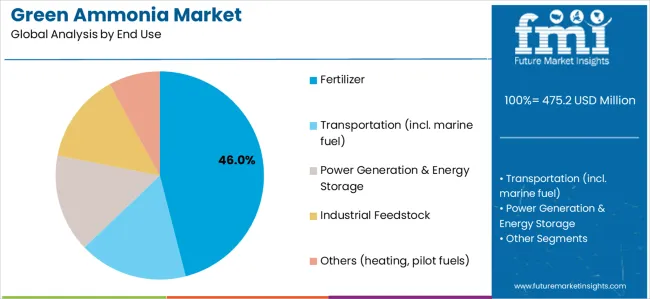
Fertilizer applications dominate the green ammonia market with approximately 46.0% market share in 2025, reflecting the critical role of ammonia as the primary nitrogen source for global agricultural production and the fertilizer industry's commitment to production decarbonization.
The fertilizer segment's market leadership is reinforced by existing ammonia distribution infrastructure, established demand volumes exceeding 180 million tonnes annually worldwide, and major producer commitments to green ammonia integration including Yara, CF Industries, and Fertiglobe advancing renewable hydrogen conversion programs.
The transportation segment, including maritime fuel applications, represents 22.0% market share through shipping industry decarbonization initiatives and ammonia's advantages as a carbon-free, energy-dense marine fuel. Power generation and energy storage capture 18.0% market share via utility co-firing pilots and long-duration energy storage applications. Industrial feedstock uses account for 10.0%, while other applications including heating and pilot fuels represent 4.0% of the market.
Key end-use drivers include:
The market is driven by three concrete demand factors tied to decarbonization imperatives and energy transition policies. First, maritime shipping decarbonization regulations create unprecedented fuel demand, with the International Maritime Organization targeting net-zero emissions by 2050 and the shipping sector requiring approximately 400 million tonnes of zero-carbon fuels annually by mid-century, positioning green ammonia as one of few scalable alternatives alongside methanol and hydrogen. Second, government subsidies and carbon pricing mechanisms dramatically improve green ammonia economics, with the U.S. Inflation Reduction Act providing up to USD 3 per kilogram hydrogen production tax credits, European Union carbon border adjustment mechanisms penalizing grey ammonia imports, and Asian economies implementing green hydrogen procurement mandates that narrow cost gaps versus conventional ammonia from 200-300% premiums toward 50-100% differentials by 2030. Third, renewable energy cost deflation and electrolyser scaling enable production cost reductions, with solar and wind power reaching USD 20-30 per MWh in optimal locations and electrolyser capital costs projected to decline 50-70% by 2030 through manufacturing scale-up and technology learning curves.
Market restraints include substantial production cost premiums versus conventional ammonia, with green ammonia production costs currently ranging USD 600-1,000 per tonne compared to grey ammonia at USD 200-400 per tonne, requiring either significant carbon pricing or sustained subsidy mechanisms for economic viability. Electrolyser manufacturing capacity constraints pose scaling challenges, as current global PEM and alkaline electrolyser production capacity totals approximately 10-15 GW annually while achieving 2050 green ammonia targets requires 1,000+ GW cumulative electrolyser deployment, necessitating 50-100x manufacturing expansion over two decades. Infrastructure development requirements create investment barriers, including dedicated renewable energy generation assets, water supply and desalination facilities, ammonia synthesis plants, storage terminals, and specialized shipping and port infrastructure requiring USD 50-100 billion cumulative investment through 2035.
Key trends indicate accelerating adoption in export-oriented mega-projects, particularly Australia, Middle East, and Chile developing multi-GW renewable energy-to-ammonia complexes targeting Asian and European markets with individual project capacities reaching 1-5 million tonnes annually by 2030. Technology convergence trends toward integrated renewable energy and ammonia production systems, including offshore wind-to-ammonia platforms, co-located solar/battery/electrolyser/synthesis facilities, and modular production units enabling distributed manufacturing at ports and industrial sites. However, the market thesis could face disruption if alternative zero-carbon marine fuels including methanol, liquid hydrogen, or synthetic fuels achieve superior economics or operational advantages, or if breakthrough technologies including solid-state ammonia synthesis or biological nitrogen fixation enable entirely different production pathways bypassing conventional Haber-Bosch and electrolysis infrastructure.
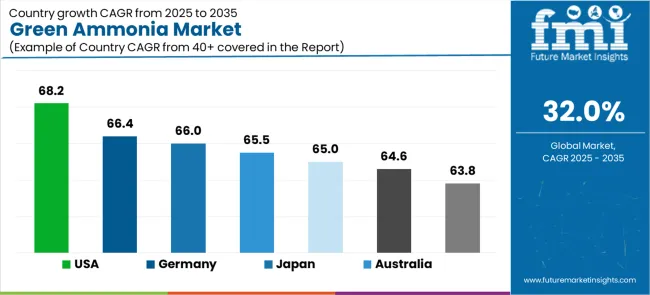
| Country | CAGR (2025-2035) |
|---|---|
| USA | 68.2% |
| Germany | 66.4% |
| Japan | 66.0% |
| Australia | 65.5% |
| India | 65.0% |
| South Korea | 64.6% |
| Saudi Arabia | 63.8% |
The green ammonia market is gaining momentum worldwide, with the USA taking the lead thanks to multi-gigawatt electrolyser programs under federal incentives and early marine and power co-firing trials establishing commercial pathways.
Close behind, Germany benefits from hydrogen import hub development and ammonia cracking pilot facilities, positioning itself as a strategic energy transition leader in Europe. Japan shows strong advancement, where utility co-firing of green ammonia and maritime fuel corridor development strengthen its role in Asian decarbonization efforts.
Australia demonstrates exceptional growth through export mega-projects tied to world-class wind and solar resources and port infrastructure enabling ammonia exports. Meanwhile, India stands out for its green hydrogen derivative mandates and fertilizer import substitution plans, while South Korea and Saudi Arabia continue to record robust progress in ammonia co-firing roadmaps and integrated renewable energy hubs.
Together, the USA and Germany anchor the global expansion story, while resource-rich export nations and import-dependent economies build complementary infrastructure into the market's growth path.
The report covers an in-depth analysis of 40+ countries top-performing countries are highlighted below.
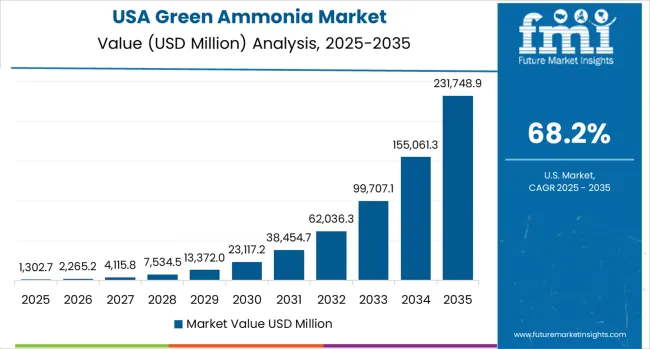
The USA demonstrates the strongest growth potential in the Green Ammonia Market with a CAGR of 68.2% through 2035. The country's leadership position stems from comprehensive federal support through the Inflation Reduction Act providing production tax credits up to USD 3 per kilogram for clean hydrogen, multi-gigawatt electrolyser deployment programs, and strategic positioning as both a producer and consumer of green ammonia across fertilizer, maritime, and power sectors.
Growth is concentrated in Gulf Coast regions including Texas and Louisiana where existing ammonia production infrastructure, renewable energy resources, and export terminal access converge, plus Midwest agricultural states implementing green fertilizer strategies.
Distribution channels through ammonia pipelines, coastal terminals, and direct industrial supply relationships expand deployment across fertilizer plants, power generation facilities, and emerging maritime bunkering operations. The country's integrated approach combining production incentives, infrastructure investment, and end-use market development provides comprehensive support for green ammonia commercialization.
Key market factors:
In Hamburg, Bremen, Wilhelmshaven, and Rotterdam corridor regions, the development of green ammonia import terminals and cracking facilities is accelerating, driven by energy security priorities following natural gas supply disruptions and comprehensive hydrogen strategy implementation.
The market demonstrates exceptional growth momentum with a CAGR of 66.4% through 2035, linked to utility co-firing programs, industrial decarbonization requirements, and strategic positioning as European hydrogen import gateway.
German energy companies are implementing ammonia-to-hydrogen conversion facilities, power plant co-firing pilot projects, and industrial cluster supply networks serving steel, chemical, and fertilizer sectors. The country's National Hydrogen Strategy and substantial public funding mechanisms create sustained competitive advantages in green ammonia import infrastructure and end-use application development.
Green ammonia market in Japan demonstrates sophisticated implementation focused on power generation co-firing, maritime fuel infrastructure, and long-term import partnerships securing diversified supply from Australia, Middle East, and Southeast Asian production hubs.
The country shows exceptional potential with a CAGR of 66.0% through 2035, driven by aggressive decarbonization commitments, limited domestic renewable energy resources, and established ammonia import infrastructure including storage terminals and industrial distribution networks.
Japanese utilities including JERA, J-POWER, and regional power companies are advancing co-firing trials targeting 20% ammonia blending ratios by 2030 and 100% ammonia combustion by 2040. The country's strategic approach emphasizes long-term offtake agreements, technology development partnerships, and comprehensive safety standards enabling commercial-scale deployment.
Market characteristics:
Market expansion in Australia is driven by world-class renewable energy resources, strategic geographic positioning relative to Asian import markets, and comprehensive green ammonia export project pipeline exceeding 20 million tonnes annual capacity in advanced development stages. The country demonstrates exceptional growth potential with a CAGR of 65.5% through 2035, supported by state government renewable energy zones, port infrastructure investment, and long-term offtake agreements with Japanese, Korean, and European buyers. Australian developers including Fortescue Future Industries, Origin Energy, and international partnerships are implementing multi-gigawatt wind and solar complexes integrated with electrolyser facilities and ammonia synthesis plants targeting export-oriented production. The country's established LNG export expertise, port infrastructure, and mining project development capabilities provide significant advantages in large-scale green ammonia project execution.
Key development areas:
India's green ammonia market benefits from government mandates requiring fertilizer producers to procure green hydrogen derivatives, comprehensive renewable energy deployment targets exceeding 500 GW by 2030, and strategic objectives reducing fertilizer import dependency.
The market maintains exceptional growth with a CAGR of 65.0% through 2035, driven by fertilizer subsidy reforms linking support to green production methods, renewable energy cost competitiveness, and domestic electrolyser manufacturing initiatives.
Indian fertilizer companies including IFFCO, Indian Farmers Fertiliser Cooperative, and Chambal Fertilisers are implementing green ammonia projects, while energy companies including Reliance, Adani, and ACME Group advance large-scale renewable hydrogen facilities. The country's comprehensive policy framework and domestic demand scale provide sustained market development momentum.
Market development factors:
Green ammonia market in South Korea demonstrates strategic focus on utility co-firing roadmaps, maritime fuel infrastructure serving domestic shipbuilding industry, and import diversification reducing fossil fuel dependencies.
The country shows exceptional potential with a CAGR of 64.6% through 2035, linked to aggressive carbon neutrality targets, power sector decarbonization requirements, and shipbuilding industry positioning in zero-carbon vessel development.
Korean utilities including Korea South-East Power and Korea Midland Power are advancing ammonia co-firing implementation plans, while shipbuilders including Hyundai Heavy Industries and Samsung Heavy Industries develop ammonia-fueled vessel designs. The country's comprehensive industrial policy coordination and technology development capabilities support integrated green ammonia ecosystem development.
Key market characteristics:
Green ammonia market in Saudi Arabia showcases strategic deployment of integrated renewable energy and ammonia production hubs, export-oriented project structuring, and dedicated offtake agreements with European and Asian buyers.
The market shows robust growth potential with a CAGR of 63.8% through 2035, linked to Vision 2030 economic diversification objectives, world-class solar and wind resources, and NEOM green hydrogen mega-project targeting 1.2 million tonnes annual ammonia production by 2026.
Saudi developers including ACWA Power, Air Products partnership, and NEOM Green Hydrogen Company are implementing multi-billion dollar facilities combining renewable generation, electrolysis, and ammonia synthesis. The country's established hydrocarbon infrastructure expertise, project financing capabilities, and strategic relationships with industrial consumers provide significant competitive advantages.
Market characteristics:
The green ammonia market in Europe is projected to grow from USD 123.6 million in 2025 to USD 24.9 billion by 2035, registering a CAGR of 69.1% over the forecast period. Germany is expected to maintain its leadership position with a 22.0% market share in 2025, holding steady at 22.5% by 2035, supported by its extensive import terminal development programs and major utility co-firing initiatives in Hamburg, Wilhelmshaven, and Rhine-Ruhr industrial clusters.
Spain follows with an 18.0% share in 2025, projected to reach 18.5% by 2035, driven by renewable energy abundance and utility co-firing pilot programs leveraging Iberian Peninsula wind and solar resources. The Netherlands holds a 14.0% share in 2025, maintaining 14.0% by 2035 through Rotterdam port infrastructure development and industrial cluster integration. The United Kingdom commands a 14.0% share in 2025, easing to 13.5% by 2035 backed by offshore wind integration and maritime fuel infrastructure programs.
France holds a 13.0% share in 2025, reaching 13.0% by 2035 through fertilizer decarbonization contracts and nuclear-powered green hydrogen initiatives. Italy accounts for 11.0% in 2025, rising to 11.5% by 2035 on industrial decarbonization requirements and renewable energy integration. The Nordics and Rest of Europe region is anticipated at 8.0% in 2025, expanding to 7.0% by 2035, attributed to Nordic offshore wind ammonia projects and emerging Central European applications.
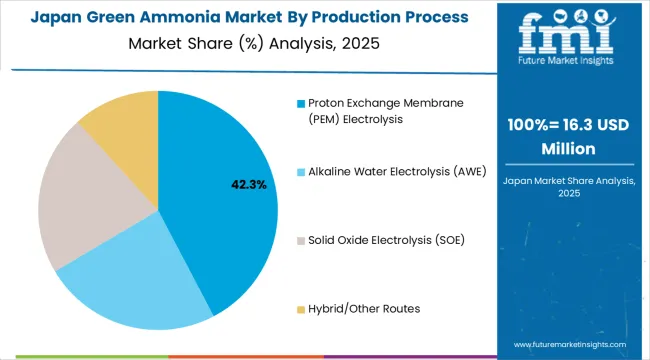
The Japanese green ammonia market demonstrates mature strategic planning, characterized by comprehensive utility co-firing roadmaps, maritime fuel infrastructure development, and diversified import supply chain establishment serving both power generation and shipping decarbonization objectives. Japan's emphasis on energy security and industrial competitiveness drives demand for green ammonia imports complementing limited domestic renewable energy resources while supporting aggressive carbon neutrality targets.
The market benefits from strong government coordination through METI hydrogen strategy, substantial public funding mechanisms including Green Innovation Fund, and integrated industry commitments spanning utilities, trading houses, and industrial consumers.
Major power generators including JERA, J-POWER, Chugoku Electric, and regional utilities showcase advanced co-firing implementation where ammonia combustion trials achieve 20% blending ratios with pathways toward 100% ammonia firing by 2040.
Maritime applications through shipping companies including NYK Line, Mitsui O.S.K. Lines, and shipbuilders Mitsubishi Heavy Industries and Kawasaki Heavy Industries advance zero-carbon vessel development and bunkering infrastructure establishing comprehensive green ammonia utilization ecosystem across power, shipping, and potential industrial applications.
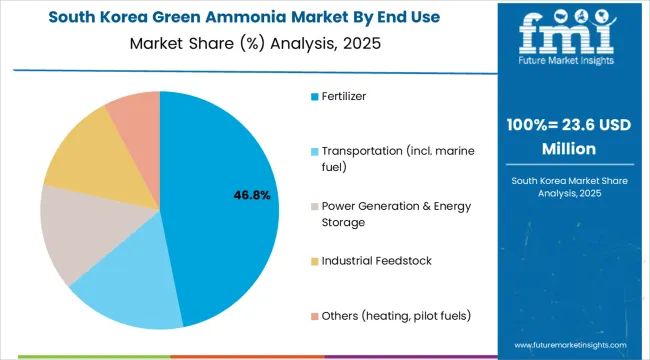
The South Korean green ammonia market is characterized by integrated industrial policy supporting power sector decarbonization, shipbuilding industry competitiveness in zero-carbon vessels, and strategic import diversification reducing fossil fuel dependencies.
The market demonstrates emphasis on utility co-firing implementation and maritime fuel infrastructure, as Korean power generators advance ammonia combustion programs targeting 20% blending ratios by 2030 requiring substantial import volumes while supporting coal plant asset utilization during energy transition. Major utilities including Korea South-East Power, Korea Midland Power, and Korea Southern Power implement comprehensive co-firing trials, retrofit engineering, and long-term fuel procurement strategies.
Shipbuilding conglomerates including Hyundai Heavy Industries, Samsung Heavy Industries, and Daewoo Shipbuilding &Marine Engineering advance ammonia-fueled vessel designs, onboard fuel handling systems, and propulsion technology development supporting maritime industry leadership in zero-carbon shipping transitions.
The competitive landscape shows government coordination through hydrogen economy roadmap, research and development funding, and industry consortium approaches connecting power generation, shipbuilding, and potential industrial ammonia applications. Korean companies pursue import partnerships with Australian renewable energy developers, Middle Eastern integrated projects, and diversified supply sources ensuring long-term fuel security while supporting domestic industrial competitiveness objectives.
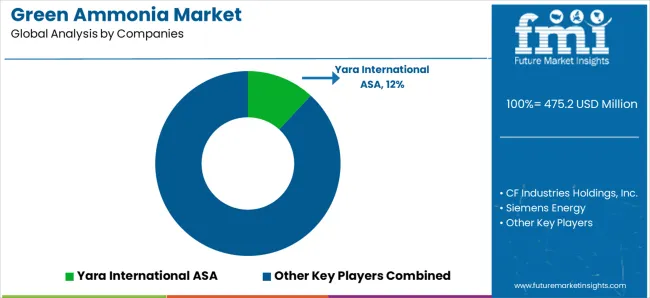
The green ammonia market features approximately 25-35 meaningful players with emerging concentration patterns, where the top three companies control roughly 25-30% of announced project capacity through strategic partnerships and first-mover positioning. Competition centers on renewable energy access, electrolyser technology partnerships, and long-term offtake agreements rather than price competition alone. Yara International ASA leads with approximately 12.0% market share through its comprehensive green fertilizer strategy, existing ammonia infrastructure, and advanced pilot projects in Norway and Netherlands.
Market leaders include Yara International ASA, CF Industries Holdings, Inc., and Siemens Energy, which maintain competitive advantages through established ammonia production and distribution assets, vertically integrated strategies spanning renewable energy through end-use applications, and strategic customer relationships with utilities, shipping companies, and industrial consumers, creating project development and financing advantages. These companies leverage decades of ammonia industry expertise, global infrastructure footprints, and balance sheet strength to secure renewable energy resources and electrolyser supply while de-risking commercial deployment through phased capacity additions.
Challengers encompass ThyssenKrupp AG and Fertiglobe plc, which compete through engineering expertise and strategic Middle East positioning in export-oriented projects. Technology specialists including NEL Hydrogen, ITM Power, and Maire Tecnimont S.p.A. focus on electrolyser supply, engineering procurement construction capabilities, and ammonia synthesis integration, offering differentiated technical capabilities supporting project developers and end users.
Emerging developers and regional champions create competitive dynamics through renewable energy integration strategies, particularly in Australia, Middle East, and Latin America where ACME Group, Fortescue Future Industries, and other developers advance multi-gigawatt projects targeting export markets. Market dynamics favor companies combining renewable energy access, ammonia industry expertise, technology partnerships, and secured offtake agreements that provide project financing bankability while managing technology scaling risks and market development uncertainties in nascent green ammonia commercialization phase.
Green ammonia represents zero-carbon chemical production enabling fertilizer decarbonization, maritime shipping fuel transitions, and energy storage applications supporting global climate objectives, delivering carbon-free nitrogen compounds through renewable hydrogen synthesis pathways.
With the market projected to grow from USD 475.2 million in 2025 to USD 85,100 million by 2035 at a 68.0% CAGR, these renewable chemical systems offer compelling strategic importance - emissions elimination, energy security diversification, and circular economy integration - making them essential for fertilizer production (46.0% market share), transportation applications (22.0% share), and industries seeking alternatives to fossil-based ammonia production accounting for 2% of global CO2 emissions.
Scaling commercial deployment and cost competitiveness requires coordinated action across energy policy, infrastructure investment, technology innovation, industrial partnerships, and climate finance mobilization.
| Item | Value |
|---|---|
| Quantitative Units | USD 475.2 Million |
| Production Process | Proton Exchange Membrane Electrolysis, Alkaline Water Electrolysis, Solid Oxide Electrolysis, Hybrid/Other Routes |
| End Use | Fertilizer, Transportation, Power Generation &Energy Storage, Industrial Feedstock, Others |
| Offtake Model | Export-led Projects, Domestic Utility/Industrial Offtake, Spot/Pilot Demonstration Volumes |
| Regions Covered | Asia Pacific, Europe, North America, Latin America, Middle East &Africa |
| Country Covered | USA, Germany, Japan, Australia, India, South Korea, Saudi Arabia, and 40+ countries |
| Key Companies Profiled | Yara International ASA, CF Industries Holdings, Inc., Siemens Energy, ThyssenKrupp AG, Fertiglobe plc, BASF SE, NEL Hydrogen, ITM Power, Maire Tecnimont S.p.A., ACME Group |
| Additional Attributes | Dollar sales by production process, end use, and offtake model categories, regional project development trends across Asia Pacific, Europe, and North America, competitive landscape with integrated producers and technology providers, electrolyser and synthesis facility specifications, integration with renewable energy infrastructure and maritime shipping systems, innovations in PEM and alkaline electrolysis technologies, and development of export-oriented mega-projects with multi-gigawatt renewable energy integration and long-term offtake agreements supporting commercial deployment. |
The global green ammonia market is estimated to be valued at USD 475.2 million in 2025.
The market size for the green ammonia market is projected to reach USD 7,631.6 million by 2035.
The green ammonia market is expected to grow at a 32.0% CAGR between 2025 and 2035.
The key product types in green ammonia market are proton exchange membrane (pem) electrolysis, alkaline water electrolysis (awe), solid oxide electrolysis (soe) and hybrid/other routes.
In terms of end use, fertilizer segment to command 46.0% share in the green ammonia market in 2025.


Our Research Products

The "Full Research Suite" delivers actionable market intel, deep dives on markets or technologies, so clients act faster, cut risk, and unlock growth.

The Leaderboard benchmarks and ranks top vendors, classifying them as Established Leaders, Leading Challengers, or Disruptors & Challengers.

Locates where complements amplify value and substitutes erode it, forecasting net impact by horizon

We deliver granular, decision-grade intel: market sizing, 5-year forecasts, pricing, adoption, usage, revenue, and operational KPIs—plus competitor tracking, regulation, and value chains—across 60 countries broadly.

Spot the shifts before they hit your P&L. We track inflection points, adoption curves, pricing moves, and ecosystem plays to show where demand is heading, why it is changing, and what to do next across high-growth markets and disruptive tech

Real-time reads of user behavior. We track shifting priorities, perceptions of today’s and next-gen services, and provider experience, then pace how fast tech moves from trial to adoption, blending buyer, consumer, and channel inputs with social signals (#WhySwitch, #UX).

Partner with our analyst team to build a custom report designed around your business priorities. From analysing market trends to assessing competitors or crafting bespoke datasets, we tailor insights to your needs.
Supplier Intelligence
Discovery & Profiling
Capacity & Footprint
Performance & Risk
Compliance & Governance
Commercial Readiness
Who Supplies Whom
Scorecards & Shortlists
Playbooks & Docs
Category Intelligence
Definition & Scope
Demand & Use Cases
Cost Drivers
Market Structure
Supply Chain Map
Trade & Policy
Operating Norms
Deliverables
Buyer Intelligence
Account Basics
Spend & Scope
Procurement Model
Vendor Requirements
Terms & Policies
Entry Strategy
Pain Points & Triggers
Outputs
Pricing Analysis
Benchmarks
Trends
Should-Cost
Indexation
Landed Cost
Commercial Terms
Deliverables
Brand Analysis
Positioning & Value Prop
Share & Presence
Customer Evidence
Go-to-Market
Digital & Reputation
Compliance & Trust
KPIs & Gaps
Outputs
Full Research Suite comprises of:
Market outlook & trends analysis
Interviews & case studies
Strategic recommendations
Vendor profiles & capabilities analysis
5-year forecasts
8 regions and 60+ country-level data splits
Market segment data splits
12 months of continuous data updates
DELIVERED AS:
PDF EXCEL ONLINE
Ammonia Online Detection System Market Size and Share Forecast Outlook 2025 to 2035
Green and Bio-based Polyol Market Size and Share Forecast Outlook 2025 to 2035
Green Cement Market Size and Share Forecast Outlook 2025 to 2035
Ammonia Cracking Membrane Reactor Market Size and Share Forecast Outlook 2025 to 2035
Green Power Market Size and Share Forecast Outlook 2025 to 2035
Green Chemicals Market Size and Share Forecast Outlook 2025 to 2035
Green Power Transformer Market Size and Share Forecast Outlook 2025 to 2035
Green Preservatives Market Size and Share Forecast Outlook 2025 to 2035
Green Tea Supplements Market Analysis - Size, Share, and Forecast 2025 to 2035
Green Data Center Market Size and Share Forecast Outlook 2025 to 2035
Green Logistics Market Size and Share Forecast Outlook 2025 to 2035
Green Methanol Market Size and Share Forecast Outlook 2025 to 2035
Green Technology And Sustainability Market Size and Share Forecast Outlook 2025 to 2035
Greenwrap Market Analysis - Size, Share, and Forecast Outlook 2025 to 2035
Green Coatings Market Analysis by Technology, Application, and Region Forecast through 2035
Green Building Materials Market Analysis by Type, Application, End-user and Region: Forecast for 2025 and 2035
Green UPS Market - Trends & Forecast 2025 to 2035
Green Tire Market Growth – Trends & Forecast 2025 to 2035
Green Tea Extracts Market Analysis – Size, Share & Forecast 2025 to 2035
Green Banana Flour Market Analysis - Growth & Demand 2025 to 2035

Thank you!
You will receive an email from our Business Development Manager. Please be sure to check your SPAM/JUNK folder too.
Chat With
MaRIA