Blood Glucose Monitoring Devices Market Size and Share Forecast Outlook 2025 to 2035

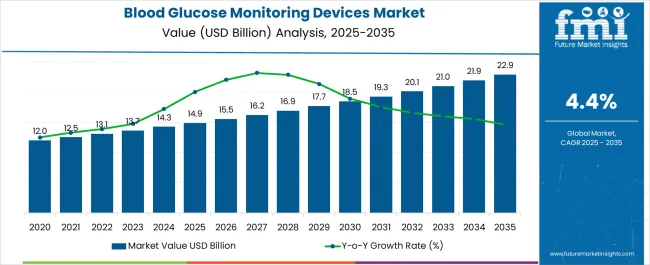
The Blood Glucose Monitoring Devices Market is estimated to be valued at USD 14.9 billion in 2025 and is projected to reach USD 22.9 billion by 2035, registering a compound annual growth rate (CAGR) of 4.4% over the forecast period.
Quick Stats for Blood Glucose Monitoring Devices Market

  • Blood Glucose Monitoring Devices Market Industry Value (2025): USD 14.9 billion
  • Blood Glucose Monitoring Devices Market Forecast Value (2035): USD 22.9 billion
  • Blood Glucose Monitoring Devices Market Forecast CAGR: 4.4%
  • Leading Segment in Blood Glucose Monitoring Devices Market in 2025: Self-Monitoring Device (61.3%)
  • Key Growth Region in Blood Glucose Monitoring Devices Market: North America, Asia-Pacific, Europe
  • Top Key Players in Blood Glucose Monitoring Devices Market: Abbott Laboratories, ARKRAY, Inc., Bayer AG; Medtronic plc, F. Hoffmann-La Roche Ltd., Johnson & Johnson, Ascensia Diabetes Care, Nipro Diagnostics, Inc., Dexcom, Inc., Sanofi, Terumo Medical Corporation, Novo Nordisk, Ypsomed Holdings, Prodigy Diabetes Care, LLC, GlySens Incorporated, ACON Laboratories, Nova Biomedical, Medtronic, Dexcom, Inc., LifeScan IP Holdings, LLC, Senseonics

Blood Glucose Monitoring Devices Market Market Value Analysis

Metric Value
Blood Glucose Monitoring Devices Market Estimated Value in (2025 E) USD 14.9 billion
Blood Glucose Monitoring Devices Market Forecast Value in (2035 F) USD 22.9 billion
Forecast CAGR (2025 to 2035) 4.4%

Rationale for Segmental Growth in the Blood Glucose Monitoring Devices Market

The blood glucose monitoring devices market is expanding steadily as the prevalence of diabetes continues to rise globally. Growth is being driven by increasing awareness of diabetes management, expanding patient education programs, and improvements in device technology that support accuracy and convenience.

The current scenario reflects strong adoption of both self-monitoring and continuous monitoring systems, supported by healthcare initiatives encouraging regular blood glucose tracking. Regulatory approvals and reimbursement frameworks are enhancing access, while the entry of advanced digital health platforms is fostering integration with mobile and cloud-based ecosystems.

The future outlook is defined by innovation in minimally invasive and non-invasive modalities, alongside the growing demand for portable devices that offer real-time insights and patient autonomy Growth rationale is supported by the necessity of ongoing monitoring in chronic disease management, rising healthcare expenditures, and the ability of manufacturers to deliver compact, user-friendly, and connected devices, which collectively position the market for sustained expansion and broader adoption across both developed and emerging regions.
Segmental Analysis

Insights into the Product Segment

Blood Glucose Monitoring Devices Market Analysis By Product

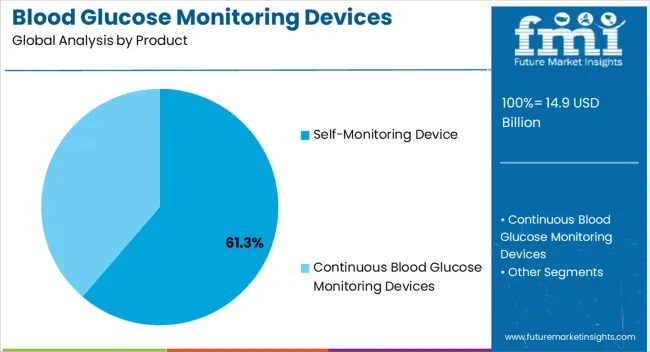
The self-monitoring device segment, accounting for 61.30% of the product category, has maintained its lead due to its affordability, accessibility, and ease of use. Adoption has been driven by its ability to provide quick results that support daily diabetes management. The segment benefits from widespread distribution through pharmacies and retail channels, ensuring availability for both urban and rural populations.

Technological improvements in test strips, lancets, and compact meters have enhanced accuracy and user confidence. Cost-effectiveness compared to continuous monitoring systems has reinforced market preference, particularly in developing economies where affordability plays a critical role.

Integration with digital platforms and mobile applications has further improved patient compliance and engagement These advantages have solidified the position of self-monitoring devices as the dominant product type in the blood glucose monitoring devices market.
Insights into the Usage Segment

Blood Glucose Monitoring Devices Market Analysis By Usage

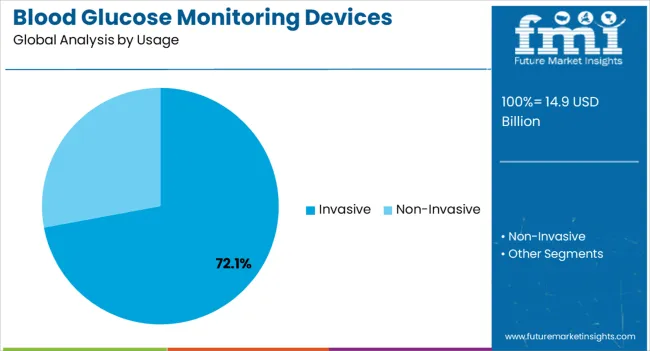
The invasive segment, representing 72.10% of the usage category, continues to dominate due to its long-standing presence and clinical reliability. Its market share has been sustained by consistent demand for conventional testing methods, which remain widely prescribed by healthcare providers.

Invasive devices are supported by established reimbursement systems and regulatory approvals, ensuring continued trust among patients and clinicians. Technological refinements have minimized discomfort and improved ease of sampling, enhancing patient adherence to testing protocols.

Cost advantages compared to emerging non-invasive alternatives have reinforced adoption across a broad patient base While innovation in non-invasive technologies is progressing, invasive devices are expected to remain the primary choice in the near term due to their proven accuracy, affordability, and widespread clinical acceptance.
Insights into the Modality Segment

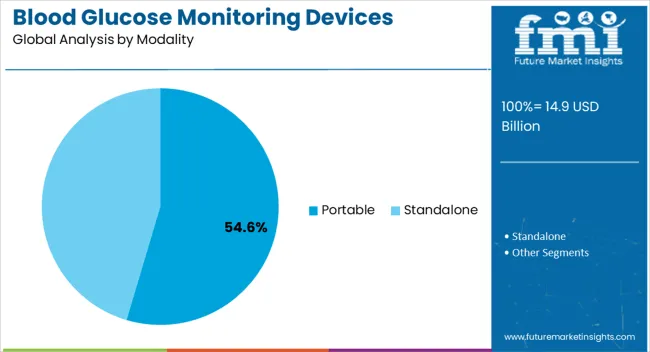
Blood Glucose Monitoring Devices Market Analysis By Modality

The portable segment, holding 54.60% of the modality category, has been leading the market due to rising demand for compact and user-friendly devices that support on-the-go monitoring. Its growth is supported by increasing lifestyle-related diabetes cases and the need for continuous monitoring outside clinical settings.

Advances in portability, combined with Bluetooth connectivity and integration with health apps, have strengthened user engagement and compliance. Distribution through retail, hospital, and e-commerce channels has expanded access, driving adoption across diverse demographics.

Cost competitiveness compared to wearable continuous monitors has made portable devices a practical solution for daily glucose management Ongoing innovation in miniaturization, accuracy, and connectivity is expected to sustain the segment’s dominance, ensuring portable devices remain a cornerstone of the blood glucose monitoring devices market.

Sales Trend Analysis from 2020 to 2025 Compared to Market Outlook for 2025 to 2035

  • Blood glucose monitoring equipment will continue to be in high demand, least affected by any industry margin compressions. The preference for these devices is growing for monitoring the blood glucose level. This is a major factor in increasing the production of blood glucose monitoring devices.
  • A wide number of healthcare facilities utilize continuous blood glucose monitoring devices (CGMs), to reduce the frequency of POCT testing associated with blood glucose monitoring.

Top Blood Glucose Monitoring Devices Market Dynamics and Industry Trends

CAGR from 2020 to 2025 5.0%
CAGR from 2025 to 2035 4.9%
  • The COVID-19 outbreak has necessitated the use of continuous blood glucose monitoring devices (CGMs) to reduce the amount of nursing exposure to COVID-19 patients with diabetes.
  • The time needed to obtain blood glucose measurements, and the amount of personal protective equipment needed for interacting with patients during the blood glucose testing can all be reduced by using continuous blood glucose monitoring devices to replace assisted monitoring of blood glucose by bedside nurses.
  • The use of telemedicine during the COVID-19 lockdown for diabetes management increased the use of blood glucose monitoring devices thus propelling the market growth.
  • Growing number of diabetic patients might be attributed in part to the global population's dietary habits and lifestyle patterns. Increased consumption of junk food, alcohol and a sedentary lifestyle all contribute to the rise in diabetes cases.

Lucrative Opportunities Driving Demand Growth in the Blood Glucose Monitoring Devices Market

  • The demand for blood glucose monitoring devices is being boosted by the significant expansion in the diabetic population and ongoing technological improvements in blood glucose monitoring devices.
  • Before, type 2 diabetes was only found in adults, but it is becoming increasingly common in kids as well. Monitoring blood glucose levels is becoming more and more important with its increasing prevalence in children.
  • The rising prevalence of gestational diabetes in women. Complications during pregnancy and delivery are more likely in women with gestational diabetes. Hence, these factors are opening opportunities for the growth of the blood glucose monitoring devices market.

Factors Restraining the Demand for Blood Glucose Monitoring Devices

  • The fact that a significant portion of the population has undiagnosed diabetes is one of the major reasons blood glucose monitoring systems are not used as frequently as they should be, particularly in emerging economies.
  • The chronic disorders such as diabetes mellitus are not well-known to the general population. Expansion may also be hampered by the absence of standard operating procedures by public or commercial entities as well as by limited access to advanced healthcare infrastructure.

Analysis of Top Countries Prescribing,Distributing,Monitoring,and Adopting Blood Glucose Monitoring Devices

Countries 2035 Value CAGR in Global Market
United States 3.9%
United Kingdom 3.8%
China 4.8%
Germany 4.1%

Blood Glucose Monitoring Device Market in China

  • The market will rise as a result of increased product accessibility, more consumer awareness, and business expansion by industry participants across the nation.
  • Government programmes and efforts to raise awareness of diabetes management will spur business growth. For instance, the "National diabetes programme" (WDF02-036) initiative in China, which is supported by the World diabetes foundation (WDF), is focused on those who have diabetes by emphasising treatment and capacity building across the country's healthcare system.

Blood Glucose Monitoring Devices Market in the United States

  • Rising cases of obesity are one of the main causes of type 2 diabetes in the population of the USA According to the Centres for Disease Control and Prevention, the obesity prevalence rate in the United States from 2020 to March 2024 was 41.7%.
  • According to an estimate provided by the CDC in 2024, 14.3 million new cases of diabetes were diagnosed in the USA This is a prime driver for the production of blood glucose monitoring devices within the country.

Blood Glucose Monitoring Devices Market in Germany

  • The market is driven by the strict regulation of the price and reimbursement policies. For instance, Germany's Federal Joint Committee provided Dexcom with reimbursement for its continuous glucose monitoring system for patients with insulin-dependent type 1 and type 2 diabetes.
  • The companies in the diabetes care device market, some of the potential opportunities include the introduction of numerous new products and an increase in international research collaborations for technological advancement.

Blood Glucose Monitoring Devices Market in the United Kingdom

  • Increasing awareness of blood glucose management in individuals is expected to drive the market in the region. Furthermore, a growing understanding of the link between blood glucose levels and chronic diseases is expected to create significant opportunities for the market in the forecast period.

Blood Glucose Monitoring Devices Industry Analysis by Top Investment Segments

Attributes Details
By Product Type Self-Monitoring Devices
Market Share in 2025 71.4%
  • Self-monitoring devices are expected to present a growth at a CAGR rate of 4.5% by the end of the forecast period, with a market share of about 71.4% in the global market in 2025.
  • Self-monitoring has simplified the process of using routine blood tests to evaluate diabetes control and notify of changes to improve control.
  • Technology-enhanced self-monitoring is considered safe and effective at producing positive health results.
Attributes Details
By Distribution Channel Retail Pharmacy
Market Share in 2025 38.2%
  • Retail pharmacies hold the greatest portion of the distribution channel segment with a market share of 38.2% in 2025, owing to the fact that retail pharmacies offer a variety of options for blood glucose monitoring devices.
  • The retail pharmacies are easily accessible and hence preferred by consumers for the purchase of blood glucose monitoring devices.

Leading Suppliers of Blood Glucose Monitoring Devices

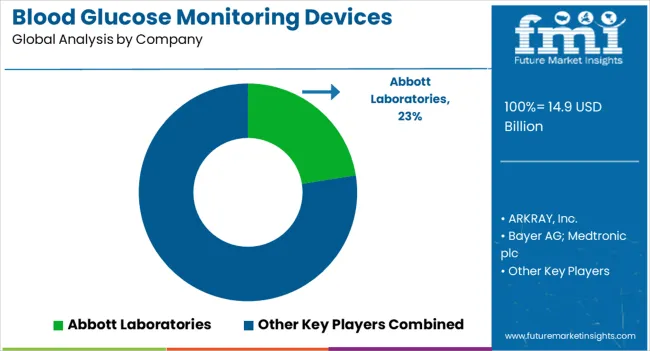
Blood Glucose Monitoring Devices Market Analysis By Company

To meet consumer demand and expand their customer base, major players are concentrating on new product launches, regulatory approvals, acquisitions, improvements in current products & technologies, and other methods to increase their business portfolio & fortify their presence.

Recent developments

  • In June 2025, Abbott announced the development of new bio-wearable to monitor ketone and glucose levels continuously in one sensor. The system has received the USA FDA breakthrough device designation.
  • In November 2024, Intuity Medical announced the launch of the POGO Automatic Blood Glucose Monitoring System which is the first blood glucose monitor that performs automatic testing. This device automatically lances and collects blood to check the blood glucose level.

Similarly, recent developments related to companies manufacturing blood glucose monitoring device products have been tracked by the team at Future Market Insights, which are available in the full report.

Top Segments Studied in the Blood Glucose Monitoring Devices Market Report

By Product:

  • Self-monitoring device
  • Continuous blood glucose monitoring devices

By Usage:

  • Non-invasive
  • Invasive

By Modality:

  • Standalone
  • Portable

By Indication:

  • Type 1
  • Type 2
  • Gestational Diabetes

By Distribution Channel:

  • Retail Pharmacy
  • Hospital Pharmacy
  • Diagnostic Centres
  • Online Sales

By Region:

  • North America
  • Latin America
  • Western Europe
  • Eastern Europe
  • Asia Pacific Excluding Japan (APEJ)
  • Japan
  • Middle East & Africa

Frequently Asked Questions

How big is the blood glucose monitoring devices market in 2025?

The global blood glucose monitoring devices market is estimated to be valued at USD 14.9 billion in 2025.

What will be the size of blood glucose monitoring devices market in 2035?

The market size for the blood glucose monitoring devices market is projected to reach USD 22.9 billion by 2035.

How much will be the blood glucose monitoring devices market growth between 2025 and 2035?

The blood glucose monitoring devices market is expected to grow at a 4.4% CAGR between 2025 and 2035.

What are the key product types in the blood glucose monitoring devices market?

The key product types in blood glucose monitoring devices market are self-monitoring device and continuous blood glucose monitoring devices.

Which usage segment to contribute significant share in the blood glucose monitoring devices market in 2025?

In terms of usage, invasive segment to command 72.1% share in the blood glucose monitoring devices market in 2025.

Table of Content

  1. Executive Summary
    • Global Market Outlook
    • Demand-side Trends
    • Supply-side Trends
    • Technology Roadmap Analysis
    • Analysis and Recommendations
  2. Market Overview
    • Market Coverage / Taxonomy
    • Market Definition / Scope / Limitations
  3. Market Background
    • Market Dynamics
      • Drivers
      • Restraints
      • Opportunity
      • Trends
    • Scenario Forecast
      • Demand in Optimistic Scenario
      • Demand in Likely Scenario
      • Demand in Conservative Scenario
    • Opportunity Map Analysis
    • Product Life Cycle Analysis
    • Supply Chain Analysis
    • Investment Feasibility Matrix
    • Value Chain Analysis
    • PESTLE and Porter’s Analysis
    • Regulatory Landscape
    • Regional Parent Market Outlook
    • Production and Consumption Statistics
    • Import and Export Statistics
  4. Global Market Analysis 2020 to 2024 and Forecast, 2025 to 2035
    • Historical Market Size Value (USD Million) Analysis, 2020 to 2024
    • Current and Future Market Size Value (USD Million) Projections, 2025 to 2035
      • Y-o-Y Growth Trend Analysis
      • Absolute $ Opportunity Analysis
  5. Global Market Pricing Analysis 2020 to 2024 and Forecast 2025 to 2035
  6. Global Market Analysis 2020 to 2024 and Forecast 2025 to 2035, By Product
    • Introduction / Key Findings
    • Historical Market Size Value (USD Million) Analysis By Product , 2020 to 2024
    • Current and Future Market Size Value (USD Million) Analysis and Forecast By Product , 2025 to 2035
      • Self-Monitoring Device
      • Continuous Blood Glucose Monitoring Devices
    • Y-o-Y Growth Trend Analysis By Product , 2020 to 2024
    • Absolute $ Opportunity Analysis By Product , 2025 to 2035
  7. Global Market Analysis 2020 to 2024 and Forecast 2025 to 2035, By Usage
    • Introduction / Key Findings
    • Historical Market Size Value (USD Million) Analysis By Usage, 2020 to 2024
    • Current and Future Market Size Value (USD Million) Analysis and Forecast By Usage, 2025 to 2035
      • Invasive
      • Non-Invasive
    • Y-o-Y Growth Trend Analysis By Usage, 2020 to 2024
    • Absolute $ Opportunity Analysis By Usage, 2025 to 2035
  8. Global Market Analysis 2020 to 2024 and Forecast 2025 to 2035, By Modality
    • Introduction / Key Findings
    • Historical Market Size Value (USD Million) Analysis By Modality, 2020 to 2024
    • Current and Future Market Size Value (USD Million) Analysis and Forecast By Modality, 2025 to 2035
      • Portable
      • Standalone
    • Y-o-Y Growth Trend Analysis By Modality, 2020 to 2024
    • Absolute $ Opportunity Analysis By Modality, 2025 to 2035
  9. Global Market Analysis 2020 to 2024 and Forecast 2025 to 2035, By Indication
    • Introduction / Key Findings
    • Historical Market Size Value (USD Million) Analysis By Indication, 2020 to 2024
    • Current and Future Market Size Value (USD Million) Analysis and Forecast By Indication, 2025 to 2035
      • Type 2
      • Type 1
      • Gestational Diabetes
    • Y-o-Y Growth Trend Analysis By Indication, 2020 to 2024
    • Absolute $ Opportunity Analysis By Indication, 2025 to 2035
  10. Global Market Analysis 2020 to 2024 and Forecast 2025 to 2035, By Distribution Channel
    • Introduction / Key Findings
    • Historical Market Size Value (USD Million) Analysis By Distribution Channel, 2020 to 2024
    • Current and Future Market Size Value (USD Million) Analysis and Forecast By Distribution Channel, 2025 to 2035
      • Retail Pharmacy
      • Hospital Pharmacy
      • Diagnostic Centres
      • Online Sales
    • Y-o-Y Growth Trend Analysis By Distribution Channel, 2020 to 2024
    • Absolute $ Opportunity Analysis By Distribution Channel, 2025 to 2035
  11. Global Market Analysis 2020 to 2024 and Forecast 2025 to 2035, By Region
    • Introduction
    • Historical Market Size Value (USD Million) Analysis By Region, 2020 to 2024
    • Current Market Size Value (USD Million) Analysis and Forecast By Region, 2025 to 2035
      • North America
      • Latin America
      • Western Europe
      • Eastern Europe
      • East Asia
      • South Asia and Pacific
      • Middle East & Africa
    • Market Attractiveness Analysis By Region
  12. North America Market Analysis 2020 to 2024 and Forecast 2025 to 2035, By Country
    • Historical Market Size Value (USD Million) Trend Analysis By Market Taxonomy, 2020 to 2024
    • Market Size Value (USD Million) Forecast By Market Taxonomy, 2025 to 2035
      • By Country
        • USA
        • Canada
        • Mexico
      • By Product
      • By Usage
      • By Modality
      • By Indication
      • By Distribution Channel
    • Market Attractiveness Analysis
      • By Country
      • By Product
      • By Usage
      • By Modality
      • By Indication
      • By Distribution Channel
    • Key Takeaways
  13. Latin America Market Analysis 2020 to 2024 and Forecast 2025 to 2035, By Country
    • Historical Market Size Value (USD Million) Trend Analysis By Market Taxonomy, 2020 to 2024
    • Market Size Value (USD Million) Forecast By Market Taxonomy, 2025 to 2035
      • By Country
        • Brazil
        • Chile
        • Rest of Latin America
      • By Product
      • By Usage
      • By Modality
      • By Indication
      • By Distribution Channel
    • Market Attractiveness Analysis
      • By Country
      • By Product
      • By Usage
      • By Modality
      • By Indication
      • By Distribution Channel
    • Key Takeaways
  14. Western Europe Market Analysis 2020 to 2024 and Forecast 2025 to 2035, By Country
    • Historical Market Size Value (USD Million) Trend Analysis By Market Taxonomy, 2020 to 2024
    • Market Size Value (USD Million) Forecast By Market Taxonomy, 2025 to 2035
      • By Country
        • Germany
        • UK
        • Italy
        • Spain
        • France
        • Nordic
        • BENELUX
        • Rest of Western Europe
      • By Product
      • By Usage
      • By Modality
      • By Indication
      • By Distribution Channel
    • Market Attractiveness Analysis
      • By Country
      • By Product
      • By Usage
      • By Modality
      • By Indication
      • By Distribution Channel
    • Key Takeaways
  15. Eastern Europe Market Analysis 2020 to 2024 and Forecast 2025 to 2035, By Country
    • Historical Market Size Value (USD Million) Trend Analysis By Market Taxonomy, 2020 to 2024
    • Market Size Value (USD Million) Forecast By Market Taxonomy, 2025 to 2035
      • By Country
        • Russia
        • Poland
        • Hungary
        • Balkan & Baltic
        • Rest of Eastern Europe
      • By Product
      • By Usage
      • By Modality
      • By Indication
      • By Distribution Channel
    • Market Attractiveness Analysis
      • By Country
      • By Product
      • By Usage
      • By Modality
      • By Indication
      • By Distribution Channel
    • Key Takeaways
  16. East Asia Market Analysis 2020 to 2024 and Forecast 2025 to 2035, By Country
    • Historical Market Size Value (USD Million) Trend Analysis By Market Taxonomy, 2020 to 2024
    • Market Size Value (USD Million) Forecast By Market Taxonomy, 2025 to 2035
      • By Country
        • China
        • Japan
        • South Korea
      • By Product
      • By Usage
      • By Modality
      • By Indication
      • By Distribution Channel
    • Market Attractiveness Analysis
      • By Country
      • By Product
      • By Usage
      • By Modality
      • By Indication
      • By Distribution Channel
    • Key Takeaways
  17. South Asia and Pacific Market Analysis 2020 to 2024 and Forecast 2025 to 2035, By Country
    • Historical Market Size Value (USD Million) Trend Analysis By Market Taxonomy, 2020 to 2024
    • Market Size Value (USD Million) Forecast By Market Taxonomy, 2025 to 2035
      • By Country
        • India
        • ASEAN
        • Australia & New Zealand
        • Rest of South Asia and Pacific
      • By Product
      • By Usage
      • By Modality
      • By Indication
      • By Distribution Channel
    • Market Attractiveness Analysis
      • By Country
      • By Product
      • By Usage
      • By Modality
      • By Indication
      • By Distribution Channel
    • Key Takeaways
  18. Middle East & Africa Market Analysis 2020 to 2024 and Forecast 2025 to 2035, By Country
    • Historical Market Size Value (USD Million) Trend Analysis By Market Taxonomy, 2020 to 2024
    • Market Size Value (USD Million) Forecast By Market Taxonomy, 2025 to 2035
      • By Country
        • Kingdom of Saudi Arabia
        • Other GCC Countries
        • Turkiye
        • South Africa
        • Other African Union
        • Rest of Middle East & Africa
      • By Product
      • By Usage
      • By Modality
      • By Indication
      • By Distribution Channel
    • Market Attractiveness Analysis
      • By Country
      • By Product
      • By Usage
      • By Modality
      • By Indication
      • By Distribution Channel
    • Key Takeaways
  19. Key Countries Market Analysis
    • USA
      • Pricing Analysis
      • Market Share Analysis, 2024
        • By Product
        • By Usage
        • By Modality
        • By Indication
        • By Distribution Channel
    • Canada
      • Pricing Analysis
      • Market Share Analysis, 2024
        • By Product
        • By Usage
        • By Modality
        • By Indication
        • By Distribution Channel
    • Mexico
      • Pricing Analysis
      • Market Share Analysis, 2024
        • By Product
        • By Usage
        • By Modality
        • By Indication
        • By Distribution Channel
    • Brazil
      • Pricing Analysis
      • Market Share Analysis, 2024
        • By Product
        • By Usage
        • By Modality
        • By Indication
        • By Distribution Channel
    • Chile
      • Pricing Analysis
      • Market Share Analysis, 2024
        • By Product
        • By Usage
        • By Modality
        • By Indication
        • By Distribution Channel
    • Germany
      • Pricing Analysis
      • Market Share Analysis, 2024
        • By Product
        • By Usage
        • By Modality
        • By Indication
        • By Distribution Channel
    • UK
      • Pricing Analysis
      • Market Share Analysis, 2024
        • By Product
        • By Usage
        • By Modality
        • By Indication
        • By Distribution Channel
    • Italy
      • Pricing Analysis
      • Market Share Analysis, 2024
        • By Product
        • By Usage
        • By Modality
        • By Indication
        • By Distribution Channel
    • Spain
      • Pricing Analysis
      • Market Share Analysis, 2024
        • By Product
        • By Usage
        • By Modality
        • By Indication
        • By Distribution Channel
    • France
      • Pricing Analysis
      • Market Share Analysis, 2024
        • By Product
        • By Usage
        • By Modality
        • By Indication
        • By Distribution Channel
    • India
      • Pricing Analysis
      • Market Share Analysis, 2024
        • By Product
        • By Usage
        • By Modality
        • By Indication
        • By Distribution Channel
    • ASEAN
      • Pricing Analysis
      • Market Share Analysis, 2024
        • By Product
        • By Usage
        • By Modality
        • By Indication
        • By Distribution Channel
    • Australia & New Zealand
      • Pricing Analysis
      • Market Share Analysis, 2024
        • By Product
        • By Usage
        • By Modality
        • By Indication
        • By Distribution Channel
    • China
      • Pricing Analysis
      • Market Share Analysis, 2024
        • By Product
        • By Usage
        • By Modality
        • By Indication
        • By Distribution Channel
    • Japan
      • Pricing Analysis
      • Market Share Analysis, 2024
        • By Product
        • By Usage
        • By Modality
        • By Indication
        • By Distribution Channel
    • South Korea
      • Pricing Analysis
      • Market Share Analysis, 2024
        • By Product
        • By Usage
        • By Modality
        • By Indication
        • By Distribution Channel
    • Russia
      • Pricing Analysis
      • Market Share Analysis, 2024
        • By Product
        • By Usage
        • By Modality
        • By Indication
        • By Distribution Channel
    • Poland
      • Pricing Analysis
      • Market Share Analysis, 2024
        • By Product
        • By Usage
        • By Modality
        • By Indication
        • By Distribution Channel
    • Hungary
      • Pricing Analysis
      • Market Share Analysis, 2024
        • By Product
        • By Usage
        • By Modality
        • By Indication
        • By Distribution Channel
    • Kingdom of Saudi Arabia
      • Pricing Analysis
      • Market Share Analysis, 2024
        • By Product
        • By Usage
        • By Modality
        • By Indication
        • By Distribution Channel
    • Turkiye
      • Pricing Analysis
      • Market Share Analysis, 2024
        • By Product
        • By Usage
        • By Modality
        • By Indication
        • By Distribution Channel
    • South Africa
      • Pricing Analysis
      • Market Share Analysis, 2024
        • By Product
        • By Usage
        • By Modality
        • By Indication
        • By Distribution Channel
  20. Market Structure Analysis
    • Competition Dashboard
    • Competition Benchmarking
    • Market Share Analysis of Top Players
      • By Regional
      • By Product
      • By Usage
      • By Modality
      • By Indication
      • By Distribution Channel
  21. Competition Analysis
    • Competition Deep Dive
      • Abbott Laboratories
        • Overview
        • Product Portfolio
        • Profitability by Market Segments (Product/Age /Sales Channel/Region)
        • Sales Footprint
        • Strategy Overview
          • Marketing Strategy
          • Product Strategy
          • Channel Strategy
      • ARKRAY, Inc.
      • Bayer AG; Medtronic plc
      • F. Hoffmann-La Roche Ltd.
      • Johnson & Johnson
      • Ascensia Diabetes Care
      • Nipro Diagnostics, Inc.
      • Dexcom, Inc.
      • Sanofi
      • Terumo Medical Corporation
      • Novo Nordisk
      • Ypsomed Holdings
      • Prodigy Diabetes Care, LLC
      • GlySens Incorporated
      • ACON Laboratories
      • Nova Biomedical
      • Medtronic
      • Dexcom, Inc.
      • LifeScan IP Holdings, LLC
      • Senseonics
  22. Assumptions & Acronyms Used
  23. Research Methodology

List of Tables

  • Table 1: Global Market Value (USD Million) Forecast by Region, 2020-2035
  • Table 2: Global Market Value (USD Million) Forecast by Product , 2020-2035
  • Table 3: Global Market Value (USD Million) Forecast by Usage, 2020-2035
  • Table 4: Global Market Value (USD Million) Forecast by Modality, 2020-2035
  • Table 5: Global Market Value (USD Million) Forecast by Indication, 2020-2035
  • Table 6: Global Market Value (USD Million) Forecast by Distribution Channel, 2020-2035
  • Table 7: North America Market Value (USD Million) Forecast by Country, 2020-2035
  • Table 8: North America Market Value (USD Million) Forecast by Product , 2020-2035
  • Table 9: North America Market Value (USD Million) Forecast by Usage, 2020-2035
  • Table 10: North America Market Value (USD Million) Forecast by Modality, 2020-2035
  • Table 11: North America Market Value (USD Million) Forecast by Indication, 2020-2035
  • Table 12: North America Market Value (USD Million) Forecast by Distribution Channel, 2020-2035
  • Table 13: Latin America Market Value (USD Million) Forecast by Country, 2020-2035
  • Table 14: Latin America Market Value (USD Million) Forecast by Product , 2020-2035
  • Table 15: Latin America Market Value (USD Million) Forecast by Usage, 2020-2035
  • Table 16: Latin America Market Value (USD Million) Forecast by Modality, 2020-2035
  • Table 17: Latin America Market Value (USD Million) Forecast by Indication, 2020-2035
  • Table 18: Latin America Market Value (USD Million) Forecast by Distribution Channel, 2020-2035
  • Table 19: Western Europe Market Value (USD Million) Forecast by Country, 2020-2035
  • Table 20: Western Europe Market Value (USD Million) Forecast by Product , 2020-2035
  • Table 21: Western Europe Market Value (USD Million) Forecast by Usage, 2020-2035
  • Table 22: Western Europe Market Value (USD Million) Forecast by Modality, 2020-2035
  • Table 23: Western Europe Market Value (USD Million) Forecast by Indication, 2020-2035
  • Table 24: Western Europe Market Value (USD Million) Forecast by Distribution Channel, 2020-2035
  • Table 25: Eastern Europe Market Value (USD Million) Forecast by Country, 2020-2035
  • Table 26: Eastern Europe Market Value (USD Million) Forecast by Product , 2020-2035
  • Table 27: Eastern Europe Market Value (USD Million) Forecast by Usage, 2020-2035
  • Table 28: Eastern Europe Market Value (USD Million) Forecast by Modality, 2020-2035
  • Table 29: Eastern Europe Market Value (USD Million) Forecast by Indication, 2020-2035
  • Table 30: Eastern Europe Market Value (USD Million) Forecast by Distribution Channel, 2020-2035
  • Table 31: East Asia Market Value (USD Million) Forecast by Country, 2020-2035
  • Table 32: East Asia Market Value (USD Million) Forecast by Product , 2020-2035
  • Table 33: East Asia Market Value (USD Million) Forecast by Usage, 2020-2035
  • Table 34: East Asia Market Value (USD Million) Forecast by Modality, 2020-2035
  • Table 35: East Asia Market Value (USD Million) Forecast by Indication, 2020-2035
  • Table 36: East Asia Market Value (USD Million) Forecast by Distribution Channel, 2020-2035
  • Table 37: South Asia and Pacific Market Value (USD Million) Forecast by Country, 2020-2035
  • Table 38: South Asia and Pacific Market Value (USD Million) Forecast by Product , 2020-2035
  • Table 39: South Asia and Pacific Market Value (USD Million) Forecast by Usage, 2020-2035
  • Table 40: South Asia and Pacific Market Value (USD Million) Forecast by Modality, 2020-2035
  • Table 41: South Asia and Pacific Market Value (USD Million) Forecast by Indication, 2020-2035
  • Table 42: South Asia and Pacific Market Value (USD Million) Forecast by Distribution Channel, 2020-2035
  • Table 43: Middle East & Africa Market Value (USD Million) Forecast by Country, 2020-2035
  • Table 44: Middle East & Africa Market Value (USD Million) Forecast by Product , 2020-2035
  • Table 45: Middle East & Africa Market Value (USD Million) Forecast by Usage, 2020-2035
  • Table 46: Middle East & Africa Market Value (USD Million) Forecast by Modality, 2020-2035
  • Table 47: Middle East & Africa Market Value (USD Million) Forecast by Indication, 2020-2035
  • Table 48: Middle East & Africa Market Value (USD Million) Forecast by Distribution Channel, 2020-2035

List of Figures

  • Figure 1: Global Market Pricing Analysis
  • Figure 2: Global Market Value (USD Million) Forecast 2020-2035
  • Figure 3: Global Market Value Share and BPS Analysis by Product , 2025 and 2035
  • Figure 4: Global Market Y-o-Y Growth Comparison by Product , 2025-2035
  • Figure 5: Global Market Attractiveness Analysis by Product
  • Figure 6: Global Market Value Share and BPS Analysis by Usage, 2025 and 2035
  • Figure 7: Global Market Y-o-Y Growth Comparison by Usage, 2025-2035
  • Figure 8: Global Market Attractiveness Analysis by Usage
  • Figure 9: Global Market Value Share and BPS Analysis by Modality, 2025 and 2035
  • Figure 10: Global Market Y-o-Y Growth Comparison by Modality, 2025-2035
  • Figure 11: Global Market Attractiveness Analysis by Modality
  • Figure 12: Global Market Value Share and BPS Analysis by Indication, 2025 and 2035
  • Figure 13: Global Market Y-o-Y Growth Comparison by Indication, 2025-2035
  • Figure 14: Global Market Attractiveness Analysis by Indication
  • Figure 15: Global Market Value Share and BPS Analysis by Distribution Channel, 2025 and 2035
  • Figure 16: Global Market Y-o-Y Growth Comparison by Distribution Channel, 2025-2035
  • Figure 17: Global Market Attractiveness Analysis by Distribution Channel
  • Figure 18: Global Market Value (USD Million) Share and BPS Analysis by Region, 2025 and 2035
  • Figure 19: Global Market Y-o-Y Growth Comparison by Region, 2025-2035
  • Figure 20: Global Market Attractiveness Analysis by Region
  • Figure 21: North America Market Incremental Dollar Opportunity, 2025-2035
  • Figure 22: Latin America Market Incremental Dollar Opportunity, 2025-2035
  • Figure 23: Western Europe Market Incremental Dollar Opportunity, 2025-2035
  • Figure 24: Eastern Europe Market Incremental Dollar Opportunity, 2025-2035
  • Figure 25: East Asia Market Incremental Dollar Opportunity, 2025-2035
  • Figure 26: South Asia and Pacific Market Incremental Dollar Opportunity, 2025-2035
  • Figure 27: Middle East & Africa Market Incremental Dollar Opportunity, 2025-2035
  • Figure 28: North America Market Value Share and BPS Analysis by Country, 2025 and 2035
  • Figure 29: North America Market Value Share and BPS Analysis by Product , 2025 and 2035
  • Figure 30: North America Market Y-o-Y Growth Comparison by Product , 2025-2035
  • Figure 31: North America Market Attractiveness Analysis by Product
  • Figure 32: North America Market Value Share and BPS Analysis by Usage, 2025 and 2035
  • Figure 33: North America Market Y-o-Y Growth Comparison by Usage, 2025-2035
  • Figure 34: North America Market Attractiveness Analysis by Usage
  • Figure 35: North America Market Value Share and BPS Analysis by Modality, 2025 and 2035
  • Figure 36: North America Market Y-o-Y Growth Comparison by Modality, 2025-2035
  • Figure 37: North America Market Attractiveness Analysis by Modality
  • Figure 38: North America Market Value Share and BPS Analysis by Indication, 2025 and 2035
  • Figure 39: North America Market Y-o-Y Growth Comparison by Indication, 2025-2035
  • Figure 40: North America Market Attractiveness Analysis by Indication
  • Figure 41: North America Market Value Share and BPS Analysis by Distribution Channel, 2025 and 2035
  • Figure 42: North America Market Y-o-Y Growth Comparison by Distribution Channel, 2025-2035
  • Figure 43: North America Market Attractiveness Analysis by Distribution Channel
  • Figure 44: Latin America Market Value Share and BPS Analysis by Country, 2025 and 2035
  • Figure 45: Latin America Market Value Share and BPS Analysis by Product , 2025 and 2035
  • Figure 46: Latin America Market Y-o-Y Growth Comparison by Product , 2025-2035
  • Figure 47: Latin America Market Attractiveness Analysis by Product
  • Figure 48: Latin America Market Value Share and BPS Analysis by Usage, 2025 and 2035
  • Figure 49: Latin America Market Y-o-Y Growth Comparison by Usage, 2025-2035
  • Figure 50: Latin America Market Attractiveness Analysis by Usage
  • Figure 51: Latin America Market Value Share and BPS Analysis by Modality, 2025 and 2035
  • Figure 52: Latin America Market Y-o-Y Growth Comparison by Modality, 2025-2035
  • Figure 53: Latin America Market Attractiveness Analysis by Modality
  • Figure 54: Latin America Market Value Share and BPS Analysis by Indication, 2025 and 2035
  • Figure 55: Latin America Market Y-o-Y Growth Comparison by Indication, 2025-2035
  • Figure 56: Latin America Market Attractiveness Analysis by Indication
  • Figure 57: Latin America Market Value Share and BPS Analysis by Distribution Channel, 2025 and 2035
  • Figure 58: Latin America Market Y-o-Y Growth Comparison by Distribution Channel, 2025-2035
  • Figure 59: Latin America Market Attractiveness Analysis by Distribution Channel
  • Figure 60: Western Europe Market Value Share and BPS Analysis by Country, 2025 and 2035
  • Figure 61: Western Europe Market Value Share and BPS Analysis by Product , 2025 and 2035
  • Figure 62: Western Europe Market Y-o-Y Growth Comparison by Product , 2025-2035
  • Figure 63: Western Europe Market Attractiveness Analysis by Product
  • Figure 64: Western Europe Market Value Share and BPS Analysis by Usage, 2025 and 2035
  • Figure 65: Western Europe Market Y-o-Y Growth Comparison by Usage, 2025-2035
  • Figure 66: Western Europe Market Attractiveness Analysis by Usage
  • Figure 67: Western Europe Market Value Share and BPS Analysis by Modality, 2025 and 2035
  • Figure 68: Western Europe Market Y-o-Y Growth Comparison by Modality, 2025-2035
  • Figure 69: Western Europe Market Attractiveness Analysis by Modality
  • Figure 70: Western Europe Market Value Share and BPS Analysis by Indication, 2025 and 2035
  • Figure 71: Western Europe Market Y-o-Y Growth Comparison by Indication, 2025-2035
  • Figure 72: Western Europe Market Attractiveness Analysis by Indication
  • Figure 73: Western Europe Market Value Share and BPS Analysis by Distribution Channel, 2025 and 2035
  • Figure 74: Western Europe Market Y-o-Y Growth Comparison by Distribution Channel, 2025-2035
  • Figure 75: Western Europe Market Attractiveness Analysis by Distribution Channel
  • Figure 76: Eastern Europe Market Value Share and BPS Analysis by Country, 2025 and 2035
  • Figure 77: Eastern Europe Market Value Share and BPS Analysis by Product , 2025 and 2035
  • Figure 78: Eastern Europe Market Y-o-Y Growth Comparison by Product , 2025-2035
  • Figure 79: Eastern Europe Market Attractiveness Analysis by Product
  • Figure 80: Eastern Europe Market Value Share and BPS Analysis by Usage, 2025 and 2035
  • Figure 81: Eastern Europe Market Y-o-Y Growth Comparison by Usage, 2025-2035
  • Figure 82: Eastern Europe Market Attractiveness Analysis by Usage
  • Figure 83: Eastern Europe Market Value Share and BPS Analysis by Modality, 2025 and 2035
  • Figure 84: Eastern Europe Market Y-o-Y Growth Comparison by Modality, 2025-2035
  • Figure 85: Eastern Europe Market Attractiveness Analysis by Modality
  • Figure 86: Eastern Europe Market Value Share and BPS Analysis by Indication, 2025 and 2035
  • Figure 87: Eastern Europe Market Y-o-Y Growth Comparison by Indication, 2025-2035
  • Figure 88: Eastern Europe Market Attractiveness Analysis by Indication
  • Figure 89: Eastern Europe Market Value Share and BPS Analysis by Distribution Channel, 2025 and 2035
  • Figure 90: Eastern Europe Market Y-o-Y Growth Comparison by Distribution Channel, 2025-2035
  • Figure 91: Eastern Europe Market Attractiveness Analysis by Distribution Channel
  • Figure 92: East Asia Market Value Share and BPS Analysis by Country, 2025 and 2035
  • Figure 93: East Asia Market Value Share and BPS Analysis by Product , 2025 and 2035
  • Figure 94: East Asia Market Y-o-Y Growth Comparison by Product , 2025-2035
  • Figure 95: East Asia Market Attractiveness Analysis by Product
  • Figure 96: East Asia Market Value Share and BPS Analysis by Usage, 2025 and 2035
  • Figure 97: East Asia Market Y-o-Y Growth Comparison by Usage, 2025-2035
  • Figure 98: East Asia Market Attractiveness Analysis by Usage
  • Figure 99: East Asia Market Value Share and BPS Analysis by Modality, 2025 and 2035
  • Figure 100: East Asia Market Y-o-Y Growth Comparison by Modality, 2025-2035
  • Figure 101: East Asia Market Attractiveness Analysis by Modality
  • Figure 102: East Asia Market Value Share and BPS Analysis by Indication, 2025 and 2035
  • Figure 103: East Asia Market Y-o-Y Growth Comparison by Indication, 2025-2035
  • Figure 104: East Asia Market Attractiveness Analysis by Indication
  • Figure 105: East Asia Market Value Share and BPS Analysis by Distribution Channel, 2025 and 2035
  • Figure 106: East Asia Market Y-o-Y Growth Comparison by Distribution Channel, 2025-2035
  • Figure 107: East Asia Market Attractiveness Analysis by Distribution Channel
  • Figure 108: South Asia and Pacific Market Value Share and BPS Analysis by Country, 2025 and 2035
  • Figure 109: South Asia and Pacific Market Value Share and BPS Analysis by Product , 2025 and 2035
  • Figure 110: South Asia and Pacific Market Y-o-Y Growth Comparison by Product , 2025-2035
  • Figure 111: South Asia and Pacific Market Attractiveness Analysis by Product
  • Figure 112: South Asia and Pacific Market Value Share and BPS Analysis by Usage, 2025 and 2035
  • Figure 113: South Asia and Pacific Market Y-o-Y Growth Comparison by Usage, 2025-2035
  • Figure 114: South Asia and Pacific Market Attractiveness Analysis by Usage
  • Figure 115: South Asia and Pacific Market Value Share and BPS Analysis by Modality, 2025 and 2035
  • Figure 116: South Asia and Pacific Market Y-o-Y Growth Comparison by Modality, 2025-2035
  • Figure 117: South Asia and Pacific Market Attractiveness Analysis by Modality
  • Figure 118: South Asia and Pacific Market Value Share and BPS Analysis by Indication, 2025 and 2035
  • Figure 119: South Asia and Pacific Market Y-o-Y Growth Comparison by Indication, 2025-2035
  • Figure 120: South Asia and Pacific Market Attractiveness Analysis by Indication
  • Figure 121: South Asia and Pacific Market Value Share and BPS Analysis by Distribution Channel, 2025 and 2035
  • Figure 122: South Asia and Pacific Market Y-o-Y Growth Comparison by Distribution Channel, 2025-2035
  • Figure 123: South Asia and Pacific Market Attractiveness Analysis by Distribution Channel
  • Figure 124: Middle East & Africa Market Value Share and BPS Analysis by Country, 2025 and 2035
  • Figure 125: Middle East & Africa Market Value Share and BPS Analysis by Product , 2025 and 2035
  • Figure 126: Middle East & Africa Market Y-o-Y Growth Comparison by Product , 2025-2035
  • Figure 127: Middle East & Africa Market Attractiveness Analysis by Product
  • Figure 128: Middle East & Africa Market Value Share and BPS Analysis by Usage, 2025 and 2035
  • Figure 129: Middle East & Africa Market Y-o-Y Growth Comparison by Usage, 2025-2035
  • Figure 130: Middle East & Africa Market Attractiveness Analysis by Usage
  • Figure 131: Middle East & Africa Market Value Share and BPS Analysis by Modality, 2025 and 2035
  • Figure 132: Middle East & Africa Market Y-o-Y Growth Comparison by Modality, 2025-2035
  • Figure 133: Middle East & Africa Market Attractiveness Analysis by Modality
  • Figure 134: Middle East & Africa Market Value Share and BPS Analysis by Indication, 2025 and 2035
  • Figure 135: Middle East & Africa Market Y-o-Y Growth Comparison by Indication, 2025-2035
  • Figure 136: Middle East & Africa Market Attractiveness Analysis by Indication
  • Figure 137: Middle East & Africa Market Value Share and BPS Analysis by Distribution Channel, 2025 and 2035
  • Figure 138: Middle East & Africa Market Y-o-Y Growth Comparison by Distribution Channel, 2025-2035
  • Figure 139: Middle East & Africa Market Attractiveness Analysis by Distribution Channel
  • Figure 140: Global Market - Tier Structure Analysis
  • Figure 141: Global Market - Company Share Analysis
Dashboard
Dashboard
Dashboard
Dashboard
Dashboard
Dashboard

Full Research Suite comprises of:

Market outlook & trends analysis

Market outlook & trends analysis

Interviews & case studies

Interviews & case studies

Strategic recommendations

Strategic recommendations

Vendor profiles & capabilities analysis

Vendor profiles & capabilities analysis

5-year forecasts

5-year forecasts

8 regions and 60+ country-level data splits

8 regions and 60+ country-level data splits

Market segment data splits

Market segment data splits

12 months of continuous data updates

12 months of continuous data updates

DELIVERED AS:

PDF EXCEL ONLINE

Full Research Suite


$5000

$7500

$10000

Buy Report Now
Similar Industry Reports

Similar Industry Reports

Non-Invasive Blood Glucose Monitoring Devices Market

Non-Invasive Blood Glucose Monitoring Devices Market Size and Share Forecast Outlook 2025 to 2035

Blood Gas Analyzers Market

Blood Gas Analyzers Market Size and Share Forecast Outlook 2025 to 2035

Blood Sugar Tester Market

Blood Sugar Tester Market Size and Share Forecast Outlook 2025 to 2035

Blood Flow Restriction Bands Market

Blood Flow Restriction Bands Market Size and Share Forecast Outlook 2025 to 2035

Blood-based Biomarker For Alzheimer's Disease Diagnostics Market

Blood-based Biomarker For Alzheimer's Disease Diagnostics Market Size and Share Forecast Outlook 2025 to 2035

Blood Bank Reagent Market

Blood Bank Reagent Market Size and Share Forecast Outlook 2025 to 2035

Blood Pressure Transducers Market

Blood Pressure Transducers Market Size and Share Forecast Outlook 2025 to 2035

Blood Culture Test Market

Blood Culture Test Market Size and Share Forecast Outlook 2025 to 2035

Blood Bag Tube Sealer Market

Blood Bag Tube Sealer Market Size and Share Forecast Outlook 2025 to 2035

Blood Bags Market
Blood Bags Market

Blood Bags Market Size and Share Forecast Outlook 2025 to 2035

Blood Temperature Indicator Market

Blood Temperature Indicator Market Size, Share & Forecast 2025 to 2035

Blood Testing Equipment Market

Blood Testing Equipment Market Growth - Trends & Forecast 2025 to 2035

Blood Coagulation Analyzers Market

Blood Coagulation Analyzers Market Growth – Trends & Forecast 2025 to 2035 

Blood Fluid Warming System Market

The Blood Fluid Warming System Market is segmented by product type, application, and end user from 2025 to 2035

Blood Cancer Treatment Market

Blood Cancer Treatment Market Growth – Trends & Forecast 2025 to 2035

Blood Volume Analyzer Market

Blood Volume Analyzer Market – Demand, Growth & Forecast 2025 to 2035

Blood Pressure Monitor Market

Blood Pressure Monitor Market Analysis by Product, Indication, End User and Region: Forecast for 2025 to 2035

Blood-based Biomarker Market Share Analysis

Key Players & Market Share in the Blood-Based Biomarker Industry

Blood Temperature Indicator Market Share Analysis

Competitive Landscape of Blood Temperature Indicator Providers

Blood Meal Market
Blood Meal Market

Blood Meal Market Analysis – Applications, Demand & Growth

Future Market Insights

Blood Glucose Monitoring Devices Market

Chat With MaRIA

Chat With

MaRIA

Hi There, I am MaRIA, Your Market Research Intelligence Assistant. How may I help you?