Non-Invasive Blood Glucose Monitoring Devices Market Size and Share Forecast Outlook 2025 to 2035

The Non-Invasive Blood Glucose Monitoring Devices Market is estimated to be valued at USD 9.3 billion in 2025 and is projected to reach USD 21.9 billion by 2035, registering a compound annual growth rate (CAGR) of 8.9% over the forecast period.
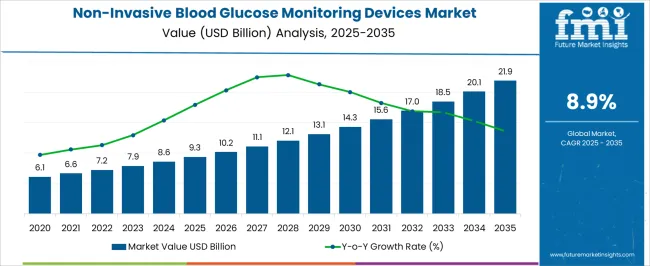
Quick Stats for Non-Invasive Blood Glucose Monitoring Devices Market

  • Non-Invasive Blood Glucose Monitoring Devices Market Value (2025): USD 9.3 billion
  • Non-Invasive Blood Glucose Monitoring Devices Market Forecast Value (2035): USD 21.9 billion
  • Non-Invasive Blood Glucose Monitoring Devices Market Forecast CAGR: 8.9%
  • Leading Segment in Non-Invasive Blood Glucose Monitoring Devices Market in 2025: MIR/NIR (Mid/Near Infrared Spectroscopy) (25.9%)
  • Key Growth Regions in Non-Invasive Blood Glucose Monitoring Devices Market: North America, Asia-Pacific, Europe
  • Top Key Players in Non-Invasive Blood Glucose Monitoring Devices Market: Abbott Laboratories, Dexcom Inc., Medtronic plc, Senseonics Holdings, Nemaura Medical, OrSense Ltd., DiaMonTech GmbH, MediWise / Occuity Ltd., Know Labs Inc., Integrity Applications (GlucoTrack), OptiScan Biomedical, CNOGA Medical, Biolinq Inc., Movano Health, Verily Life Sciences, GlucoSense Diagnostics, Apple Inc., Scanbo Corp., DiaMonTech GmbH, RSP Systems

Non Invasive Blood Glucose Monitoring Devices Market Market Value Analysis

Non-Invasive Blood Glucose Monitoring Devices Market Key Takeaways

Metric Value
Non-Invasive Blood Glucose Monitoring Devices Market Estimated Value in (2025 E) USD 9.3 billion
Non-Invasive Blood Glucose Monitoring Devices Market Forecast Value in (2035 F) USD 21.9 billion
Forecast CAGR (2025 to 2035) 8.9%

Why is the Non-Invasive Blood Glucose Monitoring Devices Market Growing?

The Non-Invasive Blood Glucose Monitoring Devices market is gaining rapid traction as the global burden of diabetes continues to increase and patients demand less painful, more convenient monitoring solutions. Traditional blood glucose testing methods that rely on finger pricking are associated with discomfort and low adherence, which has accelerated the shift toward non-invasive alternatives. Advancements in sensor technologies, including optical spectroscopy, electromagnetic sensing, and transdermal detection, are improving accuracy and reliability, making them more appealing to both patients and healthcare providers.

Wearable devices with wireless connectivity and integration into smartphones are further driving adoption, as they enable real-time monitoring and remote management by physicians. Growing awareness of preventive healthcare, along with the expansion of telemedicine, is also fueling demand.

Regulatory bodies are encouraging innovation in this space, and investment in research and development is steadily increasing As the need for continuous and user-friendly glucose monitoring rises, the market is positioned for robust growth, driven by technology-enabled convenience and patient-centric care.

Segmental Analysis

The non-invasive blood glucose monitoring devices market is segmented by technology, modality, end user, and geographic regions. By technology, non-invasive blood glucose monitoring devices market is divided into MIR/NIR (Mid/Near Infrared Spectroscopy), Raman Spectroscopy, Occlusion Spectroscopy, Optical Coherence Tomography, Thermal Emission Spectroscopy, Photoacoustic Spectroscopy, Impedance/Dielectric Spectroscopy, Electromagnetic, Polarimetry, and Fluorescence. In terms of modality, non-invasive blood glucose monitoring devices market is classified into Wearable Blood Glucose Monitoring Systems and Non-Wearable /Table Top Blood Glucose Monitoring Systems. Based on end user, non-invasive blood glucose monitoring devices market is segmented into Hospitals, Home Care Settings, and Clinics. Regionally, the non-invasive blood glucose monitoring devices industry is classified into North America, Latin America, Western Europe, Eastern Europe, Balkan & Baltic Countries, Russia & Belarus, Central Asia, East Asia, South Asia & Pacific, and the Middle East & Africa.
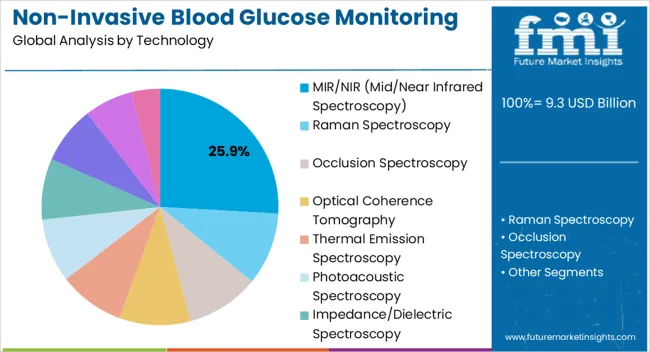
Insights into the MIR/NIR (Mid/Near Infrared Spectroscopy) Technology Segment

Non Invasive Blood Glucose Monitoring Devices Market Analysis By Technology

The MIR/NIR technology segment is expected to account for 25.9% of the market revenue in 2025, highlighting its significance among emerging non-invasive solutions. This technology is being adopted due to its ability to measure glucose concentrations through light absorption patterns in blood and interstitial fluids, offering reliable and pain-free testing. Ongoing advancements in miniaturized sensors and calibration algorithms are enhancing the precision and consistency of MIR/NIR-based devices, making them suitable for daily use by diabetic patients.

Manufacturers are focusing on integrating this technology into compact and cost-effective devices, enabling broader accessibility across both developed and emerging markets. The appeal of this segment is reinforced by its compatibility with wearable platforms, allowing real-time monitoring and seamless data transfer to healthcare providers.

As diabetes prevalence grows globally, the MIR/NIR segment is expected to play a critical role in addressing unmet needs for painless glucose monitoring The combination of technological innovation and increasing patient acceptance positions this segment for long-term growth.
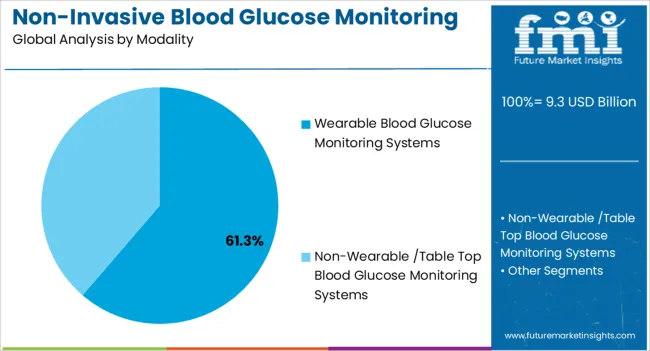
Insights into the Wearable Blood Glucose Monitoring Systems Modality Segment

Non Invasive Blood Glucose Monitoring Devices Market Analysis By Modality

The wearable blood glucose monitoring systems segment is projected to hold 61.3% of the market revenue in 2025, positioning it as the dominant modality. Growth in this segment is driven by the increasing demand for continuous glucose monitoring solutions that provide convenience and real-time insights. Wearable devices are being preferred by patients due to their ability to eliminate the need for frequent finger-prick testing, thereby improving compliance and quality of life.

Integration with mobile applications, cloud platforms, and telehealth services enables real-time data sharing and remote monitoring, empowering healthcare professionals to make timely interventions. The segment is also benefitting from lifestyle integration, as wearable designs are discreet, lightweight, and compatible with fitness ecosystems.

Additionally, the ability of wearable systems to deliver trend analysis and alerts for hypoglycemia or hyperglycemia enhances patient safety As healthcare shifts toward preventive management and patient empowerment, the wearable segment is expected to sustain its leadership, supported by innovation in device accuracy, comfort, and interoperability.
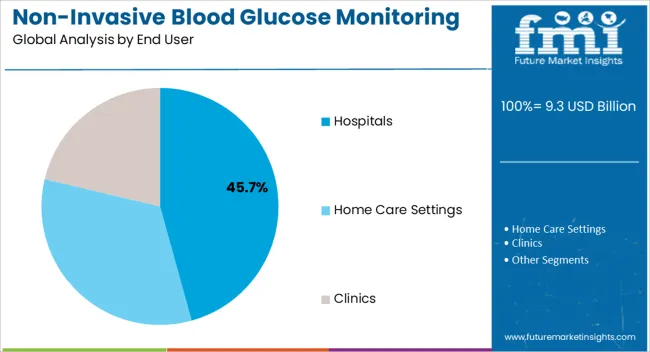
Insights into the Hospitals End User Segment

Non Invasive Blood Glucose Monitoring Devices Market Analysis By End User

The hospitals segment is anticipated to account for 45.7% of the market revenue in 2025, establishing itself as the leading end-user group. Growth in this segment is driven by the increasing adoption of advanced glucose monitoring technologies in inpatient and outpatient settings to improve diabetes management outcomes. Hospitals are leveraging non-invasive monitoring devices to reduce the burden on nursing staff, enhance patient comfort, and streamline continuous monitoring processes.

The ability to integrate these devices into hospital information systems and electronic health records allows for better clinical decision-making and treatment personalization. Hospitals are also serving as primary validation environments for new devices, accelerating clinical adoption and patient trust.

Growing investments in healthcare infrastructure, coupled with rising demand for real-time data accuracy in critical care and surgical settings, are further boosting adoption As diabetes care becomes a central focus of hospital-based chronic disease management programs, this segment is expected to remain the largest revenue contributor, supported by clinical reliability and institutional trust.

Market Overview

Non-Invasive Blood Glucose Monitoring Devices Market

Diabetes has evolved as one of the primary healthcare epidemic characterized by high sugar levels and principle cause of mortality worldwide. In 2025, World Health Organization (WHO) estimated 8.5% of adults living with diabetes. A diabetic person cannot either synthesize enough insulin (type 1 diabetes) or either does not make enough insulin or cannot effectively use the insulin produced by the body (type 2 diabetes).

Another type of diabetes that occur in women during her pregnancy is gestational diabetes. However, gestational diabetes is usually resolved after delivery but can precede towards type 2 diabetes later in a women’s life. Most of the continuous glucose monitoring devices are invasive and involves use of needles leading to increased chance of infection. Furthermore, the invasive glucose monitoring device is considered to be discrete glucose measurement system which cannot be practically used for continuous monitoring of blood glucose.

Certain evidences of hyperglycemia between measurements are however not recorded thus resulting in false or no representation of the blood glucose pattern. Noninvasive monitoring of glucose levels eliminates the need of painful pricking with increased risk of infection, and amount of damage caused to the finger tissue.

Therefore, non-invasive continuous glucose monitoring devices are being widely investigated and studied over the past few years for their ability to monitor glucose continuously under highly controlled (e.g. in-clinic) conditions. Various techniques that involves measurement of blood glucose levels non-invasively includes, Near Infrared Spectroscopy (NIRS), Mid -Infrared Spectroscopy (Mid-IRS), Raman Spectroscopy, Photo-acoustic Spectroscopy (PA), Optical Coherence Tomography (OCT) and many more.
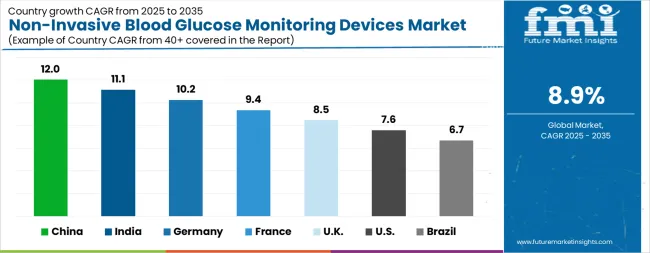
Analysis of Non-Invasive Blood Glucose Monitoring Devices Market By Key Countries

Non Invasive Blood Glucose Monitoring Devices Market Cagr Analysis By Country

Country CAGR
China 12.0%
India 11.1%
Germany 10.2%
France 9.4%
UK 8.5%
USA 7.6%
Brazil 6.7%

Country-wise Analysis

The Non-Invasive Blood Glucose Monitoring Devices Market is expected to register a CAGR of 8.9% during the forecast period, exhibiting varied country level momentum. China leads with the highest CAGR of 12.0%, followed by India at 11.1%. Developed markets such as Germany, France, and the UK continue to expand steadily, while the USA is likely to grow at consistent rates. Brazil posts the lowest CAGR at 6.7%, yet still underscores a broadly positive trajectory for the global Non-Invasive Blood Glucose Monitoring Devices Market. In 2024, Germany held a dominant revenue in the Western Europe market and is expected to grow with a CAGR of 10.2%. The USA Non-Invasive Blood Glucose Monitoring Devices Market is estimated to be valued at USD 3.2 billion in 2025 and is anticipated to reach a valuation of USD 6.7 billion by 2035. Sales are projected to rise at a CAGR of 7.6% over the forecast period between 2025 and 2035. While Japan and South Korea markets are estimated to be valued at USD 467.3 million and USD 267.2 million respectively in 2025.
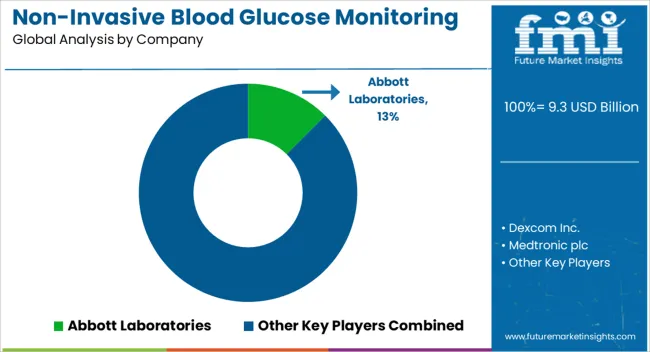
Key Players in the Non-Invasive Blood Glucose Monitoring Devices Market

Non Invasive Blood Glucose Monitoring Devices Market Analysis By Company

  • Abbott Laboratories
  • Dexcom Inc.
  • Medtronic plc
  • Senseonics Holdings
  • Nemaura Medical
  • OrSense Ltd.
  • DiaMonTech GmbH
  • MediWise / Occuity Ltd.
  • Know Labs Inc.
  • Integrity Applications (GlucoTrack)
  • OptiScan Biomedical
  • CNOGA Medical
  • Biolinq Inc.
  • Movano Health
  • Verily Life Sciences
  • GlucoSense Diagnostics
  • Apple Inc.
  • Scanbo Corp.
  • DiaMonTech GmbH
  • RSP Systems

Scope of the Report

Item Value
Quantitative Units USD 9.3 Billion
Technology MIR/NIR (Mid/Near Infrared Spectroscopy), Raman Spectroscopy, Occlusion Spectroscopy, Optical Coherence Tomography, Thermal Emission Spectroscopy, Photoacoustic Spectroscopy, Impedance/Dielectric Spectroscopy, Electromagnetic, Polarimetry, and Fluorescence
Modality Wearable Blood Glucose Monitoring Systems and Non-Wearable /Table Top Blood Glucose Monitoring Systems
End User Hospitals, Home Care Settings, and Clinics
Regions Covered North America, Europe, Asia-Pacific, Latin America, Middle East & Africa
Country Covered United States, Canada, Germany, France, United Kingdom, China, Japan, India, Brazil, South Africa
Key Companies Profiled Abbott Laboratories, Dexcom Inc., Medtronic plc, Senseonics Holdings, Nemaura Medical, OrSense Ltd., DiaMonTech GmbH, MediWise / Occuity Ltd., Know Labs Inc., Integrity Applications (GlucoTrack), OptiScan Biomedical, CNOGA Medical, Biolinq Inc., Movano Health, Verily Life Sciences, GlucoSense Diagnostics, Apple Inc., Scanbo Corp., DiaMonTech GmbH, and RSP Systems

Non-Invasive Blood Glucose Monitoring Devices Market by Segments

Technology:

  • MIR/NIR (Mid/Near Infrared Spectroscopy)
  • Raman Spectroscopy
  • Occlusion Spectroscopy
  • Optical Coherence Tomography
  • Thermal Emission Spectroscopy
  • Photoacoustic Spectroscopy
  • Impedance/Dielectric Spectroscopy
  • Electromagnetic
  • Polarimetry
  • Fluorescence

Modality:

  • Wearable Blood Glucose Monitoring Systems
  • Non-Wearable /Table Top Blood Glucose Monitoring Systems

End User:

  • Hospitals
  • Home Care Settings
  • Clinics

Region:

  • North America
    • USA
    • Canada
    • Mexico
  • Latin America
    • Brazil
    • Chile
    • Rest of Latin America
  • Western Europe
    • Germany
    • UK
    • Italy
    • Spain
    • France
    • Nordic
    • BENELUX
    • Rest of Western Europe
  • Eastern Europe
    • Russia
    • Poland
    • Hungary
    • Balkan & Baltic
    • Rest of Eastern Europe
  • East Asia
    • China
    • Japan
    • South Korea
  • South Asia and Pacific
    • India
    • ASEAN
    • Australia & New Zealand
    • Rest of South Asia and Pacific
  • Middle East & Africa
    • Kingdom of Saudi Arabia
    • Other GCC Countries
    • Turkiye
    • South Africa
    • Other African Union
    • Rest of Middle East & Africa

Table of Content

  1. Executive Summary
    • Global Market Outlook
    • Demand-side Trends
    • Supply-side Trends
    • Technology Roadmap Analysis
    • Analysis and Recommendations
  2. Market Overview
    • Market Coverage / Taxonomy
    • Market Definition / Scope / Limitations
  3. Market Background
    • Market Dynamics
      • Drivers
      • Restraints
      • Opportunity
      • Trends
    • Scenario Forecast
      • Demand in Optimistic Scenario
      • Demand in Likely Scenario
      • Demand in Conservative Scenario
    • Opportunity Map Analysis
    • Product Life Cycle Analysis
    • Supply Chain Analysis
    • Investment Feasibility Matrix
    • Value Chain Analysis
    • PESTLE and Porter’s Analysis
    • Regulatory Landscape
    • Regional Parent Market Outlook
    • Production and Consumption Statistics
    • Import and Export Statistics
  4. Global Market Analysis 2020 to 2024 and Forecast, 2025 to 2035
    • Historical Market Size Value (USD Million) Analysis, 2020 to 2024
    • Current and Future Market Size Value (USD Million) Projections, 2025 to 2035
      • Y-o-Y Growth Trend Analysis
      • Absolute $ Opportunity Analysis
  5. Global Market Pricing Analysis 2020 to 2024 and Forecast 2025 to 2035
  6. Global Market Analysis 2020 to 2024 and Forecast 2025 to 2035, By Technology
    • Introduction / Key Findings
    • Historical Market Size Value (USD Million) Analysis By Technology , 2020 to 2024
    • Current and Future Market Size Value (USD Million) Analysis and Forecast By Technology , 2025 to 2035
      • MIR/NIR (Mid/Near Infrared Spectroscopy)
      • Raman Spectroscopy
      • Occlusion Spectroscopy
      • Optical Coherence Tomography
      • Thermal Emission Spectroscopy
      • Photoacoustic Spectroscopy
      • Impedance/Dielectric Spectroscopy
      • Electromagnetic
      • Polarimetry
      • Fluorescence
    • Y-o-Y Growth Trend Analysis By Technology , 2020 to 2024
    • Absolute $ Opportunity Analysis By Technology , 2025 to 2035
  7. Global Market Analysis 2020 to 2024 and Forecast 2025 to 2035, By Modality
    • Introduction / Key Findings
    • Historical Market Size Value (USD Million) Analysis By Modality, 2020 to 2024
    • Current and Future Market Size Value (USD Million) Analysis and Forecast By Modality, 2025 to 2035
      • Wearable Blood Glucose Monitoring Systems
      • Non-Wearable /Table Top Blood Glucose Monitoring Systems
    • Y-o-Y Growth Trend Analysis By Modality, 2020 to 2024
    • Absolute $ Opportunity Analysis By Modality, 2025 to 2035
  8. Global Market Analysis 2020 to 2024 and Forecast 2025 to 2035, By End User
    • Introduction / Key Findings
    • Historical Market Size Value (USD Million) Analysis By End User, 2020 to 2024
    • Current and Future Market Size Value (USD Million) Analysis and Forecast By End User, 2025 to 2035
      • Hospitals
      • Home Care Settings
      • Clinics
    • Y-o-Y Growth Trend Analysis By End User, 2020 to 2024
    • Absolute $ Opportunity Analysis By End User, 2025 to 2035
  9. Global Market Analysis 2020 to 2024 and Forecast 2025 to 2035, By Region
    • Introduction
    • Historical Market Size Value (USD Million) Analysis By Region, 2020 to 2024
    • Current Market Size Value (USD Million) Analysis and Forecast By Region, 2025 to 2035
      • North America
      • Latin America
      • Western Europe
      • Eastern Europe
      • East Asia
      • South Asia and Pacific
      • Middle East & Africa
    • Market Attractiveness Analysis By Region
  10. North America Market Analysis 2020 to 2024 and Forecast 2025 to 2035, By Country
    • Historical Market Size Value (USD Million) Trend Analysis By Market Taxonomy, 2020 to 2024
    • Market Size Value (USD Million) Forecast By Market Taxonomy, 2025 to 2035
      • By Country
        • USA
        • Canada
        • Mexico
      • By Technology
      • By Modality
      • By End User
    • Market Attractiveness Analysis
      • By Country
      • By Technology
      • By Modality
      • By End User
    • Key Takeaways
  11. Latin America Market Analysis 2020 to 2024 and Forecast 2025 to 2035, By Country
    • Historical Market Size Value (USD Million) Trend Analysis By Market Taxonomy, 2020 to 2024
    • Market Size Value (USD Million) Forecast By Market Taxonomy, 2025 to 2035
      • By Country
        • Brazil
        • Chile
        • Rest of Latin America
      • By Technology
      • By Modality
      • By End User
    • Market Attractiveness Analysis
      • By Country
      • By Technology
      • By Modality
      • By End User
    • Key Takeaways
  12. Western Europe Market Analysis 2020 to 2024 and Forecast 2025 to 2035, By Country
    • Historical Market Size Value (USD Million) Trend Analysis By Market Taxonomy, 2020 to 2024
    • Market Size Value (USD Million) Forecast By Market Taxonomy, 2025 to 2035
      • By Country
        • Germany
        • UK
        • Italy
        • Spain
        • France
        • Nordic
        • BENELUX
        • Rest of Western Europe
      • By Technology
      • By Modality
      • By End User
    • Market Attractiveness Analysis
      • By Country
      • By Technology
      • By Modality
      • By End User
    • Key Takeaways
  13. Eastern Europe Market Analysis 2020 to 2024 and Forecast 2025 to 2035, By Country
    • Historical Market Size Value (USD Million) Trend Analysis By Market Taxonomy, 2020 to 2024
    • Market Size Value (USD Million) Forecast By Market Taxonomy, 2025 to 2035
      • By Country
        • Russia
        • Poland
        • Hungary
        • Balkan & Baltic
        • Rest of Eastern Europe
      • By Technology
      • By Modality
      • By End User
    • Market Attractiveness Analysis
      • By Country
      • By Technology
      • By Modality
      • By End User
    • Key Takeaways
  14. East Asia Market Analysis 2020 to 2024 and Forecast 2025 to 2035, By Country
    • Historical Market Size Value (USD Million) Trend Analysis By Market Taxonomy, 2020 to 2024
    • Market Size Value (USD Million) Forecast By Market Taxonomy, 2025 to 2035
      • By Country
        • China
        • Japan
        • South Korea
      • By Technology
      • By Modality
      • By End User
    • Market Attractiveness Analysis
      • By Country
      • By Technology
      • By Modality
      • By End User
    • Key Takeaways
  15. South Asia and Pacific Market Analysis 2020 to 2024 and Forecast 2025 to 2035, By Country
    • Historical Market Size Value (USD Million) Trend Analysis By Market Taxonomy, 2020 to 2024
    • Market Size Value (USD Million) Forecast By Market Taxonomy, 2025 to 2035
      • By Country
        • India
        • ASEAN
        • Australia & New Zealand
        • Rest of South Asia and Pacific
      • By Technology
      • By Modality
      • By End User
    • Market Attractiveness Analysis
      • By Country
      • By Technology
      • By Modality
      • By End User
    • Key Takeaways
  16. Middle East & Africa Market Analysis 2020 to 2024 and Forecast 2025 to 2035, By Country
    • Historical Market Size Value (USD Million) Trend Analysis By Market Taxonomy, 2020 to 2024
    • Market Size Value (USD Million) Forecast By Market Taxonomy, 2025 to 2035
      • By Country
        • Kingdom of Saudi Arabia
        • Other GCC Countries
        • Turkiye
        • South Africa
        • Other African Union
        • Rest of Middle East & Africa
      • By Technology
      • By Modality
      • By End User
    • Market Attractiveness Analysis
      • By Country
      • By Technology
      • By Modality
      • By End User
    • Key Takeaways
  17. Key Countries Market Analysis
    • USA
      • Pricing Analysis
      • Market Share Analysis, 2024
        • By Technology
        • By Modality
        • By End User
    • Canada
      • Pricing Analysis
      • Market Share Analysis, 2024
        • By Technology
        • By Modality
        • By End User
    • Mexico
      • Pricing Analysis
      • Market Share Analysis, 2024
        • By Technology
        • By Modality
        • By End User
    • Brazil
      • Pricing Analysis
      • Market Share Analysis, 2024
        • By Technology
        • By Modality
        • By End User
    • Chile
      • Pricing Analysis
      • Market Share Analysis, 2024
        • By Technology
        • By Modality
        • By End User
    • Germany
      • Pricing Analysis
      • Market Share Analysis, 2024
        • By Technology
        • By Modality
        • By End User
    • UK
      • Pricing Analysis
      • Market Share Analysis, 2024
        • By Technology
        • By Modality
        • By End User
    • Italy
      • Pricing Analysis
      • Market Share Analysis, 2024
        • By Technology
        • By Modality
        • By End User
    • Spain
      • Pricing Analysis
      • Market Share Analysis, 2024
        • By Technology
        • By Modality
        • By End User
    • France
      • Pricing Analysis
      • Market Share Analysis, 2024
        • By Technology
        • By Modality
        • By End User
    • India
      • Pricing Analysis
      • Market Share Analysis, 2024
        • By Technology
        • By Modality
        • By End User
    • ASEAN
      • Pricing Analysis
      • Market Share Analysis, 2024
        • By Technology
        • By Modality
        • By End User
    • Australia & New Zealand
      • Pricing Analysis
      • Market Share Analysis, 2024
        • By Technology
        • By Modality
        • By End User
    • China
      • Pricing Analysis
      • Market Share Analysis, 2024
        • By Technology
        • By Modality
        • By End User
    • Japan
      • Pricing Analysis
      • Market Share Analysis, 2024
        • By Technology
        • By Modality
        • By End User
    • South Korea
      • Pricing Analysis
      • Market Share Analysis, 2024
        • By Technology
        • By Modality
        • By End User
    • Russia
      • Pricing Analysis
      • Market Share Analysis, 2024
        • By Technology
        • By Modality
        • By End User
    • Poland
      • Pricing Analysis
      • Market Share Analysis, 2024
        • By Technology
        • By Modality
        • By End User
    • Hungary
      • Pricing Analysis
      • Market Share Analysis, 2024
        • By Technology
        • By Modality
        • By End User
    • Kingdom of Saudi Arabia
      • Pricing Analysis
      • Market Share Analysis, 2024
        • By Technology
        • By Modality
        • By End User
    • Turkiye
      • Pricing Analysis
      • Market Share Analysis, 2024
        • By Technology
        • By Modality
        • By End User
    • South Africa
      • Pricing Analysis
      • Market Share Analysis, 2024
        • By Technology
        • By Modality
        • By End User
  18. Market Structure Analysis
    • Competition Dashboard
    • Competition Benchmarking
    • Market Share Analysis of Top Players
      • By Regional
      • By Technology
      • By Modality
      • By End User
  19. Competition Analysis
    • Competition Deep Dive
      • Abbott Laboratories
        • Overview
        • Product Portfolio
        • Profitability by Market Segments (Product/Age /Sales Channel/Region)
        • Sales Footprint
        • Strategy Overview
          • Marketing Strategy
          • Product Strategy
          • Channel Strategy
      • Dexcom Inc.
      • Medtronic plc
      • Senseonics Holdings
      • Nemaura Medical
      • OrSense Ltd.
      • DiaMonTech GmbH
      • MediWise / Occuity Ltd.
      • Know Labs Inc.
      • Integrity Applications (GlucoTrack)
      • OptiScan Biomedical
      • CNOGA Medical
      • Biolinq Inc.
      • Movano Health
      • Verily Life Sciences
      • GlucoSense Diagnostics
      • Apple Inc.
      • Scanbo Corp.
      • DiaMonTech GmbH
      • RSP Systems
  20. Assumptions & Acronyms Used
  21. Research Methodology

List of Tables

  • Table 1: Global Market Value (USD Million) Forecast by Region, 2020 to 2035
  • Table 2: Global Market Value (USD Million) Forecast by Technology , 2020 to 2035
  • Table 3: Global Market Value (USD Million) Forecast by Modality, 2020 to 2035
  • Table 4: Global Market Value (USD Million) Forecast by End User, 2020 to 2035
  • Table 5: North America Market Value (USD Million) Forecast by Country, 2020 to 2035
  • Table 6: North America Market Value (USD Million) Forecast by Technology , 2020 to 2035
  • Table 7: North America Market Value (USD Million) Forecast by Modality, 2020 to 2035
  • Table 8: North America Market Value (USD Million) Forecast by End User, 2020 to 2035
  • Table 9: Latin America Market Value (USD Million) Forecast by Country, 2020 to 2035
  • Table 10: Latin America Market Value (USD Million) Forecast by Technology , 2020 to 2035
  • Table 11: Latin America Market Value (USD Million) Forecast by Modality, 2020 to 2035
  • Table 12: Latin America Market Value (USD Million) Forecast by End User, 2020 to 2035
  • Table 13: Western Europe Market Value (USD Million) Forecast by Country, 2020 to 2035
  • Table 14: Western Europe Market Value (USD Million) Forecast by Technology , 2020 to 2035
  • Table 15: Western Europe Market Value (USD Million) Forecast by Modality, 2020 to 2035
  • Table 16: Western Europe Market Value (USD Million) Forecast by End User, 2020 to 2035
  • Table 17: Eastern Europe Market Value (USD Million) Forecast by Country, 2020 to 2035
  • Table 18: Eastern Europe Market Value (USD Million) Forecast by Technology , 2020 to 2035
  • Table 19: Eastern Europe Market Value (USD Million) Forecast by Modality, 2020 to 2035
  • Table 20: Eastern Europe Market Value (USD Million) Forecast by End User, 2020 to 2035
  • Table 21: East Asia Market Value (USD Million) Forecast by Country, 2020 to 2035
  • Table 22: East Asia Market Value (USD Million) Forecast by Technology , 2020 to 2035
  • Table 23: East Asia Market Value (USD Million) Forecast by Modality, 2020 to 2035
  • Table 24: East Asia Market Value (USD Million) Forecast by End User, 2020 to 2035
  • Table 25: South Asia and Pacific Market Value (USD Million) Forecast by Country, 2020 to 2035
  • Table 26: South Asia and Pacific Market Value (USD Million) Forecast by Technology , 2020 to 2035
  • Table 27: South Asia and Pacific Market Value (USD Million) Forecast by Modality, 2020 to 2035
  • Table 28: South Asia and Pacific Market Value (USD Million) Forecast by End User, 2020 to 2035
  • Table 29: Middle East & Africa Market Value (USD Million) Forecast by Country, 2020 to 2035
  • Table 30: Middle East & Africa Market Value (USD Million) Forecast by Technology , 2020 to 2035
  • Table 31: Middle East & Africa Market Value (USD Million) Forecast by Modality, 2020 to 2035
  • Table 32: Middle East & Africa Market Value (USD Million) Forecast by End User, 2020 to 2035

List of Figures

  • Figure 1: Global Market Pricing Analysis
  • Figure 2: Global Market Value (USD Million) Forecast 2020 to 2035
  • Figure 3: Global Market Value Share and BPS Analysis by Technology , 2025 and 2035
  • Figure 4: Global Market Y-o-Y Growth Comparison by Technology , 2025 to 2035
  • Figure 5: Global Market Attractiveness Analysis by Technology
  • Figure 6: Global Market Value Share and BPS Analysis by Modality, 2025 and 2035
  • Figure 7: Global Market Y-o-Y Growth Comparison by Modality, 2025 to 2035
  • Figure 8: Global Market Attractiveness Analysis by Modality
  • Figure 9: Global Market Value Share and BPS Analysis by End User, 2025 and 2035
  • Figure 10: Global Market Y-o-Y Growth Comparison by End User, 2025 to 2035
  • Figure 11: Global Market Attractiveness Analysis by End User
  • Figure 12: Global Market Value (USD Million) Share and BPS Analysis by Region, 2025 and 2035
  • Figure 13: Global Market Y-o-Y Growth Comparison by Region, 2025 to 2035
  • Figure 14: Global Market Attractiveness Analysis by Region
  • Figure 15: North America Market Incremental Dollar Opportunity, 2025 to 2035
  • Figure 16: Latin America Market Incremental Dollar Opportunity, 2025 to 2035
  • Figure 17: Western Europe Market Incremental Dollar Opportunity, 2025 to 2035
  • Figure 18: Eastern Europe Market Incremental Dollar Opportunity, 2025 to 2035
  • Figure 19: East Asia Market Incremental Dollar Opportunity, 2025 to 2035
  • Figure 20: South Asia and Pacific Market Incremental Dollar Opportunity, 2025 to 2035
  • Figure 21: Middle East & Africa Market Incremental Dollar Opportunity, 2025 to 2035
  • Figure 22: North America Market Value Share and BPS Analysis by Country, 2025 and 2035
  • Figure 23: North America Market Value Share and BPS Analysis by Technology , 2025 and 2035
  • Figure 24: North America Market Y-o-Y Growth Comparison by Technology , 2025 to 2035
  • Figure 25: North America Market Attractiveness Analysis by Technology
  • Figure 26: North America Market Value Share and BPS Analysis by Modality, 2025 and 2035
  • Figure 27: North America Market Y-o-Y Growth Comparison by Modality, 2025 to 2035
  • Figure 28: North America Market Attractiveness Analysis by Modality
  • Figure 29: North America Market Value Share and BPS Analysis by End User, 2025 and 2035
  • Figure 30: North America Market Y-o-Y Growth Comparison by End User, 2025 to 2035
  • Figure 31: North America Market Attractiveness Analysis by End User
  • Figure 32: Latin America Market Value Share and BPS Analysis by Country, 2025 and 2035
  • Figure 33: Latin America Market Value Share and BPS Analysis by Technology , 2025 and 2035
  • Figure 34: Latin America Market Y-o-Y Growth Comparison by Technology , 2025 to 2035
  • Figure 35: Latin America Market Attractiveness Analysis by Technology
  • Figure 36: Latin America Market Value Share and BPS Analysis by Modality, 2025 and 2035
  • Figure 37: Latin America Market Y-o-Y Growth Comparison by Modality, 2025 to 2035
  • Figure 38: Latin America Market Attractiveness Analysis by Modality
  • Figure 39: Latin America Market Value Share and BPS Analysis by End User, 2025 and 2035
  • Figure 40: Latin America Market Y-o-Y Growth Comparison by End User, 2025 to 2035
  • Figure 41: Latin America Market Attractiveness Analysis by End User
  • Figure 42: Western Europe Market Value Share and BPS Analysis by Country, 2025 and 2035
  • Figure 43: Western Europe Market Value Share and BPS Analysis by Technology , 2025 and 2035
  • Figure 44: Western Europe Market Y-o-Y Growth Comparison by Technology , 2025 to 2035
  • Figure 45: Western Europe Market Attractiveness Analysis by Technology
  • Figure 46: Western Europe Market Value Share and BPS Analysis by Modality, 2025 and 2035
  • Figure 47: Western Europe Market Y-o-Y Growth Comparison by Modality, 2025 to 2035
  • Figure 48: Western Europe Market Attractiveness Analysis by Modality
  • Figure 49: Western Europe Market Value Share and BPS Analysis by End User, 2025 and 2035
  • Figure 50: Western Europe Market Y-o-Y Growth Comparison by End User, 2025 to 2035
  • Figure 51: Western Europe Market Attractiveness Analysis by End User
  • Figure 52: Eastern Europe Market Value Share and BPS Analysis by Country, 2025 and 2035
  • Figure 53: Eastern Europe Market Value Share and BPS Analysis by Technology , 2025 and 2035
  • Figure 54: Eastern Europe Market Y-o-Y Growth Comparison by Technology , 2025 to 2035
  • Figure 55: Eastern Europe Market Attractiveness Analysis by Technology
  • Figure 56: Eastern Europe Market Value Share and BPS Analysis by Modality, 2025 and 2035
  • Figure 57: Eastern Europe Market Y-o-Y Growth Comparison by Modality, 2025 to 2035
  • Figure 58: Eastern Europe Market Attractiveness Analysis by Modality
  • Figure 59: Eastern Europe Market Value Share and BPS Analysis by End User, 2025 and 2035
  • Figure 60: Eastern Europe Market Y-o-Y Growth Comparison by End User, 2025 to 2035
  • Figure 61: Eastern Europe Market Attractiveness Analysis by End User
  • Figure 62: East Asia Market Value Share and BPS Analysis by Country, 2025 and 2035
  • Figure 63: East Asia Market Value Share and BPS Analysis by Technology , 2025 and 2035
  • Figure 64: East Asia Market Y-o-Y Growth Comparison by Technology , 2025 to 2035
  • Figure 65: East Asia Market Attractiveness Analysis by Technology
  • Figure 66: East Asia Market Value Share and BPS Analysis by Modality, 2025 and 2035
  • Figure 67: East Asia Market Y-o-Y Growth Comparison by Modality, 2025 to 2035
  • Figure 68: East Asia Market Attractiveness Analysis by Modality
  • Figure 69: East Asia Market Value Share and BPS Analysis by End User, 2025 and 2035
  • Figure 70: East Asia Market Y-o-Y Growth Comparison by End User, 2025 to 2035
  • Figure 71: East Asia Market Attractiveness Analysis by End User
  • Figure 72: South Asia and Pacific Market Value Share and BPS Analysis by Country, 2025 and 2035
  • Figure 73: South Asia and Pacific Market Value Share and BPS Analysis by Technology , 2025 and 2035
  • Figure 74: South Asia and Pacific Market Y-o-Y Growth Comparison by Technology , 2025 to 2035
  • Figure 75: South Asia and Pacific Market Attractiveness Analysis by Technology
  • Figure 76: South Asia and Pacific Market Value Share and BPS Analysis by Modality, 2025 and 2035
  • Figure 77: South Asia and Pacific Market Y-o-Y Growth Comparison by Modality, 2025 to 2035
  • Figure 78: South Asia and Pacific Market Attractiveness Analysis by Modality
  • Figure 79: South Asia and Pacific Market Value Share and BPS Analysis by End User, 2025 and 2035
  • Figure 80: South Asia and Pacific Market Y-o-Y Growth Comparison by End User, 2025 to 2035
  • Figure 81: South Asia and Pacific Market Attractiveness Analysis by End User
  • Figure 82: Middle East & Africa Market Value Share and BPS Analysis by Country, 2025 and 2035
  • Figure 83: Middle East & Africa Market Value Share and BPS Analysis by Technology , 2025 and 2035
  • Figure 84: Middle East & Africa Market Y-o-Y Growth Comparison by Technology , 2025 to 2035
  • Figure 85: Middle East & Africa Market Attractiveness Analysis by Technology
  • Figure 86: Middle East & Africa Market Value Share and BPS Analysis by Modality, 2025 and 2035
  • Figure 87: Middle East & Africa Market Y-o-Y Growth Comparison by Modality, 2025 to 2035
  • Figure 88: Middle East & Africa Market Attractiveness Analysis by Modality
  • Figure 89: Middle East & Africa Market Value Share and BPS Analysis by End User, 2025 and 2035
  • Figure 90: Middle East & Africa Market Y-o-Y Growth Comparison by End User, 2025 to 2035
  • Figure 91: Middle East & Africa Market Attractiveness Analysis by End User
  • Figure 92: Global Market – Tier Structure Analysis
  • Figure 93: Global Market – Company Share Analysis

Frequently Asked Questions

How big is the non-invasive blood glucose monitoring devices market in 2025?

The global non-invasive blood glucose monitoring devices market is estimated to be valued at USD 9.3 billion in 2025.

What will be the size of non-invasive blood glucose monitoring devices market in 2035?

The market size for the non-invasive blood glucose monitoring devices market is projected to reach USD 21.9 billion by 2035.

How much will be the non-invasive blood glucose monitoring devices market growth between 2025 and 2035?

The non-invasive blood glucose monitoring devices market is expected to grow at a 8.9% CAGR between 2025 and 2035.

What are the key product types in the non-invasive blood glucose monitoring devices market?

The key product types in non-invasive blood glucose monitoring devices market are mir/nir (mid/near infrared spectroscopy), raman spectroscopy, occlusion spectroscopy, optical coherence tomography, thermal emission spectroscopy, photoacoustic spectroscopy, impedance/dielectric spectroscopy, electromagnetic, polarimetry and fluorescence.

Which modality segment to contribute significant share in the non-invasive blood glucose monitoring devices market in 2025?

In terms of modality, wearable blood glucose monitoring systems segment to command 61.3% share in the non-invasive blood glucose monitoring devices market in 2025.

Explore Similar Insights

Future Market Insights

Non-Invasive Blood Glucose Monitoring Devices Market

Chat With MaRIA

Chat With

MaRIA

Hi There, I am MaRIA, Your Market Research Intelligence Assistant. How may I help you?