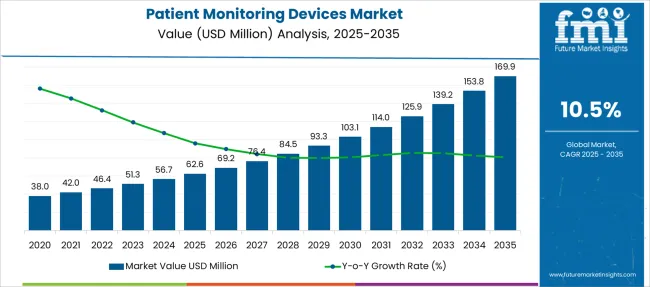
The Patient Monitoring Devices Market is estimated to be valued at USD 62.6 million in 2025 and is projected to reach USD 169.9 million by 2035, registering a compound annual growth rate (CAGR) of 10.5% over the forecast period.
| Metric | Value |
|---|---|
| Patient Monitoring Devices Market Estimated Value in (2025 E) | USD 62.6 million |
| Patient Monitoring Devices Market Forecast Value in (2035 F) | USD 169.9 million |
| Forecast CAGR (2025 to 2035) | 10.5% |
The Patient Monitoring Devices market is undergoing significant expansion driven by the global increase in chronic diseases, growing aging populations, and rising demand for real-time health data across healthcare systems. The current landscape reflects a growing dependence on remote and continuous monitoring technologies, particularly in post-acute care settings. Clinical evidence and health institution reports indicate that patient-centric care models and outcome-based reimbursement systems are accelerating the integration of connected monitoring solutions.
Hospitals and care providers are increasingly prioritizing early diagnosis and timely intervention, both of which are enabled by advanced patient monitoring systems. In addition, healthcare digitization, including the adoption of electronic health records and telehealth infrastructure, is reinforcing the demand for seamless device interoperability and data-driven decision-making.
As noted in hospital procurement news and technology integration updates, this market is also witnessing growth due to favorable government policies and funding for modernizing care delivery These combined factors are expected to continue shaping a dynamic and opportunity-rich future for the Patient Monitoring Devices market.
The market is segmented by Product Type and End User and region. By Product Type, the market is divided into Cardiac Monitoring Devices, Blood Glucose Monitoring Systems, Multi-parameter Monitoring Devices, and Temperature Monitoring Devices. In terms of End User, the market is classified into Hospitals, Ambulatory Surgery Centers, Home Care Settings, and Other End-user. Regionally, the market is classified into North America, Latin America, Western Europe, Eastern Europe, Balkan & Baltic Countries, Russia & Belarus, Central Asia, East Asia, South Asia & Pacific, and the Middle East & Africa.
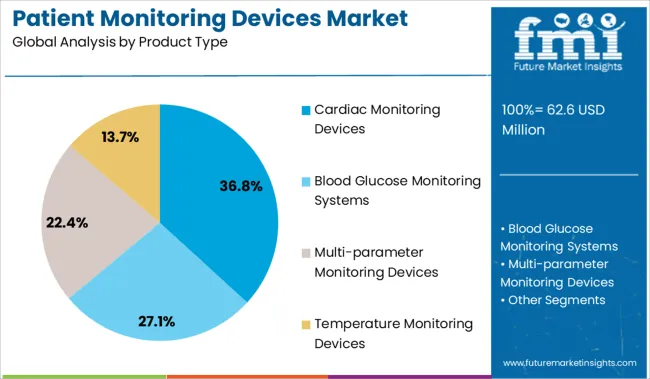
The cardiac monitoring devices segment is projected to account for 36.8% of the Patient Monitoring Devices market revenue share in 2025, making it the leading product type. This dominance is being driven by the increasing global burden of cardiovascular diseases, which has raised the demand for precise, continuous heart monitoring solutions in both inpatient and ambulatory settings.
Reports from medical associations and health institutes have emphasized the importance of early cardiac event detection, which is being enabled by wearable and implantable cardiac monitors integrated with advanced algorithms. These devices are being increasingly adopted in emergency departments, cardiac care units, and remote settings due to their reliability in detecting arrhythmias, ischemic events, and other cardiovascular anomalies.
Furthermore, manufacturers have accelerated innovation in compact, wireless, and user-friendly devices, improving patient compliance and enabling long-term monitoring These developments have collectively supported the segment's sustained leadership by addressing key clinical needs and supporting early intervention protocols across health systems.
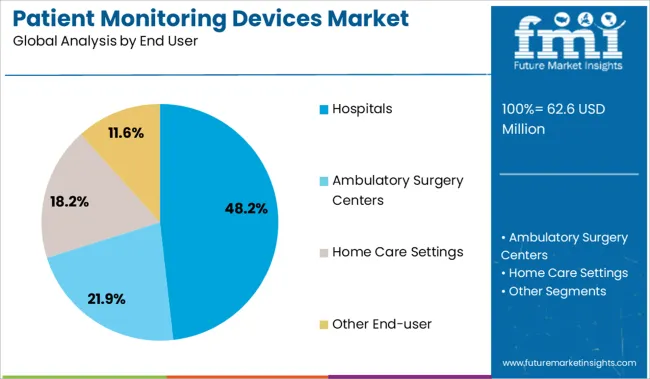
The hospitals segment is expected to hold 48.2% of the Patient Monitoring Devices market revenue share in 2025, positioning it as the leading end user. The segment’s growth is being supported by the high patient volumes and broad scope of clinical procedures that require continuous and intensive monitoring. Hospitals have been prioritizing patient safety and operational efficiency, both of which are enhanced by real-time monitoring devices that provide immediate alerts and integrate directly into electronic health records.
Institutional reports and care standard guidelines have noted that centralized monitoring systems in hospitals are enabling timely medical intervention and reducing adverse events. Additionally, funding for infrastructure upgrades and mandates for quality care delivery have prompted hospitals to invest in technologically advanced monitoring systems.
These systems are also being aligned with infection control protocols and patient mobility requirements, enabling continuous monitoring in critical care, surgical recovery, and general wards These factors have reinforced the hospital segment's leading share in the overall market.
As per the Patient Monitoring Devices Market research by Future Market Insights - a market research and competitive intelligence provider, historically, from 2020 to 2024, the market value of the Patient Monitoring Devices Market increased at around 8.8% CAGR.
As a part of a value-based care approach, multiple healthcare providers have started to invest in technologies pertaining to remote patient monitoring. Patient monitoring devices aid in the monitoring and management of high-risk patients with chronic conditions that are deemed unstable. It also shortens a patient's stay in the intensive care unit and hospital wards.
The availability of remote monitoring devices with smartphone connectivity, including remote cardiac implants, electromyogram monitors, and blood pressure monitors, is projected to fuel the market expansion. Furthermore, as the demand for greater connectivity and data accessibility grows, medical device companies are investing in enhanced monitoring equipment, which will help the market grow.
Due to a surge in sedentary lifestyles, such as poor nutrition, physical inactivity, and high sugar consumption, the market is expected to develop significantly over the forecast period, leading to various chronic disorders such as obesity, and diabetes.
As the frequency of chronic illnesses such as diabetes, stroke, and kidney disease grows, the requirement for patient monitoring equipment is also expected to surge. The increase in the geriatric population is one of the primary reasons driving the market forward. Furthermore, market growth is also aided by a rise in the number of people who suffer from numerous lifestyle conditions such as cancer and atherosclerosis.
The growing popularity of wearable and remote patient monitoring devices is also propelling the industry forward. Biosensors, wearable patient monitoring devices, and smart implants are utilized across several applications, which include temperature monitoring, continuous glucose monitoring, pulse oximeter, and blood pressure monitoring, to name a few. The IoT is built into the latest generation of wearable devices. Wearable biosensors monitor vital signs such as weight, blood pressure, blood sugar, and electrocardiography, which are sent to a central server via connectivity.
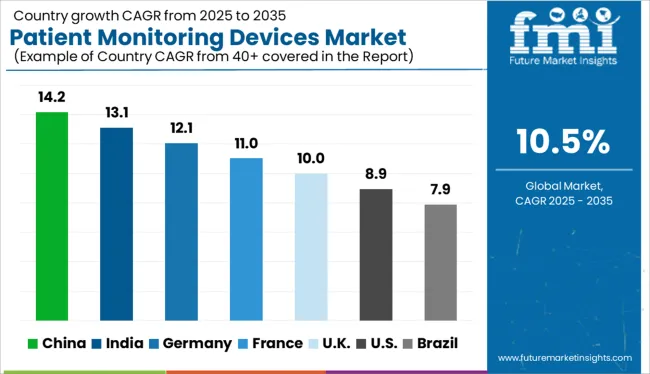
In 2024, North America led the market for patient monitoring devices, accounting for over 40% of global sales. The increased rate of chronic illnesses, coupled with sophisticated technology, and the demand for mobile and portable solutions to lower out-of-pocket expenditures, are pushing the industry in this field. Major market players such as GE Healthcare, Masimo Corporation, and Edward Lifesciences are also investing in research and development for more advanced patient monitoring device facilities, which will increase the market in the forthcoming years.
The market for patient monitoring devices in Europe is expected to grow at a CAGR of over 12% from 2025 to 2035. In several European countries, the prevalence of chronic diseases is rising. As a result, European countries are updating their healthcare infrastructure in order to serve better and treat their people. The market need for vital sign monitors is expected to grow as the prevalence of chronic diseases rises, the population ages, and infrastructure improves. Furthermore, the growing preference for in-house medical care in Europe is expected to drive market growth during the projection period.
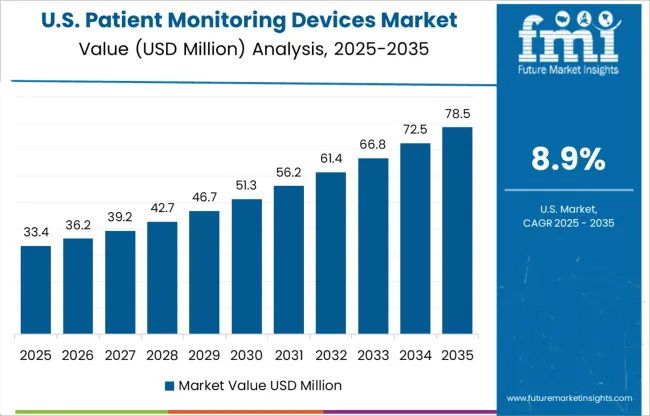
USA Patient Monitoring Devices Market Analysis The market in the USA is projected to reach a valuation of USD 169.9 Billion by 2035. Growing at a CAGR of 11.1% from 2025 to 2035, the market in the country is expected to gross an absolute dollar opportunity of USD 31.2 Billion. The UK Patient Monitoring Devices Market Analysis The market in the country is expected to reach USD 5.5 Million by 2035.
During the forecast period, the market in the country is expected to garner an absolute dollar opportunity of USD 62.6 Billion from 2025 to 2035. Japan Patient Monitoring Devices Market Analysis In Japan, the market is projected to reach USD 4.7 Billion by 2035. The market in the country is expected to gross USD 3 Billion in absolute dollar opportunity from 2025 to 2035.
In 2024, the patient monitoring devices market was dominated by blood glucose monitoring systems. The category is predicted to rise due to rising diabetes incidences, new product launches, and rising usage of blood glucose monitoring devices in emerging countries. Also, it is projected to grow at a CAGR of over 12.2% from 2025 to 2035.
Consumers use glucometers, or portable blood glucose meters to monitor their blood sugar levels, which analyze blood generally from the tip of a finger. Patients with diabetes could learn about their health by checking their blood glucose levels on a regular basis. Monitoring one’s blood glucose levels can enable the doctor, as well as the rest of the healthcare providers, to make essential decisions regarding medication dose, exercise, and food.
Revenue through the hospital segment leads the global market, accounting for a CAGR of more than 10% from 2020 to 2024. The increased emphasis on effective and early disease diagnosis in hospitals and the expanding procedural volume in hospital settings are expected to account for a considerable proportion of the market. As per American Heart Association (AHA), more than 209,000 deaths were reported in medical centers in 2020, with the number expected to climb to nearly 169.9 million by 2035.
Over the projected period, the market through home care settings is expected to increase rapidly. The drive toward mobility and care at the bedside is hastening the development of the next generation of therapeutic, diagnostic, display, and monitoring technology which is more adaptive, and precise.
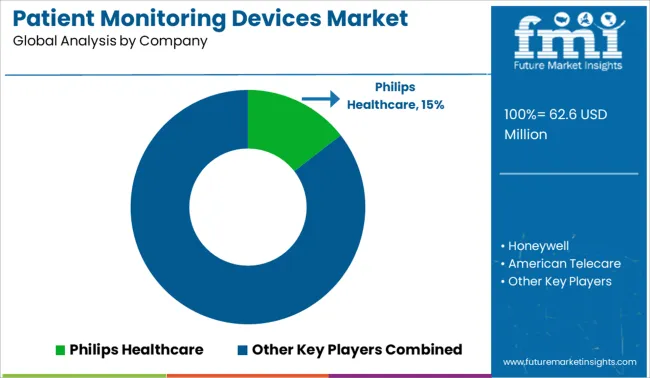
Honeywell, American Telecare, Roche, Philips Healthcare, Intel, Welch Allyn, Health anywhere Inc., Johnson & Johnson, Bosch, Biotronik, and Covidien Plc are the key players operating in the market.
Some of the recent developments of Patient Monitoring Devices Market key providers are as follows:
The global patient monitoring devices market is estimated to be valued at USD 62.6 million in 2025.
The market size for the patient monitoring devices market is projected to reach USD 169.9 million by 2035.
The patient monitoring devices market is expected to grow at a 10.5% CAGR between 2025 and 2035.
The key product types in patient monitoring devices market are cardiac monitoring devices, blood glucose monitoring systems, multi-parameter monitoring devices and temperature monitoring devices.
In terms of end user, hospitals segment to command 48.2% share in the patient monitoring devices market in 2025.


Our Research Products

The "Full Research Suite" delivers actionable market intel, deep dives on markets or technologies, so clients act faster, cut risk, and unlock growth.

The Leaderboard benchmarks and ranks top vendors, classifying them as Established Leaders, Leading Challengers, or Disruptors & Challengers.

Locates where complements amplify value and substitutes erode it, forecasting net impact by horizon

We deliver granular, decision-grade intel: market sizing, 5-year forecasts, pricing, adoption, usage, revenue, and operational KPIs—plus competitor tracking, regulation, and value chains—across 60 countries broadly.

Spot the shifts before they hit your P&L. We track inflection points, adoption curves, pricing moves, and ecosystem plays to show where demand is heading, why it is changing, and what to do next across high-growth markets and disruptive tech

Real-time reads of user behavior. We track shifting priorities, perceptions of today’s and next-gen services, and provider experience, then pace how fast tech moves from trial to adoption, blending buyer, consumer, and channel inputs with social signals (#WhySwitch, #UX).

Partner with our analyst team to build a custom report designed around your business priorities. From analysing market trends to assessing competitors or crafting bespoke datasets, we tailor insights to your needs.
Supplier Intelligence
Discovery & Profiling
Capacity & Footprint
Performance & Risk
Compliance & Governance
Commercial Readiness
Who Supplies Whom
Scorecards & Shortlists
Playbooks & Docs
Category Intelligence
Definition & Scope
Demand & Use Cases
Cost Drivers
Market Structure
Supply Chain Map
Trade & Policy
Operating Norms
Deliverables
Buyer Intelligence
Account Basics
Spend & Scope
Procurement Model
Vendor Requirements
Terms & Policies
Entry Strategy
Pain Points & Triggers
Outputs
Pricing Analysis
Benchmarks
Trends
Should-Cost
Indexation
Landed Cost
Commercial Terms
Deliverables
Brand Analysis
Positioning & Value Prop
Share & Presence
Customer Evidence
Go-to-Market
Digital & Reputation
Compliance & Trust
KPIs & Gaps
Outputs
Full Research Suite comprises of:
Market outlook & trends analysis
Interviews & case studies
Strategic recommendations
Vendor profiles & capabilities analysis
5-year forecasts
8 regions and 60+ country-level data splits
Market segment data splits
12 months of continuous data updates
DELIVERED AS:
PDF EXCEL ONLINE
Remote Patient Monitoring Devices Market Size and Share Forecast Outlook 2025 to 2035
Patient Monitoring System Market Size and Share Forecast Outlook 2025 to 2035
Patient Monitoring Accessories Market Size and Share Forecast Outlook 2025 to 2035
Patient Monitoring Pods Market
Pain Monitoring Devices Market Size and Share Forecast Outlook 2025 to 2035
Dose Monitoring Devices Market - Growth & Demand 2025 to 2035
Remote Patient Monitoring System Market Size and Share Forecast Outlook 2025 to 2035
Noise Monitoring Devices Market Size and Share Forecast Outlook 2025 to 2035
Nerve Monitoring Devices Market Insights - Growth & Forecast 2025 to 2035
Digital Patient Monitoring System Market Analysis – Size, Share & Forecast 2024-2034
Central Patient Monitoring System Market
Wireless Patient Monitoring Market Size and Share Forecast Outlook 2025 to 2035
Lactate Monitoring Devices Market Size and Share Forecast Outlook 2025 to 2035
Epilepsy Monitoring Devices Market Growth - Trends & Forecast 2025 to 2035
Compliance Monitoring Devices Market Trends and Forecast 2025 to 2035
Vital Signs Monitoring Devices Market Analysis - Trends & Forecast 2025 to 2035
Critical Care Patient Monitoring Products Market Forecast and Outlook 2025 to 2035
Multiparameter Patient Monitoring Systems Market Size and Share Forecast Outlook 2025 to 2035
MRI Compatible Patient Monitoring Systems Market Size and Share Forecast Outlook 2025 to 2035
Blood Glucose Monitoring Devices Market Size and Share Forecast Outlook 2025 to 2035

Thank you!
You will receive an email from our Business Development Manager. Please be sure to check your SPAM/JUNK folder too.
Chat With
MaRIA